. 2017 May 24;18(1):98.
doi: 10.1186/s13059-017-1224-0.

N-BLR, a primate-specific non-coding transcript leads to colorectal cancer invasion and migration

Affiliations

N-BLR, a primate-specific non-coding transcript leads to colorectal cancer invasion and migration

Isidore Rigoutsos et al. Genome Biol. .

Abstract

Background: Non-coding RNAs have been drawing increasing attention in recent years as functional data suggest that they play important roles in key cellular processes. N-BLR is a primate-specific long non-coding RNA that modulates the epithelial-to-mesenchymal transition, facilitates cell migration, and increases colorectal cancer invasion.

Results: We performed multivariate analyses of data from two independent cohorts of colorectal cancer patients and show that the abundance of N-BLR is associated with tumor stage, invasion potential, and overall patient survival. Through in vitro and in vivo experiments we found that N-BLR facilitates migration primarily via crosstalk with E-cadherin and ZEB1. We showed that this crosstalk is mediated by a pyknon, a short ~20 nucleotide-long DNA motif contained in the N-BLR transcript and is targeted by members of the miR-200 family. In light of these findings, we used a microarray to investigate the expression patterns of other pyknon-containing genomic loci. We found multiple such loci that are differentially transcribed between healthy and diseased tissues in colorectal cancer and chronic lymphocytic leukemia. Moreover, we identified several new loci whose expression correlates with the colorectal cancer patients' overall survival.

Conclusions: The primate-specific N-BLR is a novel molecular contributor to the complex mechanisms that underlie metastasis in colorectal cancer and a potential novel biomarker for this disease. The presence of a functional pyknon within N-BLR and the related finding that many more pyknon-containing genomic loci in the human genome exhibit tissue-specific and disease-specific expression suggests the possibility of an alternative class of biomarkers and therapeutic targets that are primate-specific.

Keywords: CLL; CRC; EMT; N-BLR; Non-coding RNA; Pyknons; Transcription; lncRNA; ncRNA.


Figures
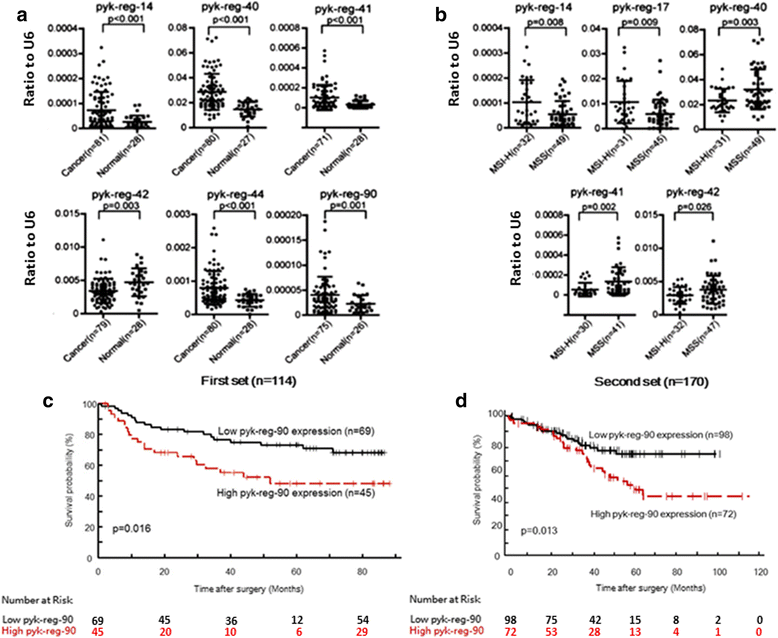
Fig. 1
Fig. 1
Pyknon loci expression in CRC samples by qRT-PCR. a Expression and distribution of pyknon-containing regions were analyzed between CRC and paired normal samples (first set, see Additional file 4: Table S3) by qRT-PCR. b Expression and distribution of pyknon-regions were analyzed between MSS and MSI-H CRC by qRT-PCR. The number of samples with measurable expression values (under Ct of 35) is presented in parentheses. The numbers of cancer and normal samples in some cases differ from one another because patients with no expression values for the U6 or for pyknon regions were excluded. Two-sided t-test was used to evaluate differences between two groups. Y-axis values represent ratio of each pyknon region to U6: ratios were calculated with the 2–ΔCt method using U6 levels for normalization. c, d Kaplan–Meier curves reveal a poor clinical prognosis for patients with high pyk-reg-90 expression in both cohorts (the first set had n = 114 and the second set n = 170 patients); the association was statistically significant with p = 0.016 and p = 0.013 for each set, respectively (log-rank test). The high/low pyk-reg-90 expression was determined according to a cutoff value corresponding to the mean value of all patients
Fig. 2
Fig. 2
Properties of N-BLR. a ISH of the tissue microarray (described in Additional file 3: Figure S5) shows differential expression of N-BLR in colon cancer (Adenocarcinoma) and normal colon (Normal tissue). Hematoxylin and eosin (H&E) staining of matched tissues was added to distinguish tissue morphology. Increasing magnifications were provide to evaluate the distribution of N-BLR in the nucleus and in the cytoplasm of cells (5X, 20X, and 60X). b Image analysis of ISH was conducted to measure the expression levels of N-BLR in the different tissues. Adenocarcinoma and metastatic colon cancer tissues expressed higher levels of N-BLR compared with normal colon tissue. There were not significant differences between normal tissue and benign/polyp and colitis tissues. c ISH data on cytoplasmic/nuclear localization of N-BLR. The full arrows point to cytoplasm and the dashed arrows to nucleus. Those two cellular compartments were identified using H&E staining. The H&E staining and ISH for N-BLR were done on serial sections; therefore, perfect overlapping of tissue morphology did not occur between the two images that show the same tissue area. d PARP-1 expression following transfection of Colo320 and SW620 cells with siRNAs (N-BLR siRNA1 + 3 pool) against N-BLR. Profiling was carried out at 96 and 120 h of siRNA transfection. e left Expression of survivin, c-IAP-1, XIAP after 96 h following transfection of Colo320 and SW620 cells with siRNAs (N-BLR siRNA1 + 3 pool) against N-BLR. right Quantification of survivin, c-IAP-1, XIAP in Colo320 cells. f Activity of Caspase 3/7, Caspase 8, and Caspase 9 following transfection of Colo320 and SW620 cells with siRNAs (N-BLR siRNA1 + 3 pool) against N-BLR. Profiling was carried out after 96 and 120 h (siR = N-BLR siRNA 1 + 3 pool; Ctr = scramble control siRNA; N = lipofectamine only; GAPDH was used as loading control). (Student’s t-test; *p < 0.05; **p < 0.01; ***p < 0.001; and ****p < 0.0001)
Fig. 3
Fig. 3
The effect of N-BLR knockdown on invasion by specific siRNAs. a N-BLR abundance is decreased in stably silenced clones. b Invasion assays at 36 h show significant reduction of stably silenced N-BLR invading cells. c Migration assay at 24 h identified also significant reduction in migration of stably silenced N-BLR clones. d The 12 most significantly differentially expressed genes for both upregulated and downregulated genes. The data originated from 44 K Agilent microarray where HCT116 stable shRNA N-BLR clones #3-1 and #4-7 were compared with HCT116 empty vector control clone. The probes recognizing E-cadherin and vimentin are in red and blue, respectively. e Confirmation of microarray data by real time PCR shows that E-cadherin is increased and vimentin is markedly decreased in stably silenced clones (#3-1 and #4-7). f E-cadherin, vimentin, and ZEB1 were identified in vitro by immunofluorescence with specific antibodies. Immunofluorescence signal of E-cadherin (green color) was markedly increased in both clones. The ZEB1 signal was present in cells with empty vector (green color) but not in clones #3-1 and #4-7. Blue color indicate nuclei. Single green, blue, and merged channel images of ZEB1 are reported in Additional file 3: Figure S9B. g ZEB1 mRNA downregulation in HCT116 stable shRNA N-BLR clones #3-1 and #4-7 compared with control HCT116 empty vector clone. h Western blotting for E-cadherin and ZEB1 measured in the same clones; vinculin was used as loading control. (Student’s t-test; *p < 0.05; **p < 0.01; ***p < 0.001; ****p < 0.0001)
Fig. 4
Fig. 4
Interaction between N-BLR and miR-200 family members. a The effect of transient transfection of N-BLR siRNA3 and siRNA4 on the miR-200 family in Colo320 cells. MiR-141-3p and miR-200c-3p were increased in both N-BLR siRNAs transfected cells compared with scramble control. b A luciferase vector including the full N-BLR sequence (pGL3-N-BLR) as well as vectors that were mutated separately at the interaction sites of either miR-141-3p or miR-200c-3p [pGL3-N-BLR(M)] were constructed. Luciferase activity is decreased only when miR-141-3p and miR-200c-3p are co-transfected with the WT construct but not when a mutated vector is used. c Most representative images from ISH of tissue microarray showed lower levels of both miR-141-3p and miR-200c-3p in adenocarcinoma tissue compared with normal tissue, whereas an inverse pattern was found for N-BLR levels. d Image analysis were performed to evaluate the association between the levels of miR-141-3p and miR-200c-3p and those of N-BLR. The quantification was performed in a pair-matched fashion, so that the levels of the three targets were quantified on the same tissue spot of the microarray. e N-BLR and E-cadherin expression in tumor and normal samples: N-BLR was increased and E-cadherin was decreased in CRC when compared to normal colon. f The same is true when CRC with lymph node invasion (LN+) were compared with cases without lymph node involvement (LN–). Asterisks mark cases with statistically significant difference compared with scrambled. (Student’s t-test; *p < 0.05; **p < 0.01; ***p < 0.001; ****p < 0.0001)
Fig. 5
Fig. 5
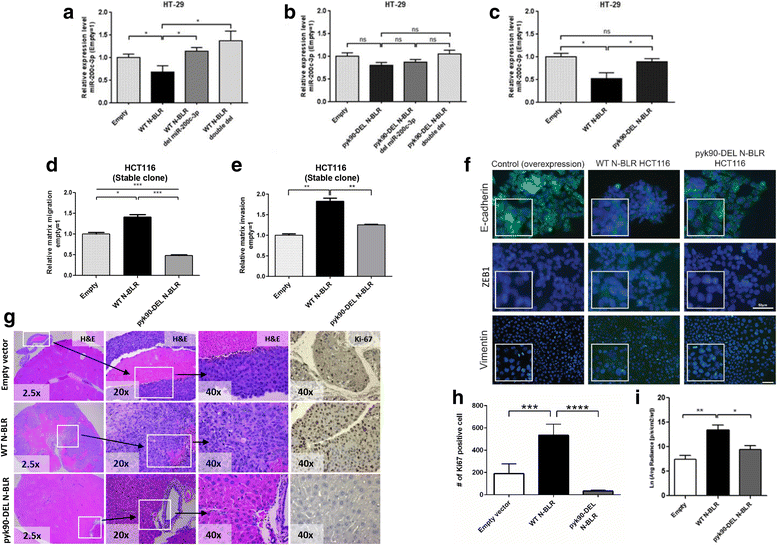
The 20-nt pyknon motif influences the functional role of N-BLR. a. miR-200c-3p levels following 48 h of co-transfection with empty pcDNA 3.1 vector, WT N-BLR vector, WT N-BLR del miR-200c-3p, WT N-BLR double del for both miR-200c-3p and miR-141-3p binding sites in HT-29 cell lines. The levels of miR-200c-3p were significantly reduced by the overexpression of the WT N-BLR compared to the empty vector, whereas they were restored by the overexpression of the mutant vector. b miR-200c-3p expression levels following 48 h of co-transfection with empty pcDNA 3.1 vector, pyk90-DEL N-BLR vector, pyk90-DEL N-BLR del miR-200c-3p, pyk90-DEL N-BLR double del for both miR-200c-3p and miR-141-3p binding sites. The lack of the pyk90 motif within N-BLR is likely to critically impair the binding between N-BLR and miR-200c-3p, thus the levels of the miRNA do not decrease significantly compared to the empty vector. c Comparison of miR-200c-3p expression levels between WT N-BLR and pyk90-DEL N-BLR cells: the binding of miR-200c-3p to N-BLR is partly dependent on the presence of the pyk90 motif. Y-axis values represent the ratio of miR-200c-3p and miR-141-3p to U6. Ratios were calculated with the 2–ΔCt method using U6 levels for normalization. For each set of co-transfection experiments, the expression levels of miR-200c-3p were corrected by subtracting the values derived from the corresponding miRNA mimic negative control. Data are shown as mean ± SEM: n = 4. d Migration assays at 24 h show a significant increase of migrating cells with stable overexpression of WT N-BLR. Conversely, stable overexpression of pyk90-DEL N-BLR leads to a dramatic decrease of migratory capabilities even compared to the empty vector stable clone. e Similarly to migration, invasion assays at 36 h identified a significant increase of the invading population among the stable WT BLR overexpressing cells compared with the empty vector stable clone. While overexpression of pyk90-DEL N-BLR did not produce such gain of function, although not significant, it still conferred an edge of invasion over the empty clones. Data are shown as mean ± SEM: n = 3. f E-cadherin, ZEB1, and vimentin detection by immunofluorescence in HCT116 N-BLR overexpressing clones. The signal of E-cadherin (green color) was markedly decreased in WT N-BLR clone. The ZEB1 signal was absent in cells with empty vector (green color) but visible in WT N-BLR overexpressing clone. Blue color indicates nuclei. Single green, blue, and merged channel images of ZEB1 are reported in Additional file 3: Figure S9C. g Representative H&E images and immunohistochemical staining of Ki67 in liver metastases from nude mice after approximately four to six weeks of intrasplenic injection with empty vector, WT N-BLR, and pyk90-DEL N-BLR overexpressing HCT116 clones are shown. h Quantification of Ki-67 staining is reported. i WT N-BLR enhances liver metastases in the injected mice. Weekly imaging was performed using the Xenogen IVIS spectrum system within 12 min following injection of D-Luciferin (150 mg/mL). Living image 4.1 software was used to determine the regions of interest (ROI), and average photon radiance (p/s/cm2/sr) was measured for each mouse. Data were log-transformed before analysis. Data are shown as mean ± SEM: EMPTY n = 4, WT N-BLR n = 5, pyk90-DEL N-BLR n = 7. (Student’s t-test; *p < 0.05; **p < 0.01; ***p < 0.001; ****p < 0.0001)
Fig. 6
Fig. 6
Pyknon expression across tissues and tissue states. ae Pyknon clusters showing tissue and disease specificity among normal (a, b) or diseased (ce) tissue samples. a, c Heatmaps of standardized pyknon expression profiles. Dendrograms were constructed with Hierarchical Clustering using Pearson correlation as a metric. b, d Principal component analysis (PCA) of the normal (b) or the diseased (d) samples. The X-axis corresponds to the first principal component (PC1) and the Y-axis to the second principal component (PC2). The numbers next to the PC labels represent the amount of information from the original dataset that is projected on each one. e Partial Least Squares-Discriminant Analysis showing the perfect separation of the samples with normal (CLL-NFZ) or aberrant (CLL-AFZ) FISH profile of chromosome arm 17p and ZAP-70 levels. CRC-MSS colorectal cancer sample without microsatellite instability, CRC-MSI colorectal cancer sample with microsatellite instability, Lympho B-lymphocytes, NBreast normal breast tissue, NColon normal colon tissue, NHeart normal heart tissue, NLiver normal liver tissue, NLung normal lung tissue, NSMuscle normal skeletal muscle tissue, NTesticle normal testicle, PBMC mononuclear cells. f The COX OS analyses of the pyknon expression using the genome-wide array identified a set of six transcribed pyknons that are associated at a p < 0.01 with OS in CRC. All these six probes were chosen for the analyses because they correspond to an unambiguous genomic location. The blue bars correspond to a negative HR, meaning an association with good prognosis, while the red bar correspond to a positive HR, meaning an association with poor prognosis. g Expression of probed pyknons in comparison with human miRNAs. Pyknon transcription levels are higher than those of miRNAs—probability density values of normalized intensities for the miRNA and pyknon probes across all 165 CRC arrays used for the data from Fig. 6f

References

    1. Carninci P, Kasukawa T, Katayama S, Gough J, Frith MC, Maeda N, et al. The transcriptional landscape of the mammalian genome. Science. 2005;309:1559–63. doi: 10.1126/science.1112014. - DOI - PubMed
    1. Cheng J, Kapranov P, Drenkow J, Dike S, Brubaker S, Patel S, et al. Transcriptional maps of 10 human chromosomes at 5-nucleotide resolution. Science. 2005;308:1149–54. doi: 10.1126/science.1108625. - DOI - PubMed
    1. Shigematsu M, Honda S, Kirino Y. Transfer RNA as a source of small functional RNA. J Mol Biol Mol Imaging. 2014;1:8. - PMC - PubMed
    1. Honda S, Loher P, Shigematsu M, Palazzo JP, Suzuki R, Imoto I, et al. Sex hormone-dependent tRNA halves enhance cell proliferation in breast and prostate cancers. Proc Natl Acad Sci U S A. 2015;112:E3816–25. doi: 10.1073/pnas.1510077112. - DOI - PMC - PubMed
    1. Telonis AG, Loher P, Honda S, Jing Y, Palazzo J, Kirino Y, et al. Dissecting tRNA-derived fragment complexities using personalized transcriptomes reveals novel fragment classes and unexpected dependencies. Oncotarget. 2015;6:24797–822. doi: 10.18632/oncotarget.4695. - DOI - PMC - PubMed

Publication types

MeSH terms