. 2017 May 23;19(1):59.
doi: 10.1186/s13058-017-0845-2.

Rapid evaporative ionisation mass spectrometry of electrosurgical vapours for the identification of breast pathology: towards an intelligent knife for breast cancer surgery

Affiliations

Rapid evaporative ionisation mass spectrometry of electrosurgical vapours for the identification of breast pathology: towards an intelligent knife for breast cancer surgery

Edward R St John et al. Breast Cancer Res. .

Abstract

Background: Re-operation for positive resection margins following breast-conserving surgery occurs frequently (average = 20-25%), is cost-inefficient, and leads to physical and psychological morbidity. Current margin assessment techniques are slow and labour intensive. Rapid evaporative ionisation mass spectrometry (REIMS) rapidly identifies dissected tissues by determination of tissue structural lipid profiles through on-line chemical analysis of electrosurgical aerosol toward real-time margin assessment.

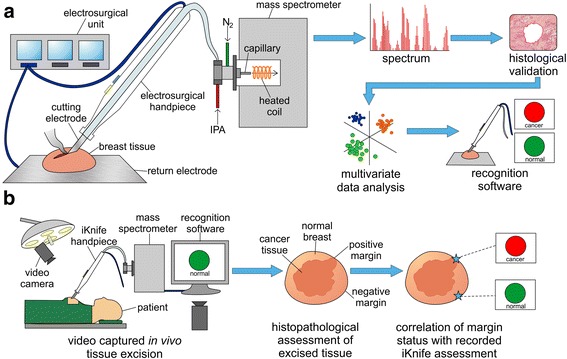
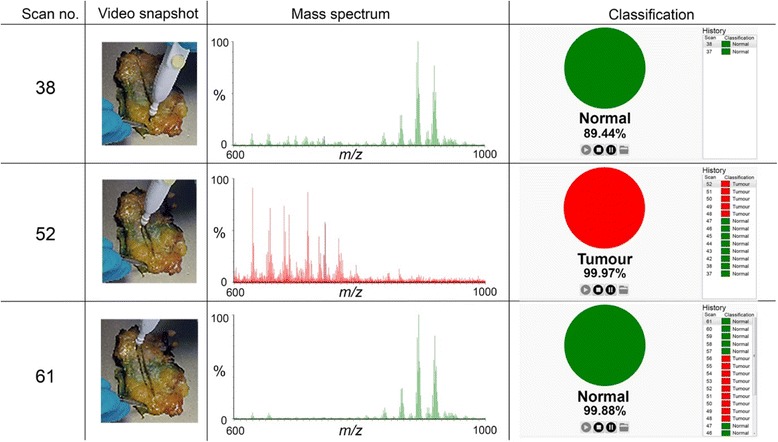
Methods: Electrosurgical aerosol produced from ex-vivo and in-vivo breast samples was aspirated into a mass spectrometer (MS) using a monopolar hand-piece. Tissue identification results obtained by multivariate statistical analysis of MS data were validated by histopathology. Ex-vivo classification models were constructed from a mass spectral database of normal and tumour breast samples. Univariate and tandem MS analysis of significant peaks was conducted to identify biochemical differences between normal and cancerous tissues. An ex-vivo classification model was used in combination with bespoke recognition software, as an intelligent knife (iKnife), to predict the diagnosis for an ex-vivo validation set. Intraoperative REIMS data were acquired during breast surgery and time-synchronized to operative videos.

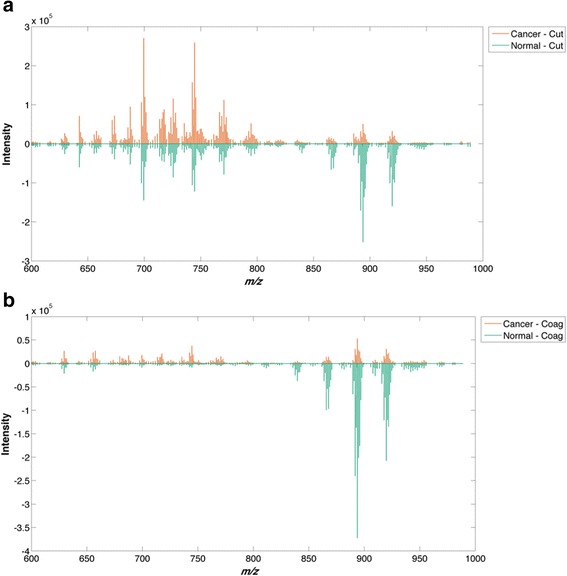
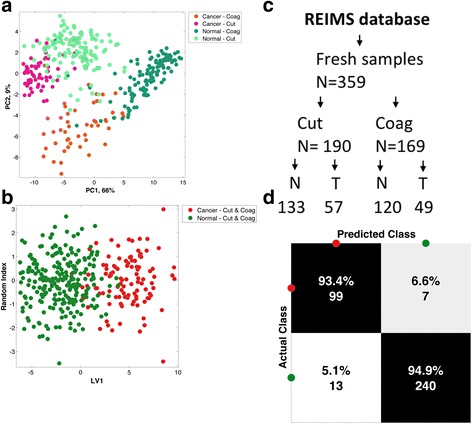
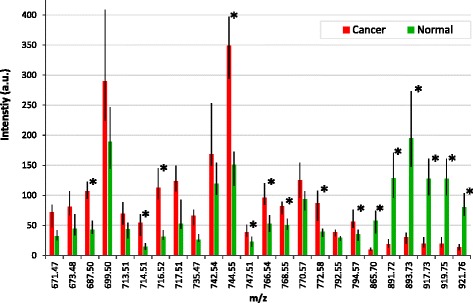
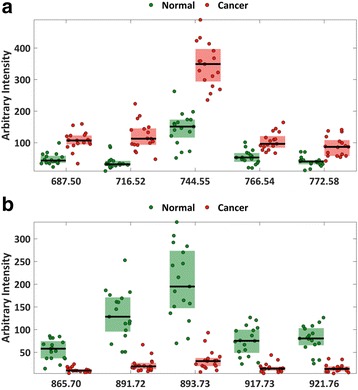
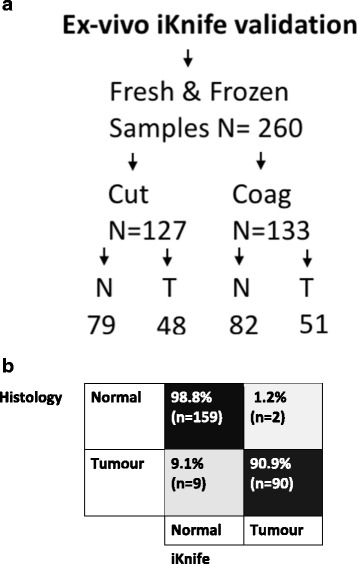
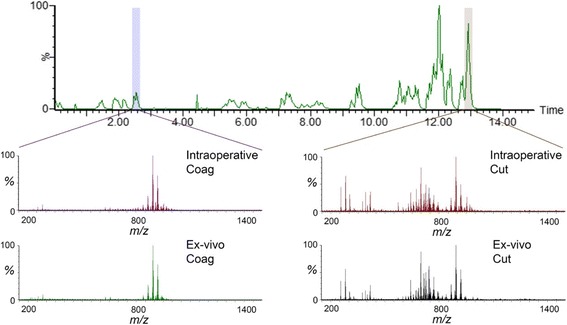
Results: A classification model using histologically validated spectral data acquired from 932 sampling points in normal tissue and 226 in tumour tissue provided 93.4% sensitivity and 94.9% specificity. Tandem MS identified 63 phospholipids and 6 triglyceride species responsible for 24 spectral differences between tissue types. iKnife recognition accuracy with 260 newly acquired fresh and frozen breast tissue specimens (normal n = 161, tumour n = 99) provided sensitivity of 90.9% and specificity of 98.8%. The ex-vivo and intra-operative method produced visually comparable high intensity spectra. iKnife interpretation of intra-operative electrosurgical vapours, including data acquisition and analysis was possible within a mean of 1.80 seconds (SD ±0.40).

Conclusions: The REIMS method has been optimised for real-time iKnife analysis of heterogeneous breast tissues based on subtle changes in lipid metabolism, and the results suggest spectral analysis is both accurate and rapid. Proof-of-concept data demonstrate the iKnife method is capable of online intraoperative data collection and analysis. Further validation studies are required to determine the accuracy of intra-operative REIMS for oncological margin assessment.

Keywords: Breast; Cancer; Intelligent knife; Intraoperative margin assessment; Margins; Mass spectrometry; REIMS; Rapid evaporative ionisation mass spectrometry; Surgery; iKnife.


Figures

Fig. 1
Fig. 1
Ex-vivo and intraoperative workflows. a Ex-vivo workflow from generation of spectra by mass spectrometry (MS) analysis of surgical aerosol through to model building by multivariate statistics leading to ex-vivo recognition of tissue in real time. b Intraoperative workflow from generation of spectra in real time by on-line MS analysis, through to determination of margin status by histopathological assessment and correlation to iKnife results
Fig. 2
Fig. 2
Mean spectral intensity for cancer and normal tissues during cutting (cut) and coagulation (coag) electrosurgical modalities. The m/z intensities are positive for both normal and tumour; here positive intensities are reflected opposite each other to illustrate similarities and differences between the groups. The intensity of triglycerides (850–1000 m/z) is greater than the intensity of phospholipids (600–850 m/z) in normal breast tissue (a, b), whilst the membrane phospholipids are more dominant in breast cancer (a, b). Differences are observed between cut mode (a) and coag mode (b). Coag mode, compared to cut mode, gives a higher triglyceride signal but lower phospholipid signal
Fig. 3
Fig. 3
Multivariate statistical analysis of the combined cut and coag model. a Unsupervised principal component (PC) analysis of the spectral differences (600–1000 m/z) between normal tissue compared to breast cancer in the cut and coag electrosurgical modalities. b Supervised linear discriminant analysis plot comparing normal tissue (N) to tumour/cancer (T) regardless of electrosurgical modality. c Flow diagram of sample selection for building of the rapid evaporative ionisation mass spectrometry (REIMS) database. d Confusion matrix demonstrating diagnostic accuracy of the combined electrosurgical model following leave-one-patient-out cross-validation (LV1), with sensitivity (93.4%) and specificity (94.9%)
Fig. 4
Fig. 4
Graph shows statistically significant differences (p < 0.05) in the mean intensity of the m/z peaks in normal tissue and in cancer (*=q value (false discovery rate (FDR)-corrected p value) ≤0.001). Range bars represent the interquartile range. There were 18 peaks that increased in cancer within the phospholipid range (600–850 m/z); 6 peaks increased in normal tissue within the triglyceride range (850–1000 m/z). a.u. arbitrary units
Fig. 5
Fig. 5
Intensities of five significant features that had higher intensities in cancer samples (a) and five significant features that had higher intensities in normal samples (b). The features are the most significant ones identified by univariate analysis (see Fig. 4 and Additional file 5: Table S3). The bottom and top of the coloured band represent, respectively, the 25th and 75th percentiles of the group, with the median denoted by the black line. The individual intensities for each group have been scattered with a random amount of x-axis positional variation
Fig. 6
Fig. 6
Ex-vivo validation of recognition software with new samples. a Flow diagram of samples used in the ex-vivo validation experiment. N normal tissue, T tumour tissue. b Confusion matrix demonstrating diagnostic accuracy of the combined electrosurgical model with a validation set of new fresh and frozen tissues. On analysis of diagnostic accuracy, sensitivity was 90.9% and specificity 98.8%
Fig. 7
Fig. 7
Ex-vivo validation case study. An electrosurgical hand-piece was moved through the mastectomy specimen in coag mode from normal breast tissue, into tumour and out through normal tissue. A simultaneous video recording reveals the position of the hand-piece in relation to the specimen and the generated spectra and demonstrates good correlation with the recognition software compared to macroscopic findings
Fig. 8
Fig. 8
Collection of intraoperative mass spectral data with comparison to ex-vivo spectra. Spectral intensity over time obtained throughout entire surgery (14 minutes), one spectra obtained per second. Intraoperative spectral differences highlighted in cut (right) and coag (left) modalities observed in normal tissue and compared to similar spectra observed in two ex-vivo examples

Similar articles

Cited by

References

    1. Stewart BW, Wild C. World Cancer Report 2014. International Agency for Research on Cancer; 2014. http://publications.iarc.fr/Non-Series-Publications/World-Cancer-Reports....
    1. DeSantis CE, Lin CC, Mariotto AB, Siegel RL, Stein KD, Kramer JL, Alteri R, Robbins AS, Jemal A. Cancer treatment and survivorship statistics, 2014. CA Cancer J Clin. 2014;64(4):252–71. doi: 10.3322/caac.21235. - DOI - PubMed
    1. Jeevan R, Cromwell DA, Trivella M, Lawrence G, Kearins O, Pereira J, Sheppard C, Caddy CM, van der Meulen JHP. Reoperation rates after breast conserving surgery for breast cancer among women in England: retrospective study of hospital episode statistics. BMJ. 2012;345:e4505. http://www.bmj.com/content/345/bmj.e4505. - PMC - PubMed
    1. Isaacs AJ, Gemignani ML, Pusic A, Sedrakyan A. Association of breast conservation surgery for cancer with 90-day reoperation rates in New York State. JAMA Surg. 2016;151(7):648–55. doi: 10.1001/jamasurg.2015.5535. - DOI - PubMed
    1. Wilke LG, Czechura T, Wang C, Lapin B, Liederbach E, Winchester DP, Yao K. Repeat surgery after breast conservation for the treatment of stage 0 to II breast carcinoma: a report from the National Cancer Data Base, 2004-2010. JAMA Surg. 2014;149(12):1296–305. doi: 10.1001/jamasurg.2014.926. - DOI - PubMed

Publication types