. 2017 Jul;27(7):1139-1152.
doi: 10.1101/gr.215160.116. Epub 2017 May 23.

YY1 and CTCF orchestrate a 3D chromatin looping switch during early neural lineage commitment

Affiliations

YY1 and CTCF orchestrate a 3D chromatin looping switch during early neural lineage commitment

Jonathan A Beagan et al. Genome Res. 2017 Jul.

Abstract

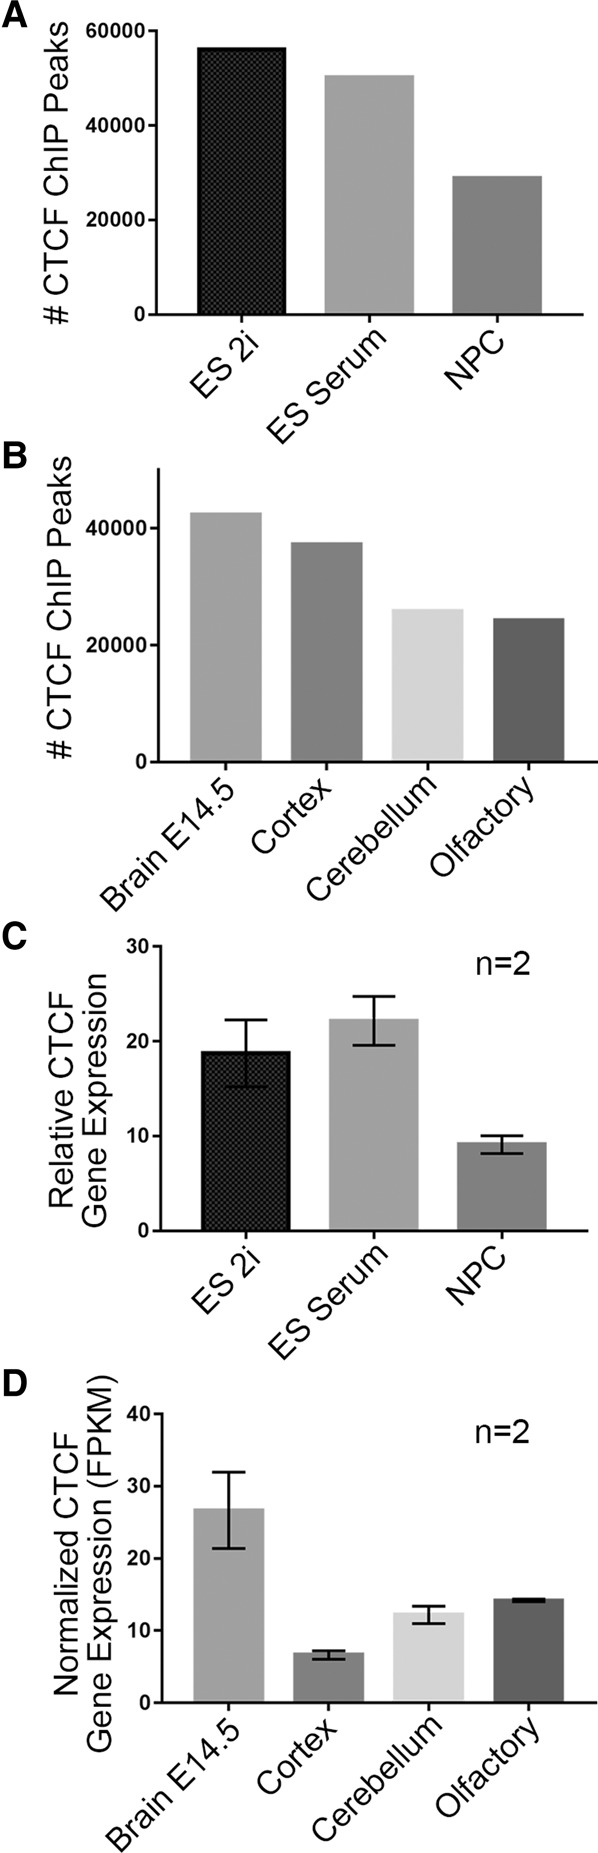
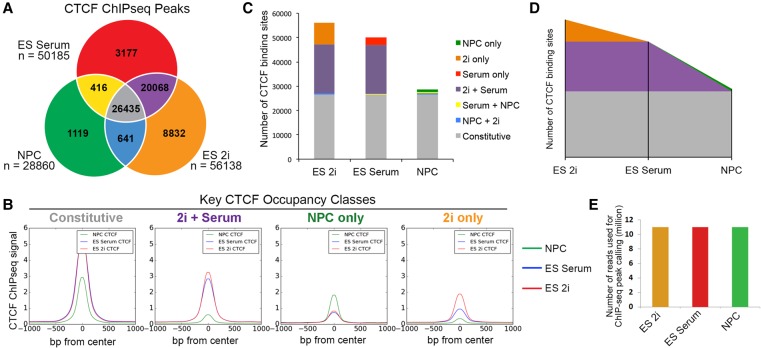
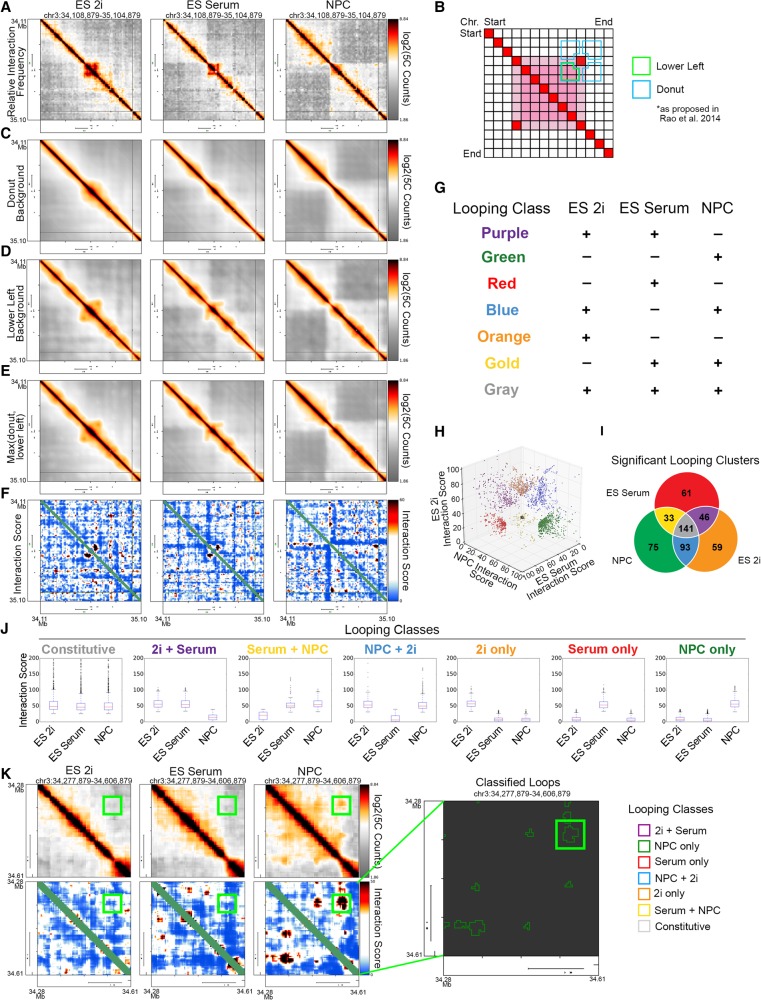
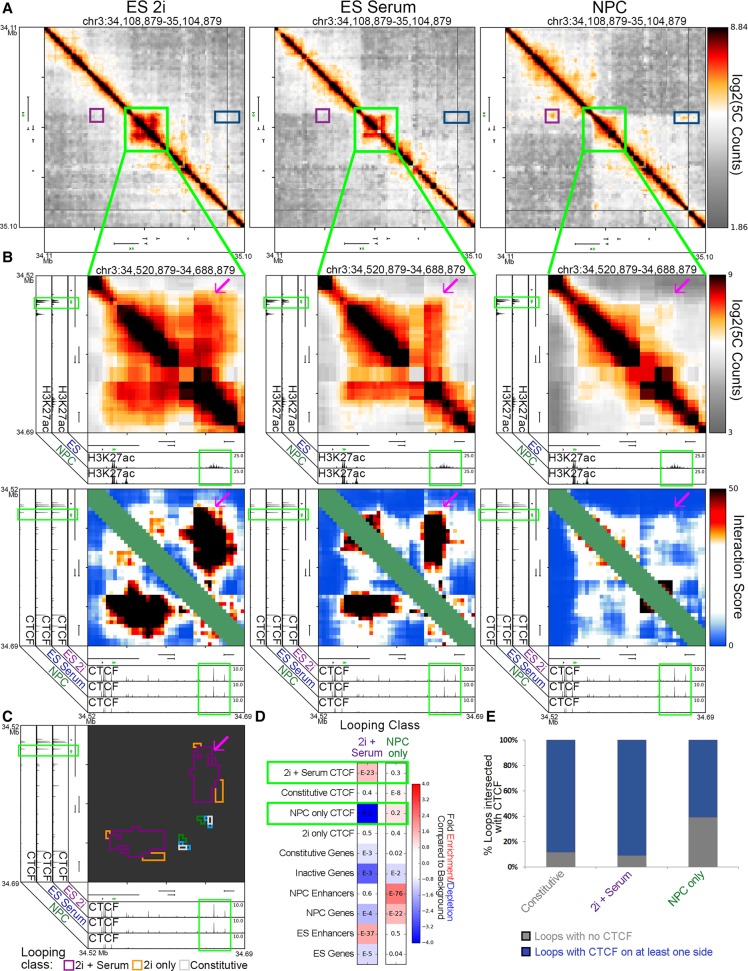
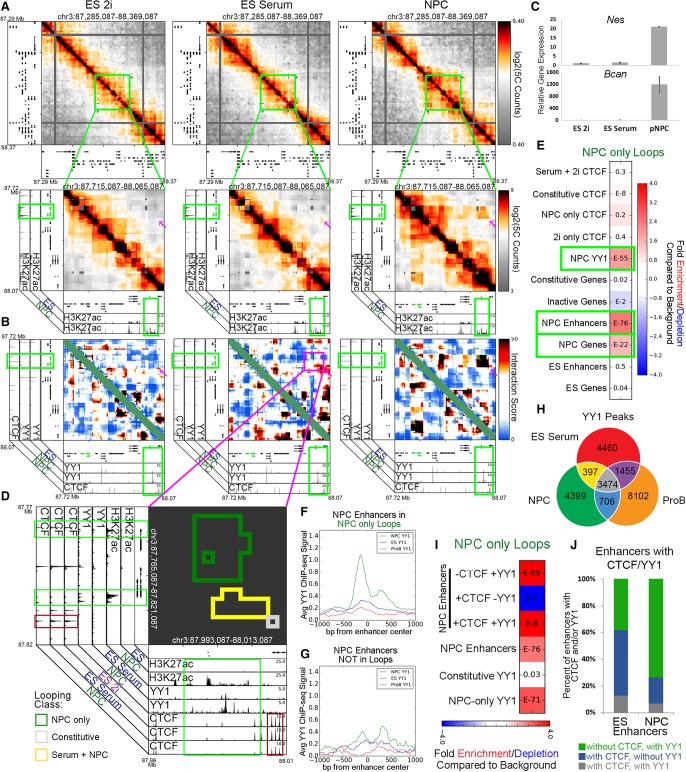
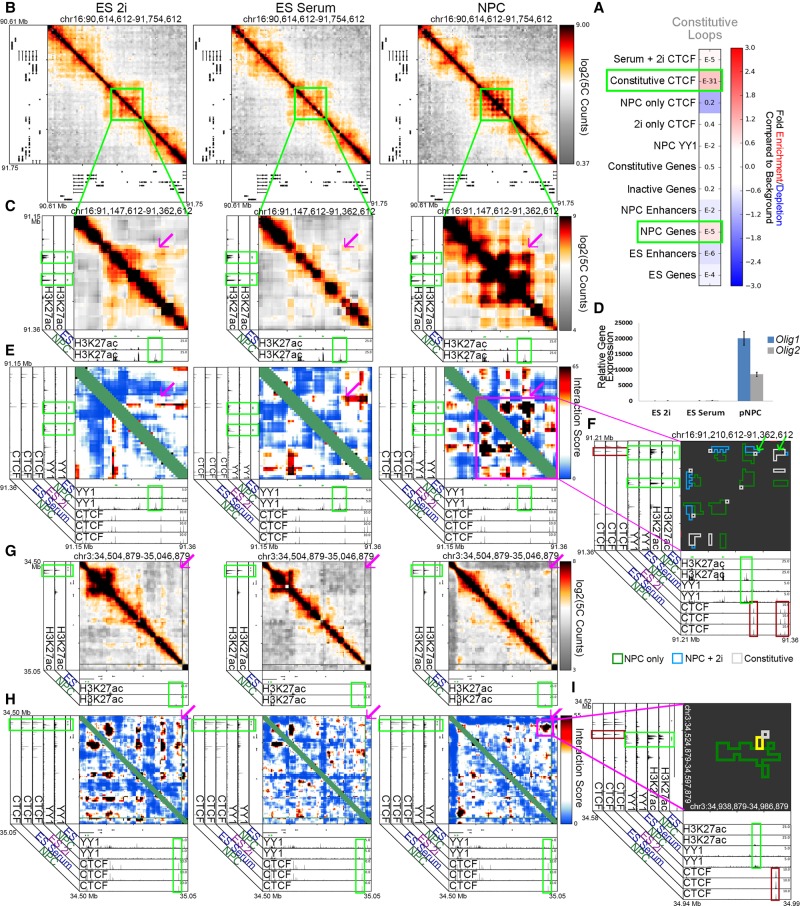
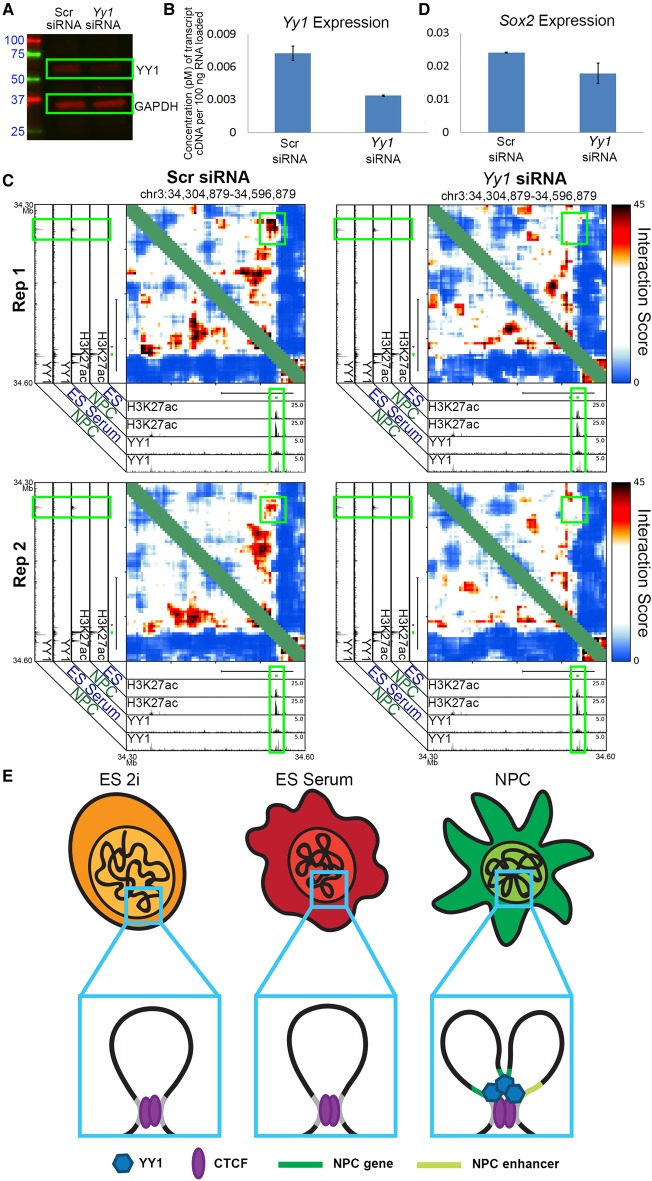
CTCF is an architectural protein with a critical role in connecting higher-order chromatin folding in pluripotent stem cells. Recent reports have suggested that CTCF binding is more dynamic during development than previously appreciated. Here, we set out to understand the extent to which shifts in genome-wide CTCF occupancy contribute to the 3D reconfiguration of fine-scale chromatin folding during early neural lineage commitment. Unexpectedly, we observe a sharp decrease in CTCF occupancy during the transition from naïve/primed pluripotency to multipotent primary neural progenitor cells (NPCs). Many pluripotency gene-enhancer interactions are anchored by CTCF, and its occupancy is lost in parallel with loop decommissioning during differentiation. Conversely, CTCF binding sites in NPCs are largely preexisting in pluripotent stem cells. Only a small number of CTCF sites arise de novo in NPCs. We identify another zinc finger protein, Yin Yang 1 (YY1), at the base of looping interactions between NPC-specific genes and enhancers. Putative NPC-specific enhancers exhibit strong YY1 signal when engaged in 3D contacts and negligible YY1 signal when not in loops. Moreover, siRNA knockdown of Yy1 specifically disrupts interactions between key NPC enhancers and their target genes. YY1-mediated interactions between NPC regulatory elements are often nested within constitutive loops anchored by CTCF. Together, our results support a model in which YY1 acts as an architectural protein to connect developmentally regulated looping interactions; the location of YY1-mediated interactions may be demarcated in development by a preexisting topological framework created by constitutive CTCF-mediated interactions.


Figures

Figure 1.
Figure 1.
CTCF binding and expression decrease during neural development. (A) Number of CTCF ChIP-seq peaks called across the ES 2i, ES serum, and NPC cellular states. (B) Number of CTCF ChIP-seq peaks across several mouse ENCODE brain tissues (Shen et al. 2012). (C) Relative CTCF gene expression across three developmental cell types (error bars represent 1 SD from mean across two replicates). (D) Normalized CTCF gene expression (FPKM) across mouse ENCODE brain tissues (error bars represent 1 SD from mean across two replicates) (Shen et al. 2012).
Figure 2.
Figure 2.
Sites bound by CTCF in NPCs are predominantly preexisting from earlier stages of development. (A) Classification of CTCF binding sites parsed between three developmental cell states. (B) Composite CTCF ChIP-seq signal in NPCs (green), ES serum (blue), and ES 2i (red) centered around the peaks of Constitutive, 2i+Serum, NPC-only, and 2i only CTCF classes. (C) Stacked bar plot representing the distribution of CTCF binding classes across ES cells in 2i, ES cells in serum, and NPCs. (D) Theorized landscape plot depiction of constitutive and dynamic CTCF during the early time points of development. Colors represent same CTCF classes as presented in C. (E) Library read depth is comparable across conditions. After redundant read removal and down-sampling, 11 million reads were utilized for the CTCF ChIP-seq analysis of each cell type.
Figure 3.
Figure 3.
Dynamic classes of 3D interactions arise during neural lineage commitment. (A) Heatmaps displaying the relative chromatin contact frequency in a 1-Mb region surrounding the Sox2 gene in ES 2i, ES serum, and NPCs. Color bars range from low (gray) to high (red/black). (B) Schematic depiction of donut (blue) and lower left (green) expected background models. (CE) Expected background heatmaps for the region surrounding the Sox2 gene. (C) Donut filter, (D) lower left filter, and (E) maximum value of donut and lower left filters. (F) Interaction score heatmaps at the Sox2 locus. Color bar ranges from low (blue) to high (red/black). (G) Schematic of looping classes parsed by their dynamic behavior across three cellular states. (H) Scatter plot of 5C interaction scores for each pixel classified as part of a looping interaction across the ES 2i, ES serum, and NPC states (Supplemental Methods). (I) Number of significant looping clusters in each dynamic 3D interaction class. (J) Box plots representing interaction scores across each cell type for the pixels classified into each looping class. (K) Visualization of a Sox2-pluripotency enhancer interaction in relative interaction frequency heatmaps (top left), interaction score heatmaps (bottom left), and classified loop clusters (right).
Figure 4.
Figure 4.
Pluripotency interactions that disengage in multipotent NPCs display reduced CTCF occupancy. (A) Global view of relative interaction frequency heatmaps of 1 Mb surrounding the Sox2 gene. (B) Zoom in highlighting a strong pluripotency-specific looping interaction between Sox2 and an ES-specific enhancer. CTCF binds at both loop anchors (note green boxes). Heatmaps include relative interaction frequency (top) and background corrected interaction score (bottom). The Sox2 gene is colored green. (C) Classified interaction clusters are plotted above relevant ChIP-seq tracks. (D) Fold enrichment/depletion of chromatin features in 2i+serum and NPC-only looping interaction classes compared to presence in background interactions. P-values included in each entry are calculated using Fisher's exact test. (E) Stacked bar plot contrasting the proportion of loops connected by CTCF in one or both anchoring fragments versus not anchored by CTCF.
Figure 5.
Figure 5.
YY1 is enriched at NPC-specific enhancers that form developmentally regulated loops. (A) Relative interaction frequency heatmaps of the global view of 1 Mb surrounding Nes (top), and zoom in of 400 kb surrounding nestin with putative NPC enhancer annotations (bottom). Nes (upstream) and Bcan (downstream) genes are colored green. (B) Zoom-in interaction score heatmaps of the Nes/Bcan genes interacting with a downstream putative NPC enhancer. Heatmaps are overlaid with ChIP-seq tracks of CTCF in NPCs and YY1 in ES serum and NPCs. The Nes (upstream) and Bcan (downstream) genes are colored green. (C) Relative gene expression of Nes and Bcan across ES 2i, ES serum, and NPC cellular states. (D) Interaction cluster outlines of the loop boxed in magenta in B. Plot is overlaid with ChIP-seq tracks of H3K27ac, YY1, and CTCF in the ES 2i, ES serum, and NPC conditions. Cluster outline classifications include NPC-only (green), serum+NPC (yellow), and constitutive (gray). (E) Fold enrichment/depletion of the presence of chromatin features in NPC-only interaction class compared to the presence in background. P-values are computed with Fisher's exact test and listed in each entry. (F,G) YY1 ChIP-seq signal in NPCs (green), ES serum (blue), and ProB cells (red), centered at (F) putative NPC enhancers at the base of NPC-only loops, and (G) NPC enhancers that do not fall at the base of any looping interactions. (H) YY1 binding sites parsed by their occupancy across ES cells, NPCs, and ProB cells. (I) Fold enrichment/depletion of YY1 peak classes and NPC enhancers parsed based on the presence/absence of CTCF/YY1 in NPC-only loops compared to their presence in background interactions. (J) Stacked bar plot of the breakdown of ES and NPC enhancers that are bound with confidence by a combination of CTCF and/or YY1.
Figure 6.
Figure 6.
YY1 connects neural regulatory elements nested within and adjacent to a framework of constitutive CTCF-mediated interactions. (A) Fold enrichment/depletion of chromatin regulatory elements in the constitutive looping class compared to background interactions. P-values are computed with Fisher's exact test and listed in each entry. (B,C) Relative interaction frequency heatmaps of ∼1 Mb region (B) and ∼200 kb region (C) surrounding the Olig1 and Olig2 genes in ES 2i, ES serum, and NPCs. Heatmaps in C are overlaid with ChIP-seq tracks of H3K27ac in ES serum cells and NPCs. (D) Relative gene expression of Olig1 and Olig2 genes across the ES 2i, ES serum, and NPC cellular states. (E) Zoom-in interaction score heatmaps of looping interactions between the Olig1 and Olig2 genes and surrounding putative NPC enhancers (green boxes). (F) Zoom-in cluster map of classified looping interactions at Olig2 and Olig1 with NPC only (green), serum+NPC (blue), and constitutive class looping interactions (gray). (GI) Heatmaps and cluster map at different length scales around the Sox2 gene in ES 2i, ES serum, and NPCs. Zoom-in heatmaps of relative interaction frequencies (G) and background corrected interaction scores (H) across ∼500 kb downstream from Sox2. Relative interaction frequency heatmaps are overlaid H3K27ac tracks. Interaction score heatmaps are overlaid with ChIP-seq tracks of YY1 and CTCF across cell types. The Sox2 gene is colored green. (I) Zoom-in classified cluster map of a ∼100-kb window around a Sox2-enhancer interaction with NPC only (green), serum+NPC (yellow), and constitutive classified looping interactions (gray), overlaid on ChIP-seq tracks.
Figure 7.
Figure 7.
YY1-mediated developmentally regulated looping interactions form within a constitutive framework demarcated by CTCF. (A) Western blot analysis querying YY1 and GAPDH protein levels in NPCs exposed to nontargeting control and Yy1-targeting siRNA. (B) Gene-expression quantified by qPCR of the Yy1 gene in NPCs exposed to control and Yy1-targeting siRNA. (C) Zoom-in interaction score heatmaps of a loop between the Sox2 gene and an upstream enhancer (originally presented in Fig. 3K) in NPCs exposed to nontargeting control siRNA (left) and an siRNA targeting Yy1 (right). (D) Gene-expression quantified by qPCR of the Sox2 gene in NPCs exposed to control and Yy1-targeting siRNA. (E) Schematic depicting a CTCF-mediated constitutive interaction, present across all early stages of neural lineage commitment, and a YY1-mediated gene-enhancer interaction, present only in NPCs.

References

    1. Alipour E, Marko JF. 2012. Self-organization of domain structures by DNA-loop-extruding enzymes. Nucleic Acids Res 40: 11202–11212. - PMC - PubMed
    1. Beagan JA, Gilgenast TG, Kim J, Plona Z, Norton HK, Hu G, Hsu SC, Shields EJ, Lyu X, Apostolou E, et al. 2016. Local genome topology can exhibit an incompletely rewired 3D-folding state during somatic cell reprogramming. Cell Stem Cell 18: 611–624. - PMC - PubMed
    1. Blinka S, Reimer MH Jr, Pulakanti K, Rao S. 2016. Super-enhancers at the Nanog locus differentially regulate neighboring pluripotency-associated genes. Cell Rep 17: 19–28. - PMC - PubMed
    1. Chen X, Xu H, Yuan P, Fang F, Huss M, Vega VB, Wong E, Orlov YL, Zhang W, Jiang J, et al. 2008. Integration of external signaling pathways with the core transcriptional network in embryonic stem cells. Cell 133: 1106–1117. - PubMed
    1. Cuddapah S, Jothi R, Schones DE, Roh TY, Cui K, Zhao K. 2009. Global analysis of the insulator binding protein CTCF in chromatin barrier regions reveals demarcation of active and repressive domains. Genome Res 19: 24–32. - PMC - PubMed

Publication types

MeSH terms