. 2017 Jul 21;292(29):12192-12207.
doi: 10.1074/jbc.M117.784702. Epub 2017 May 23.

Axodendritic sorting and pathological missorting of Tau are isoform-specific and determined by axon initial segment architecture

Affiliations

Axodendritic sorting and pathological missorting of Tau are isoform-specific and determined by axon initial segment architecture

Hans Zempel et al. J Biol Chem. .

Abstract

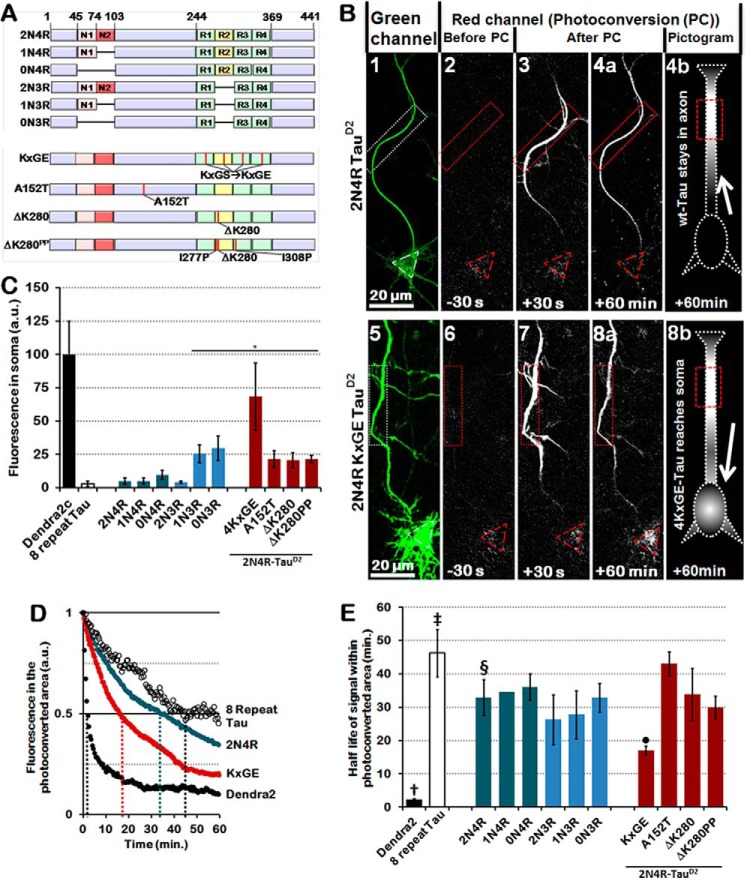
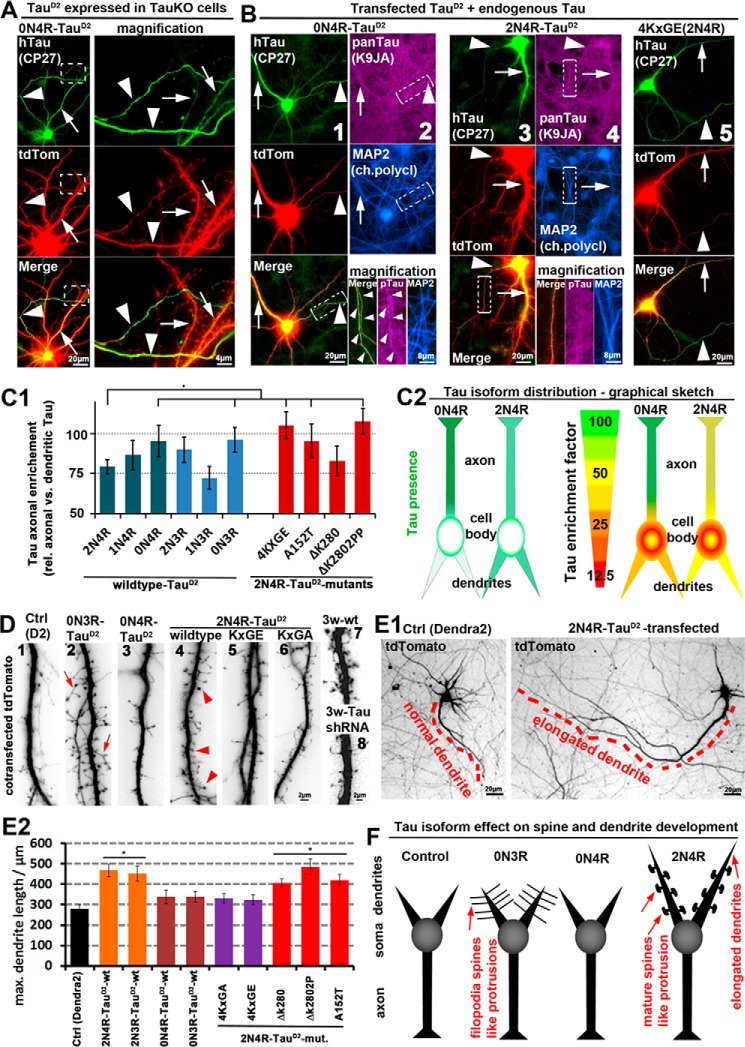
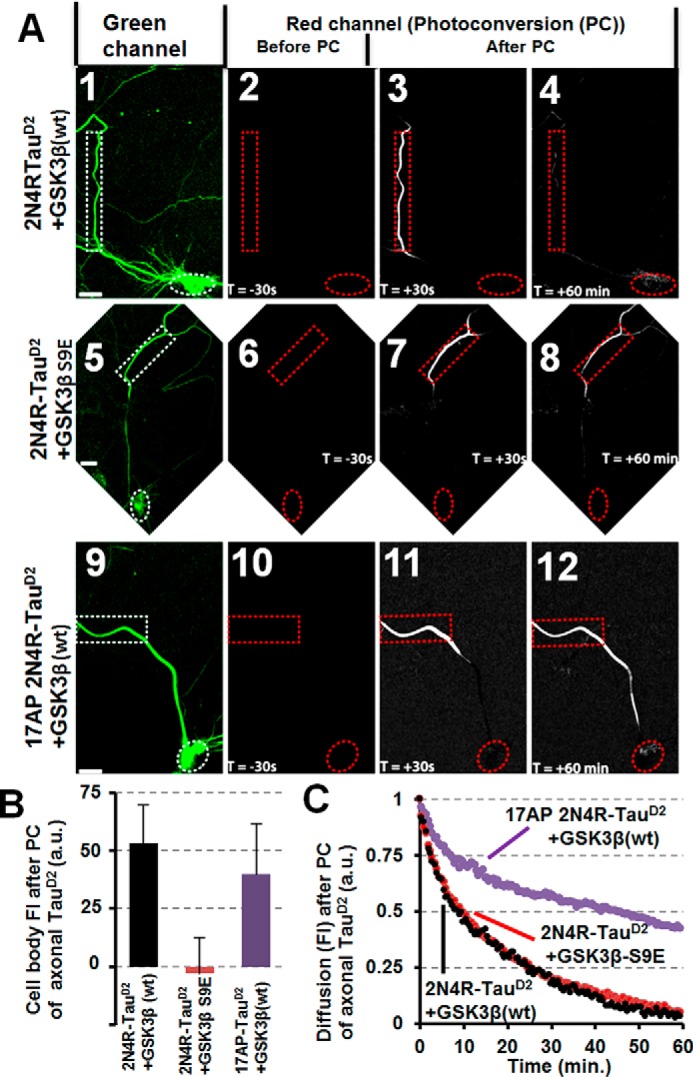
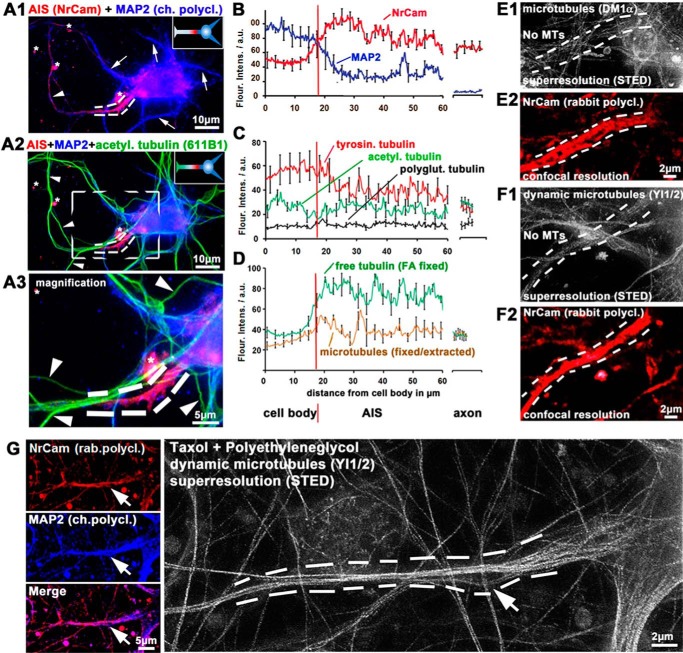
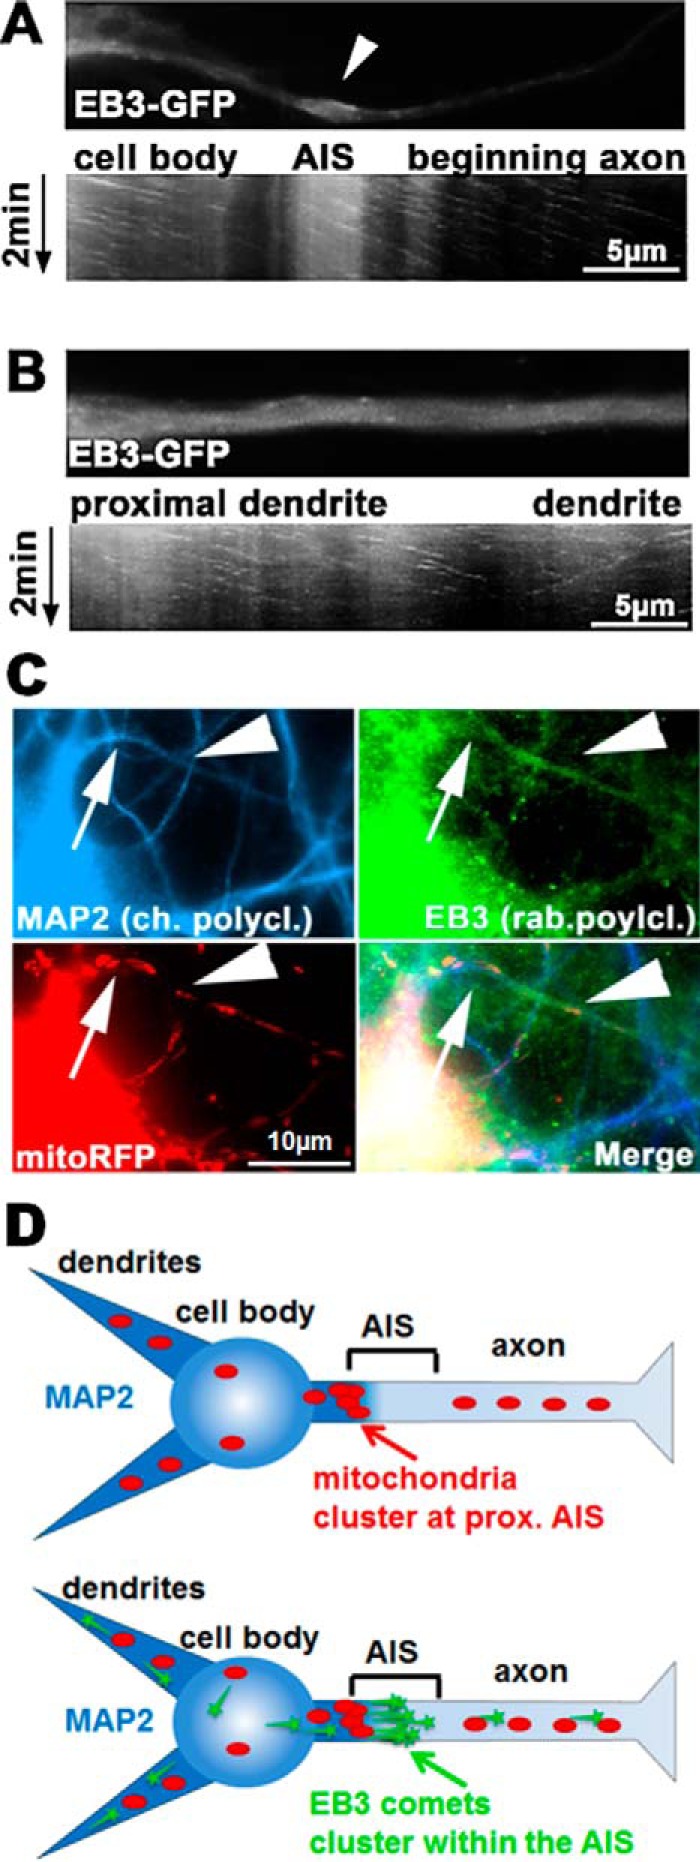
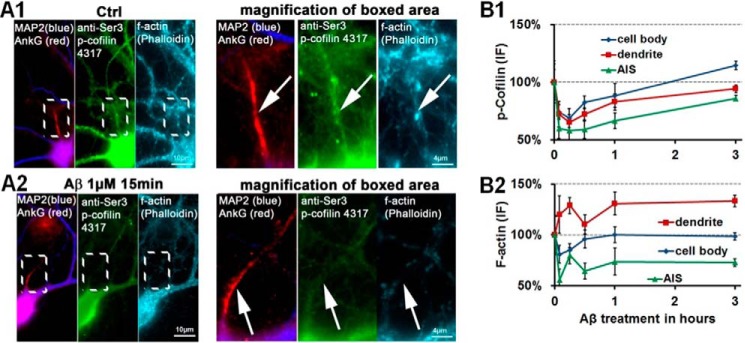
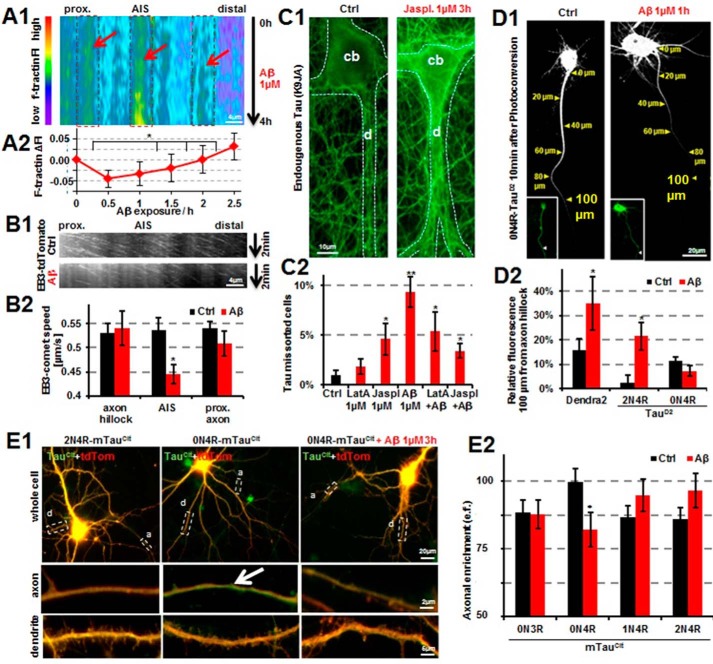
Subcellular mislocalization of the microtubule-associated protein Tau is a hallmark of Alzheimer disease (AD) and other tauopathies. Six Tau isoforms, differentiated by the presence or absence of a second repeat or of N-terminal inserts, exist in the human CNS, but their physiological and pathological differences have long remained elusive. Here, we investigated the properties and distributions of human and rodent Tau isoforms in primary forebrain rodent neurons. We found that the Tau diffusion barrier (TDB), located within the axon initial segment (AIS), controls retrograde (axon-to-soma) and anterograde (soma-to-axon) traffic of Tau. Tau isoforms without the N-terminal inserts were sorted efficiently into the axon. However, the longest isoform (2N4R-Tau) was partially retained in cell bodies and dendrites, where it accelerated spine and dendrite growth. The TDB (located within the AIS) was impaired when AIS components (ankyrin G, EB1) were knocked down or when glycogen synthase kinase-3β (GSK3β; an AD-associated kinase tethered to the AIS) was overexpressed. Using superresolution nanoscopy and live-cell imaging, we observed that microtubules within the AIS appeared highly dynamic, a feature essential for the TDB. Pathomechanistically, amyloid-β insult caused cofilin activation and F-actin remodeling and decreased microtubule dynamics in the AIS. Concomitantly with these amyloid-β-induced disruptions, the AIS/TDB sorting function failed, causing AD-like Tau missorting. In summary, we provide evidence that the human and rodent Tau isoforms differ in axodendritic sorting and amyloid-β-induced missorting and that the axodendritic distribution of Tau depends on AIS integrity.

Keywords: AIS; Alzheimer disease; Tau protein (Tau); amyloid-beta (Aβ); cell polarity; microtubule; neurodegeneration; tauopathy.


Conflict of interest statement

The authors declare that they have no conflicts of interest with the contents of this article

Figures

Figure 1.
Figure 1.
The second repeat and inserts synergistically prevent Tau from retrograde passage through the TDB in the AIS, whereas mutations cause retrograde leakage into the soma. A, bar diagrams of the studied isoforms of Tau. Red, alternatively spliced N-terminal inserts (N1 and N2); green, repeat domain; yellow, repeat 2 (R2). Mutated 2N4R-Tau species are displayed in the bottom half, and mutations are represented by red vertical lines. B, photoconversion of primary rat cortical neurons transfected with control 2N4R-TauD2 (top) or 2N4R-TauD2-KXGE mutant (bottom). 1 and 5, reference image of unconverted protein before photoconversion to identify soma and axon in the green channel. 2 and 6, before photoconversion, there is no fluorescence in the red channel. 3 and 4a, after photoconversion in the region of interest (dotted box, red), cells transfected with 2N4R-TauD2 (top) show movement of TauD2 beyond the region of interest but not into the soma (red triangle) and dendrites, indicating a retrograde barrier in the initial part of the axon. 7 and 8a, in contrast, cells transfected with 2N4R-TauD2-KXGE mutant show penetration of photoconverted protein into the somatodendritic compartment. Pictograms in 4b and 8b are a graphical representation of 2N4R-TauD2 unable to cross the diffusion barrier within the AIS (4b, cell body remains dark) and 4KXGE-TauD2, which crosses the AIS and reaches the cell soma (8b, cell body lights up). C, level of Tau leaking through the barrier into the soma after photoconversion shown for several Tau isoforms (blue) and Tau mutations (red). Isoforms lacking both the second repeat (R2) and the second insert (N2) penetrate into the somatodendritic compartment. Pseudophosphorylated Tau (KXGE) or FTLD-Tau related mutations (A152T and ΔK280) also cause incomplete axonal retention. Note that the tightness of the barrier does not depend on the propensity of Tau for β-structure that controls aggregation (compare ΔK280 and ΔK280PP). D, decay of a selection of photoconverted Dendra2 and TauD2 species in the photoconverted area of the axon. Axonal diffusion rates correlate with the MT binding potential of the species involved in some cases (e.g. Dendra2 → low and 8-repeat Tau → high), but not in case of FTLD-related Tau mutations. Note that the half-life of 2N4R-Tau is roughly intermediate between those of 8-repeat Tau and KXGE-Tau (indicated by dotted colored lines). a.u., arbitrary units. E, quantification of the half-lives in the photoconverted area of the axon (distal to the AIS) of all Tau isoforms, including 2N4R-Tau (§), Dendra2 alone (†), 8-repeat Tau (‡), KXGE-Tau (●), A152T-Tau, Tau ΔK280, and Tau ΔK280PP. Bars marked as Dendra2 alone (†), 8-repeat Tau (‡), 2N4R-Tau (§), and KXGE-Tau (●) are the quantifications of the decay curves displayed in D. *, p < 0.05. Error bars, S.E.
Figure 2.
Figure 2.
2N4R-Tau is retained in the somatodendritic compartment in wild-type neurons, where it induces accelerated spine and dendrite growth, whereas 0N4R-Tau can enter axons. Different isoforms of TauD2 were cotransfected with tdTomato (volume marker) for 6 days into primary neurons (7 DIV) derived from TauKO or wild-type mice. A and B, TauD2 transfected into TauKO cells (A) and wild-type cells (B). Transfected Tau was stained with an antibody against human Tau (CP27). Arrowheads, axon; arrows, dendrites. A, 0N4R-Tau shows strong enrichment in axons (for more constructs, see supplemental Fig. S1). B, wild-type neurons expressing endogenous Tau in addition to transfected exogenous TauD2 (stained with CP27). Exogenous and endogenous Tau are stained with a pan-Tau antibody (K9JA), and dendrites are stained with an antibody against MAP2. Columns 1 and 2, 0N4R-Tau is enriched in the axon. As a result, axonal Tau concentration is higher than in neighboring untransfected axons where only endogenous Tau is present, but it can barely be detected in dendrites with a pan-Tau antibody. Column 2 (bottom) shows magnified images from the boxed areas, and axon is indicated by arrowheads. Columns 3 and 4, 2N4R-Tau is not enriched in axons. Column 5, 2N4R-Tau pseudophosphorylated at the KXGS motifs (KXGS motifs mutated to KXGE) shows strong axonal enrichment. C1, quantification of axonal enrichment of different TauD2 isoforms and 2N4R-TauD2 mutations reveals lower axonal presence of the longest isoform of Tau (2N4R) compared with the other isoforms. The exception is the human-specific isoform 1N3R, not present in rodents. The mutations 4KXGE, A152T, and ΔK280PP of 2N4R-TauD2 increase the axonal sorting, whereas the mutation ΔK280 has no effect. C2, graphical sketch of the different distributions of the representative isoforms 0N4R (strong axonal enrichment) and 2N4R (weak axonal enrichment). Left panels, Tau distribution depicted in green. Right panels, Tau distribution in green presented relative to a volume marker with unbiased distribution in red, resulting in a ratiometric image. D and E, wild-type neurons with tdTomato as an unbiased volume/morphology marker. D, TauD2 transfection induces spine formation and maturation in young (10 DIV; 1–6) neurons, and Tau knockdown abolishes spine maturation in old (21 DIV; 7 and 8) neurons. 1, neurons only transfected with a control vector (Dendra2) show no spine formation and very few filopodia, representative of neurons on the brink of (but before) spine development. 2, transfection of 0N3R-Tau results in elongated filopodia-like protrusions up to 10 μm. 3, by contrast, 0N4R-Tau has no effect on dendritic spine/filopodia formation. 4, 2N4R-Tau-transfected cells show dendritic processes with mushroom heads (arrowheads), indicative of mature spines. 5 and 6, mutations of the KXGS motifs in the repeat domain to KXGE (5) or KXGA (6) of 2N4R-Tau prevent formation of protrusions and acceleration of spine maturation. For a comprehensive list of effects of all isoforms and several mutations, see supplemental Table S1. 7, aged control neurons display normal mature spines. 8, aged neurons transfected with shRNA against Tau display impaired spines. E1, Tau transfection induces dendritic outgrowth. Left, neuron transfected with a control vector (Dendra2). Right, neuron transfected with the 2N4R-Tau. The longest dendrites are indicated by red dashes. E2, quantification of the longest dendrite of cells transfected as indicated. F, graphical sketch of the dendritic effects of the representative Tau isoforms 0N3R (filopodia spines), 0N4R (no dendritic effects), and 2N4R (elongated dendrites and premature development of spines). *, p < 0.05. Error bars, S.E.
Figure 3.
Figure 3.
GSK3β induces missorting of Tau independently of phosphorylation of the SP/TP motifs of Tau. Primary cortical rat neurons (7 DIV) were cotransfected for 3 days with different versions of 2N4R-TauD2 and GSK3β (tagged with CFP). A, panels 1, 5, and 9 show cells in the green channel before photoconversion (PC); panels 2, 6, and 10 show cells in the red channel before PC; and panels 3, 4, 7, 8, 11, and 12 show cells in the red channel after photoconversion at the indicated times. Scale bars, 20 μm. A (1–4), primary rat cortical neurons (7 DIV) cotransfected with TauD2 and GSK3β(WT) show leakage of the Tau diffusion barrier and retrograde propagation of Tau back into the cell body (quantified in B (black bar)). A (5–8), inactive GSK3β-S9E does not cause leakage because TauD2 is retained in the axon and does not move into the cell body (quantified in B, red bar). A (9–12), mutating the GSK3β target sites of Tau to alanine (17 SP/TP motifs mutated to AP, AP17-TauD2) results in a leaky barrier so that AP17-TauD2 still shows retrograde propagation back into the cell body (quantified in B, purple bar). B, quantification of A as indicated. C, unable to be phosphorylated at its SP/TP motifs, AP17-Tau is revealed to have a very slow diffusion rate (purple trace). Penetration of the TDB can be seen, nonetheless, as was shown in panels 9–12 of A and the purple bar in B. Error bars, S.E.
Figure 4.
Figure 4.
Posttranslational modifications of MTs and STED nanoscopy demonstrate highly dynamic MTs within the AIS. Primary cortical neurons were fixed at 9–12 DIV and stained as indicated. The AIS is marked by dotted lines. A, examples of images of cells highlighting axon initial segments. Arrowheads, axons; arrows, dendrites. Asterisks, staining artifacts. A1 and A2, double staining with MAP2 (blue) as a dendritic marker and NrCam (red) as an AIS marker allows identification of the AIS. Acetylated tubulin (green) was used as an axonal marker, highlighting stable MTs. Insets, graphical sketches. A3, magnification of the boxed area of A2. Note that there is no signal for acetylated tubulin within the AIS. B–D, quantification of immunofluorescence intensities from the middle of the cell body over the AIS to the proximal axon. Red vertical line, beginning of the AIS. The right sections of graphs indicate distal axons. On average, the AIS begins about 15–20 μm from the center of the cell body and extends for about 20–30 μm as the AIS markers gradually change toward their values in the proximal axon. B, the beginning of the AIS is characterized by a decrease of MAP2 (blue) and an increase of NrCAM (red). C, levels of tyrosinated tubulin (corresponding to dynamic MTs; red) are lower in the AIS than in the cell body but higher than in the distal axons. Levels of acetylated tubulin are low at the proximal AIS. D, different fixation and extraction procedures were used for the preferred observation of unpolymerized tubulin (green) or MTs (brown) (see “Materials and methods”). Levels of free tubulin are high within the AIS, yet levels of MTs are low, indicating high levels of unpolymerized tubulin. E–G, STED nanoscopy of MTs within the AIS. E and F, normal fixation/extraction method to favor stable MTs. E1 and F1, there are no MTs stainable with an antibody against α-tubulin (E1) and very few fragmented MTs with an antibody against tyrosinated (dynamic) MTs (F1) within the AIS (space between dotted lines). E2 and F2, NrCam was used for identification of the AIS. G, extraction and fixation were conducted in buffers containing the MT stabilizer taxol and the molecular densifier PEG. Left panels, NrCam and MAP2 were used to identify the AIS. Arrow, point of increasing NrCam signal and decreasing MAP2 signal, hence the beginning of the AIS. Right, high density of MTs within the AIS stained by an antibody against tyrosinated (dynamic) MTs; arrow at the same position as in the left panels.
Figure 5.
Figure 5.
EB3 clusters in the proximal region of the AIS. Primary cortical neurons aged 9 DIV were transfected with EB3-GFP for 2 days. A and B, live imaging of EB3 and time-resolved kymographs of the AIS. A, EB3 comets are enriched and dynamic within the AIS. Top, first frame of time-lapse imaging of the AIS and the proximal axon. Arrow, thickening of the AIS typically present over 5–10 μm within the AIS. Bottom, kymograph of the EB3 comets show unidirectional movement only anterogradely, typical of the axon, and comets within the AIS thickening. B, analogous region as in A, but in a proximal dendrite. Note that EB3 comets move in both directions, and there is no thickening or area of enrichment of EB3. C, cells were fixed 2 days after transfection with mitoRFP and stained for MAP2 and EB3 for identification of the AIS. Arrow, beginning of AIS (end of MAP2 staining) and mitochondrial agglomeration proximal to the AIS; arrowhead, thickening of the AIS and enrichment with EB3 distal to the mitochondrial cluster. D, graphical sketch of mitochondrial and EB3 positioning at the AIS. Mitochondria cluster at the proximal end of the AIS (where MAP2 diminishes), whereas EB3 staining is localized within the AIS.
Figure 6.
Figure 6.
Aβ exposure results in cofilin activation and loss of F-actin within the AIS. Primary neurons 21 DIV were treated with 1 μm Aβ as indicated and then fixed and stained as indicated. A, co-staining of the AIS with phospho-cofilin (p-Cofilin) (via a phosphorylation-dependent antibody) and F-actin (stained via phalloidin) shows positive stainings in control conditions (A1) but reveals a loss of phospho-cofilin (dephosphorylation results in activation of cofilin and severing of F-actin) and loss of F-actin signal after 15 min of Aβ exposure (A2). B, quantification of phospho-cofilin signals (B1) and F-actin signals (B2). Error bars, S.E.
Figure 7.
Figure 7.
Aβ disrupts the Tau diffusion barrier via impairment of MT dynamics in the AIS. A, kymograph (A1) of the AIS of an f-tractinCitrine-transfected primary cortical neuron (12 DIV) for 4 days after treatment with Aβ. The F-actin-labeling protein f-tractinCitrine accumulates within the AIS, indicating an increase in area covered by F-actin. Boxed areas, regions of higher F-actin concentrations within the AIS. Arrows, increasing F-actin (1–1.5 h). Quantification (A2) reveals a constant increase in fluorescence intensity (FI) of f-tractineCitrine after 0.5-h exposure to Aβ. B, kymographs (B1) of the AIS of EB3-tdTomato-transfected primary cortical neurons 11 DIV untreated (top) or treated with Aβ (1 μm) for 1.5 h. Quantification (B2) reveals decreased speed of EB3 comets only within the AIS. C, treatment of primary neurons (20 DIV) with jasplakinolide (Jaspl.) and Aβ, but not latrunculin-A (LatA), results in missorting of endogenous Tau. Neurons were treated for 3 h as indicated and stained with K9JA for total Tau (green). C1, control neurons show little Tau presence in the somatodendritic compartment (left), whereas treatment with jasplakinolide (1 μm) results in increased Tau presence in the somatodendritic compartment. cb, cell body; d, dendrite. C2, quantification of missorting of Tau, as indicated. D, 2N4R-TauD2 and 0N4R-TauD2 as well as Dendra2 were transfected into primary rat cortical neurons (8 DIV) for 3 days. D1, images depict neurons 10 min post-photoconversion in the soma; insets show cells before photoconversion and distribution of the unconverted protein in green. Left, 0N4R-TauD2-transfected neurons show fast anterior movement of photoconverted 0N4R-TauD2. Right, treatment with 1 μm Aβ for 1 h reduces axonal sorting of 0N4R-TauD2. D2, quantification of experiments as shown in D1. Cells transfected with Dendra2 alone or 0N4R-TauD2 show anterograde penetration of the TDB, whereas 2N4R-TauD2 shows reduced anterograde movement into the axon in control conditions (black bars). Treatment with Aβ for 1 h reduces retention of Dendra2 and 2N4R-TauD2 but shows a trend for enhanced retention of 0N4R-TauD2. E, axonal sorting of the 0N4R-Tau is disrupted by Aβ treatment. Primary cortical neurons 16 DIV were transfected with the different rodent isoforms of Tau tagged with citrine (mTauCit; green) and the volume marker tdTomato (red) for 5 days. E1, 2N4R-mTauCit shows little enrichement in the axon (left panels), whereas the 0N4R-mTauCit isoform is enriched in the axon (middle panels, arrow; green), but this enrichment is lost after Aβ treatment (right panels). E2, quantification of the axonal enrichment of all rodent Tau isoforms tagged with citrine (mTauCit) with and without treatment with 1 μm Aβ for 3 h. The shorter 0N isoforms are enriched in the axon (arrow), but this enrichment is partially lost after Aβ treatment. *, p < 0.05; **, p < 0.01. Error bars, S.E.

Similar articles

Cited by

References

    1. Morris M., Maeda S., Vossel K., and Mucke L. (2011) The many faces of tau. Neuron 70, 410–426 - PMC - PubMed
    1. Wang Y., and Mandelkow E. (2016) Tau in physiology and pathology. Nat. Rev. Neurosci. 17, 5–21 - PubMed
    1. Goedert M., Spillantini M. G., Potier M. C., Ulrich J., and Crowther R. A. (1989) Cloning and sequencing of the cDNA encoding an isoform of microtubule-associated protein tau containing four tandem repeats: differential expression of tau protein mRNAs in human brain. EMBO J. 8, 393–399 - PMC - PubMed
    1. Andreadis A. (2012) Tau splicing and the intricacies of dementia. J. Cell. Physiol. 227, 1220–1225 - PMC - PubMed
    1. Trabzuni D., Wray S., Vandrovcova J., Ramasamy A., Walker R., Smith C., Luk C., Gibbs J. R., Dillman A., Hernandez D. G., Arepalli S., Singleton A. B., Cookson M. R., Pittman A. M., de Silva R., et al. (2012) MAPT expression and splicing is differentially regulated by brain region: relation to genotype and implication for tauopathies. Hum. Mol. Genet. 21, 4094–4103 - PMC - PubMed

Publication types

MeSH terms

LinkOut - more resources