Comparative Study
. 2017 Jul 14;292(28):11682-11701.
doi: 10.1074/jbc.M117.793521. Epub 2017 May 23.

Exosomes from uninfected cells activate transcription of latent HIV-1

Affiliations
Comparative Study

Exosomes from uninfected cells activate transcription of latent HIV-1

Robert A Barclay et al. J Biol Chem. .

Erratum in

Abstract

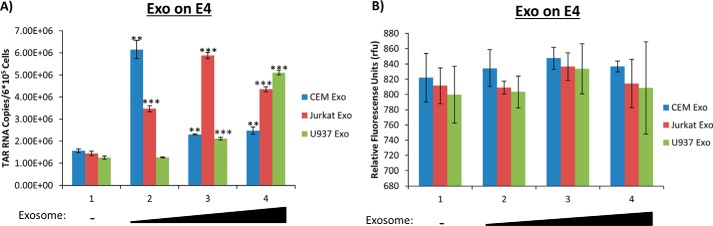
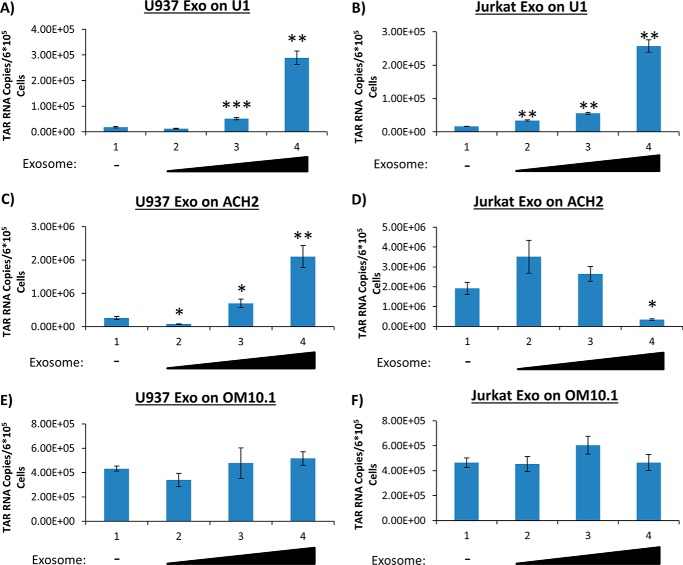
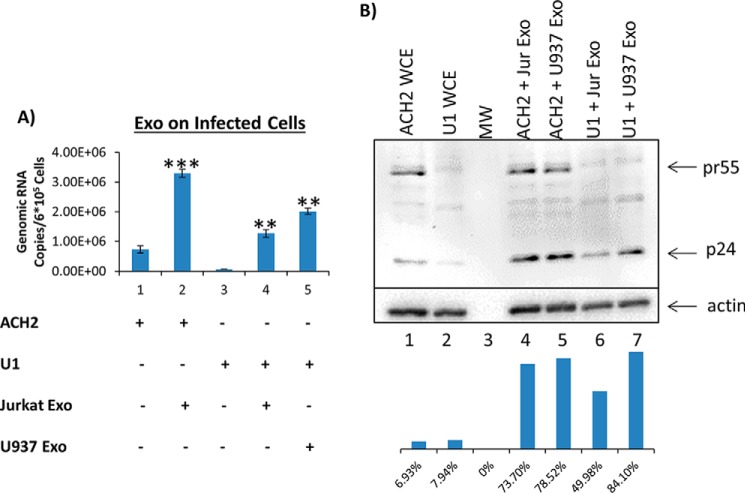
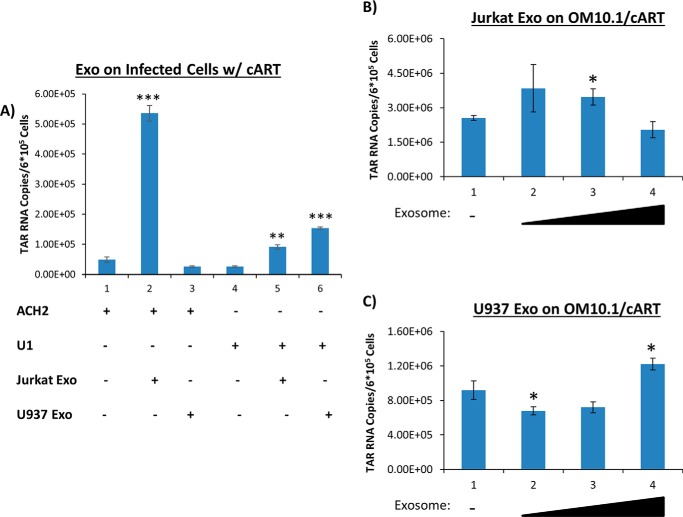
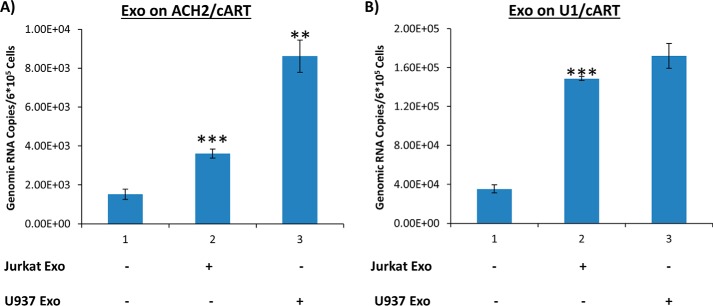
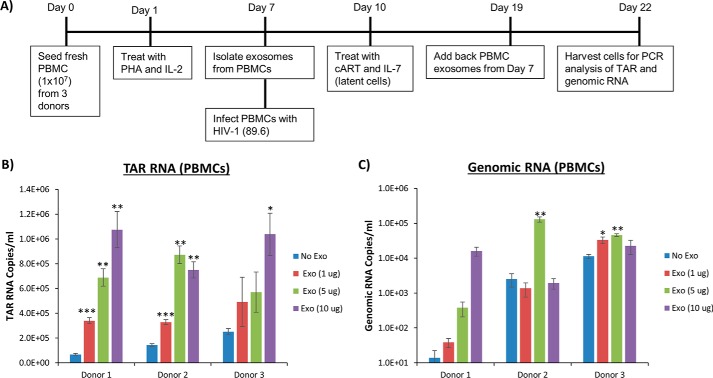
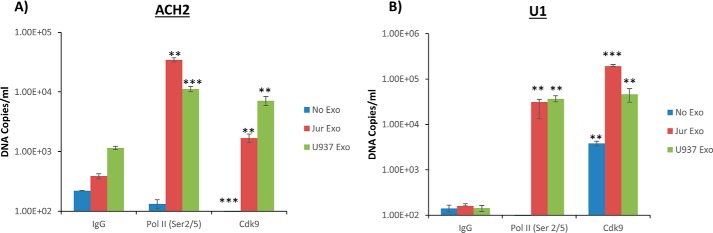
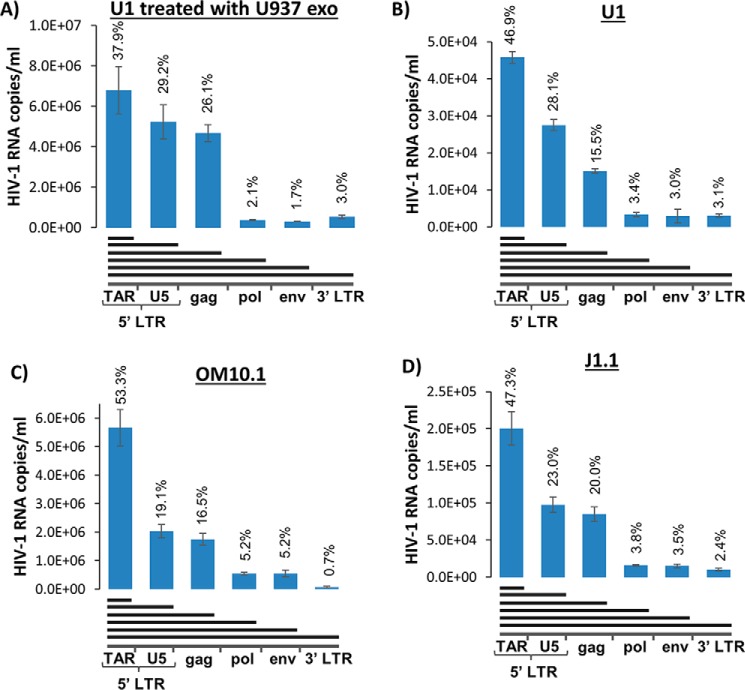
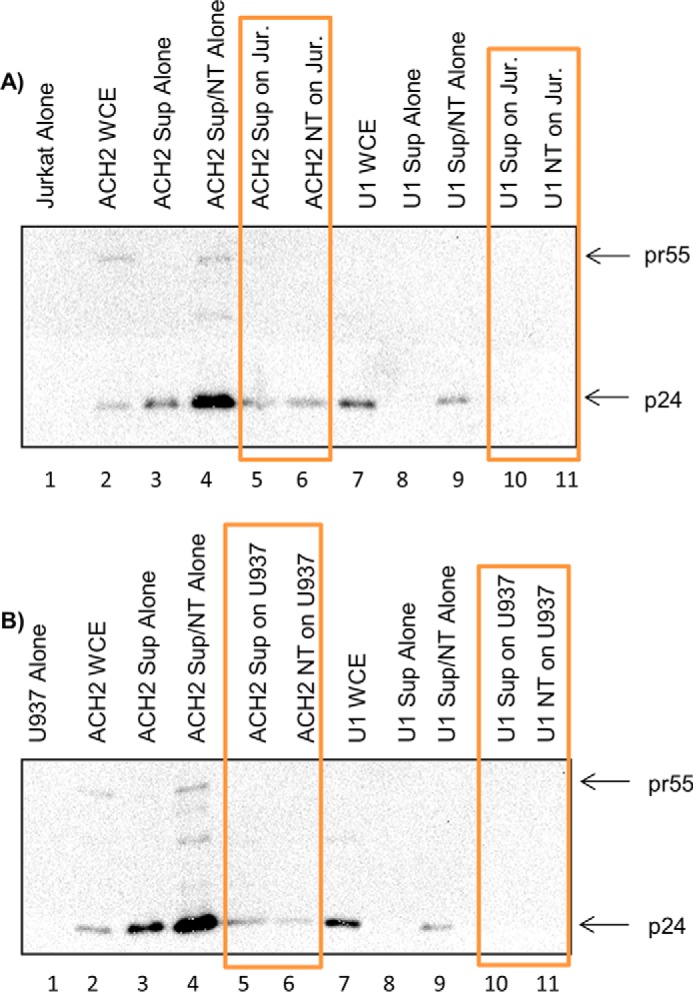
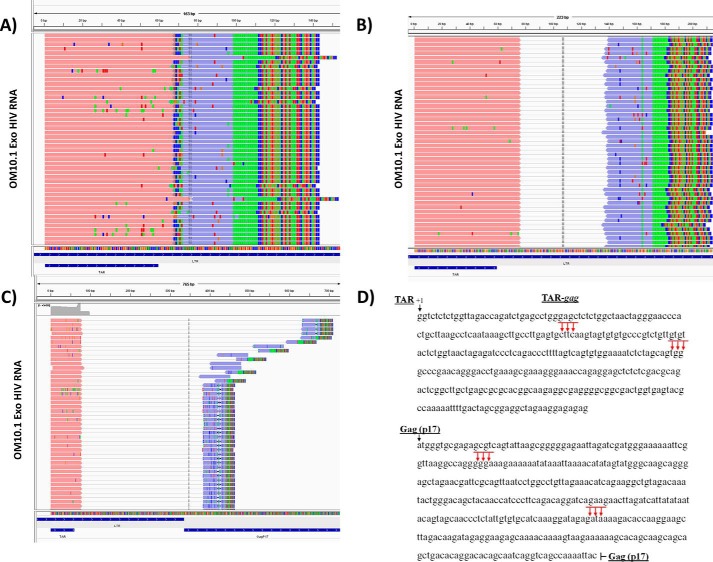
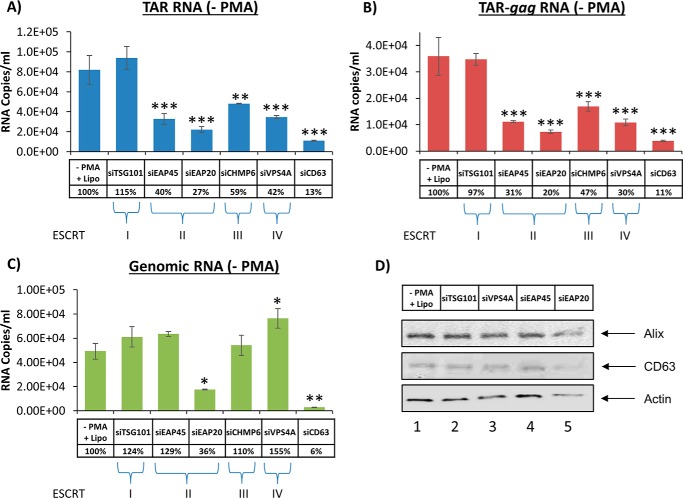
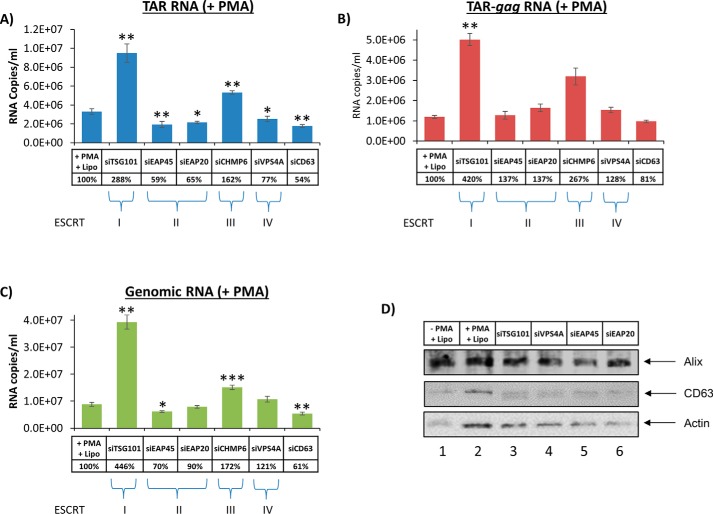
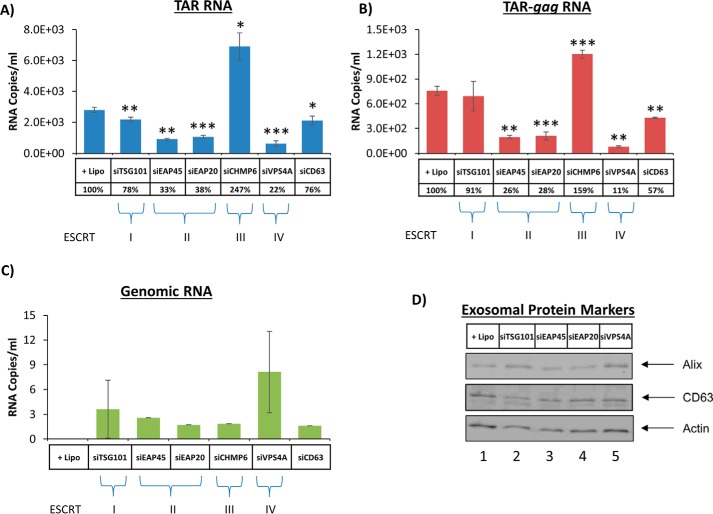
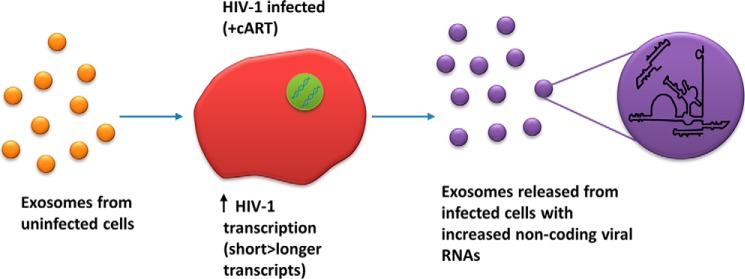
HIV-1 infection causes AIDS, infecting millions worldwide. The virus can persist in a state of chronic infection due to its ability to become latent. We have previously shown a link between HIV-1 infection and exosome production. Specifically, we have reported that exosomes transport viral proteins and RNA from infected cells to neighboring uninfected cells. These viral products could then elicit an innate immune response, leading to activation of the Toll-like receptor and NF-κB pathways. In this study, we asked whether exosomes from uninfected cells could activate latent HIV-1 in infected cells. We observed that irrespective of combination antiretroviral therapy, both short- and long-length viral transcripts were increased in wild-type HIV-1-infected cells exposed to purified exosomes from uninfected cells. A search for a possible mechanism for this finding revealed that the exosomes increase RNA polymerase II loading onto the HIV-1 promoter in the infected cells. These viral transcripts, which include trans-activation response (TAR) RNA and a novel RNA that we termed TAR-gag, can then be packaged into exosomes and potentially be exported to neighboring uninfected cells, leading to increased cellular activation. To better decipher the exosome release pathways involved, we used siRNA to suppress expression of ESCRT (endosomal sorting complex required for transport) proteins and found that ESCRT II and IV significantly control exosome release. Collectively, these results imply that exosomes from uninfected cells activate latent HIV-1 in infected cells and that true transcriptional latency may not be possible in vivo, especially in the presence of combination antiretroviral therapy.

Keywords: T-cell; endosomal sorting complexes required for transport (ESCRT); exosome (vesicle); human immunodeficiency virus (HIV); latency; monocyte; small interfering RNA (siRNA); transcription.


Conflict of interest statement

The authors declare that they have no conflicts of interest with the contents of this article

Figures

Figure 1.
Figure 1.
Exosomes from uninfected cells on latent HIV-1–infected cells increase short RNA levels. A, exosomes from CEM, Jurkat, and U937 cells were isolated using ultracentrifugation prior to addition to Jurkat E4 cells in 0.24-, 0.78-, and 2.4-unit/ml increments (determined using an AchE assay) once per day over the course of 3 days. The E4s were incubated for an additional 48 h prior to harvest, and total RNA was isolated and subjected to RT with a TAR-specific primer. qPCR was performed to quantify the total amount of TAR RNA copies. B, exosomes from CEM, Jurkat, and U937 cells were isolated using ultracentrifugation prior to addition to Jurkat E4 cells in 0.6-, 1.2-, and 1.8-unit/ml (determined using AchE assay) increments. The cells were then incubated for an additional 48 h prior to a GFP assay. Student's t tests compared untreated cells with cells treated with exosomes. In Figs. 1–7 and 10, all cells were grown in exosome-free medium. **, p < 0.01; ***, p < 0.001. Error bars, S.D.
Figure 2.
Figure 2.
Presence of short RNA transcripts in wild-type HIV-1–infected T cells and monocytes. Exosomes from Jurkat and U937 cells were isolated using ultracentrifugation prior to being added to ACH2, U1, or OM10.1 cells once per day over the course of 3 days. The cells were then allowed to incubate for an additional 48 h prior to harvest. Total RNA was isolated and then subjected to RT with a primer specific for TAR. qPCR was performed to quantify the total amount of TAR RNA copies. A, U1 cells were treated with 2.79, 13.95, and 41.85 milliunits/ml U937 exosomes. B, U1 cells were treated with 2.90, 14.5, and 43.5 milliunits/ml Jurkat exosomes. C, ACH2 cells were treated with 2.42, 12.10, and 36.30 milliunits/ml U937 exosomes. D, ACH2 cells were treated with 1.75, 8.75, and 26.25 milliunits/ml Jurkat exosomes. E, OM10.1 cells were treated with 2.42, 12.10, and 36.30 milliunits/ml U937 exosomes. F, OM10.1 cells were treated with 1.75, 8.75, and 26.25 milliunits/ml Jurkat exosomes. All exosome concentrations were determined by an AchE assay. Student's t tests compare exosome-treated cells with untreated cells. Error bars, S.D.
Figure 3.
Figure 3.
The addition of uninfected exosomes to wild-type HIV-1–infected cells increases long transcript levels. A, exosomes from Jurkat and U937 cells were isolated using ultracentrifugation prior to addition to ACH2 and U1 cells at concentrations of 26.25 milliunits/ml (lane 2), 43.50 milliunits/ml (lane 4), and 41.85 milliunits/ml (lane 5) (all were determined by an AchE assay). The exosomes were added once per day for 3 days prior to incubation for another 48 h. The cells were then harvested; total RNA was isolated and subjected to RT with a primer specific to the 3′-end of the HIV-1 genome. qPCR was performed with gag-specific primers to quantify the levels of genomic mRNA. B, exosomes from Jurkat and U937 cells were isolated using ultracentrifugation before addition to ACH2 and U1 cells at concentrations of 26.25 milliunits/ml (lanes 4 and 6) and 41.85 milliunits/ml (lanes 5 and 7), respectively. The exosomes were added once per day for 3 days prior to incubation for another 48 h. The cells were then harvested and lysed, and the resulting lysates were run on a gel, transferred, and subjected to Western blotting for the presence of pr55 and p24. β-Actin was used as a control. Student's t tests compare exosome-treated ACH2 cells with untreated ACH2 cells, whereas a second t test compares exosome-treated U1 cells with untreated U1 cells. Whole-cell extract (WCE) was used as positive control for Western blots. Molecular weight (MW) is shown in lane 3. Error bars, S.D.
Figure 4.
Figure 4.
Presence of short RNA transcripts in wild-type HIV-1–infected T cells and monocytes treated with cART. Exosomes from Jurkat and U937 cells were isolated using ultracentrifugation. The aforementioned exosomes were added to either ACH2 cells or U1 cells under cART treatment. cART consisted of an equal-parts (10 μm) mixture of indinavir (IDV), lamivudine (3TC), tenofovir disoproxil fumarate (TDF), and emtricitabine (FTC). A, the exosomes were added at concentrations of 1.60 milliunits/ml (lanes 2 and 4) and 1.88 milliunits/ml (lanes 3 and 5) once per day over the course of 3 days. The cells were allowed to incubate an additional 48 h prior to harvest; their total RNA was isolated and subjected to RT with a TAR-specific primer. qPCR was performed to quantify the total amount of TAR RNA copies. B, OM10.1 cells were treated with exosomes derived from Jurkat cells. The concentration of exosomes added to each sample was 0.107 milliunits/ml (lane 2), 0.535 milliunits/ml (lane 3), or 1.60 milliunits/ml (lane 4). C, OM10.1 cells were treated with exosomes derived from U937 cells. The concentration of exosomes added to each sample was as follows: 0.125 milliunits/ml (lane 2), 0.626 milliunits/ml (lane 3), or 1.88 milliunits/ml (lane 4). All exosome concentrations were determined by an AchE assay. Student's t test compares exosome-treated ACH2 cells with untreated ACH2 cells, whereas a second t test compares exosome-treated U1 cells with untreated U1 cells. A third t test compares exosome-treated OM10.1 cells with untreated OM10.1 cells. Error bars, S.D.
Figure 5.
Figure 5.
Effect of uninfected exosomes on long RNA transcripts in wild-type HIV-1–infected cells under cART conditions. Exosomes from Jurkat and U937 cells were isolated using ultracentrifugation prior to addition to ACH2 (A) and U1 cells (B); cells were under cART treatment, which consisted of an equal-parts (10 μm) mixture of IDV, 3TC, TDF, and FTC. Concentrations of exosomes were 1.60 milliunits/ml (lane 2) and 1.88 milliunits/ml (lane 3). Exosomes were added once per day for 3 days. Cells were allowed to incubate for an additional 48 h. The cells were then harvested; total RNA was isolated and subjected to RT with a primer specific to the 3′-end of the HIV-1 genome. RT-qPCR was performed to quantify the levels of genomic RNA. Student's t test was performed to compare exosome-treated lanes with untreated lanes. Experimental results in B (lane 3) were run on a plate different from that used for lanes 1 and 2 and thus cannot be statistically compared with lane 1. Error bars, S.D.
Figure 6.
Figure 6.
The addition of uninfected exosome causes increase of short and long RNA transcripts in wild-type HIV-1–infected PBMCs treated with cART. A, diagram of the experimental design used for primary cell infection and exosome treatment. Briefly, PBMCs from three different donors were treated with phytohemagglutinin (PHA) and IL-2 and allowed to grow for 1 week. Exosomes were then isolated from 25 ml of supernatant from each of the PBMCs prior to infection with HIV-1 (89.6); 3 days later, cells were treated with IL-7, to induce latency, as well as with cART, which consisted of an equal-parts (10 μm) mixture of IDV, 3TC, TDF, and FTC. Twelve days postinfection, the exosomes were added to each of their respective PBMCs, and the cells were allowed to incubate for an additional 72 h prior to harvest. Total RNA was isolated and then subjected to RT with a TAR-specific primer (B) and a primer specific to the 3′-end of the HIV-1 genome (C). qPCR was performed to quantify the total amount of TAR RNA and genomic RNA copies. Student's t test was used to compare untreated cells with exosome-treated cells for each donor. Error bars, S.D.
Figure 7.
Figure 7.
Presence of increased RNA pol II and Cdk9 on HIV-1 genome when treated with exosomes from uninfected cells. Exosomes from Jurkat and U937 cells were isolated by ultracentrifugation and added to ACH2 (A) and U1 (B) cells under cART treatment. The exosomes were added at a concentration of 0.403 millunits/ml once per day for 3 days. Cells were allowed to incubate for an additional 48 h. The cells were cross-linked prior to ChIP assay utilizing antibodies for phosphorylated RNA polymerase II (Ser-2/5), Cdk9, and IgG. DNA was then quantified using qPCR. The primers for the PCR were NF-κB1–2F and TAR +59-R (supplemental Fig. 2). Student's t test was used to compare samples with the IgG control. Error bars, S.D.
Figure 8.
Figure 8.
Presence of viral RNA in exosomes from patient PBMCs. A, PBMCs and serum were obtained from HIV-1-infected patients on cART from the Women's Interagency HIV Study (WIHS) (76, 77). Each patient was receiving a different cART treatment. The drugs used were zidovudine (AZT), efavirenz (EFV), nevirapine (NVP), 3TC, FTC, and TDF. B, serum was incubated with a 30% NT080/082 slurry overnight at 4 °C. Total RNA was isolated from the nanoparticles and from the PBMC cells and subjected to RT with primers specific for TAR and the 3′-end. Total DNA was also isolated from the PBMC cells. RT-qPCR was performed on the cDNA with TAR and gag primers and on the isolated DNA with GAPDH primers (for normalization). The results are in percentage of the negative control. Error bars, S.D. of three independent measurements. C, proportion of HIV-1 provirus to GAPDH DNA for each patient.
Figure 9.
Figure 9.
Exosomes contain various viral RNA transcripts. A, U937-derived exosomes were added to U1 cells and incubated for 3 days. The cell supernatant was then collected, passed through a 0.22-μm filter, and incubated with NT080/082 overnight. Total RNA was isolated from the nanoparticles and subjected to RT with primers specific for TAR, U5, gag, pol, env, and the 3′-end of the HIV-1 genome. RT-qPCR was performed with primers specific for TAR (with the 3′-RT, gag primers were used for qPCR). B–D, U1, OM10.1, and J1.1 cells were grown for 4 days. The cell supernatant was then collected, filtered through a 0.22-μm filter, and incubated with NT080/082 overnight. Total RNA was isolated from the nanoparticles and subjected to RT with primers specific for TAR, U5, gag, pol, env, and the 3′-end of the HIV-1 genome. RT-qPCR was performed with primers specific for TAR (with the 3′-RT, gag primers were used for qPCR). Error bars, S.D.
Figure 10.
Figure 10.
TAR-gag is a long non-coding RNA. ACH2 cells and U1 cells were pretreated for 5 days with a cART mixture. One milliliter of cell supernatant was collected and treated with nanotraps (NT), specifically a 30% NT080/082 slurry, prior to rotating for 16 h at 4 °C to concentrate exosomes. Jurkat and U937 cells (3.5 × 10⁶; 0.75 and 1.0 ml, respectively) were treated with 1 ml of either ACH2 or U1 supernatants or the concentrated exosomes from the infected cells (emphasized by orange boxes). Jurkat (A) and U937 (B) were incubated for 72 h prior to harvest for Western blotting using p24 and pr55 combined antibodies. Whole-cell extract (WCE) was used as a positive control for Western blots.
Figure 11.
Figure 11.
Sequence alignment of exosomal RNA using Integrated Genomics Viewer. The paired-end reads are depicted by left reads (pink) and right reads (purple) connected by a thin gray line. The mismatch nucleotides are individually colored for A (green), T (red), G (brown), and C (blue). The figure depicts results from OM10.1 exosomes, which were similar to the J1.1 exosomes. A, cluster of reads ending at ∼135 bp (+1 is the start of transcription) in the LTR region. For this cluster, the left and right reads overlap, and thus the connecting gray line is not shown. B, cluster of reads ending at ∼300 bp in the LTR region. C, cluster of reads ending at ∼408 bp in the beginning and ∼615 bp toward the end of the Gag (p17) region. D, diagram and sequence of HIV-1 LTR and p17 region of gag that maps to multiple clusters of RNA reads using NexGen sequencing.
Figure 12.
Figure 12.
Exosome release from infected monocytes treated with siRNA against the ESCRT pathway. Infected U1 cells were treated with various siRNAs against TSG101, EAP45, EAP20, CHMP6, Vps4A, and CD63 (at 20 nm final concentration) using Lipofectamine. Supernatants were isolated 72 h post-treatment and utilized for RNA isolation or Western blotting. RT-qPCRs were utilized for TAR RNA (A), TAR-gag (B), and genomic RNA (C). Lipofectamine treatment alone served as a negative control. Error bars, S.D. of three independent measurements. D, Western blotting for components of exosomes, including Alix, CD63, and actin, was performed.
Figure 13.
Figure 13.
Exosome release from infected macrophages treated with siRNA against the ESCRT pathway. Experimental designs were similar to the ones described in the legend to Fig. 12, with the exception of PMA treatment. U1 cells were first treated with various siRNAs; the next day, they were treated with PMA at 10 μm. RT-qPCR samples were performed for TAR (A), TAR-gag (B), and genomic RNA (C). D, Western blot analysis for exosomal proteins. Error bars, S.D.
Figure 14.
Figure 14.
Exosome release in siRNA-treated CHME5/HIV cells. The CHME5/HIV cells were treated with various siRNAs (similar to Figs. 12 and 13), and exosomes were enriched with NT080/082 beads overnight. RNA was isolated for RT-qPCR using TAR (A), TAR-gag (B), and genomic RNA (C) primers. D, Western blot analyses of the treated samples for exosomal markers, including Alix, CD63, and actin, were performed. Error bars, S.D.
Figure 15.
Figure 15.
A proposed model for exosomal activation of latent HIV-1 genome. Exosomes from uninfected cells increase HIV-1 transcription in infected cells under cART. Short viral RNA transcripts (i.e. TAR) are increased more than genomic RNA transcripts. Exosomes released from these cells contain an increased amount of non-coding viral RNA transcripts, including TAR and TAR-gag RNA.

References

    1. Kumar A., Abbas W., and Herbein G. (2014) HIV-1 latency in monocytes/macrophages. Viruses 6, 1837–1860 - PMC - PubMed
    1. Mbonye U., and Karn J. (2014) Transcriptional control of HIV latency: cellular signaling pathways, epigenetics, happenstance and the hope for a cure. Virology 454, 328–339 - PMC - PubMed
    1. Archin N. M., Sung J. M., Garrido C., Soriano-Sarabia N., and Margolis D. M. (2014) Eradicating HIV-1 infection: seeking to clear a persistent pathogen. Nat. Rev. Microbiol. 12, 750–764 - PMC - PubMed
    1. Shan L., Yang H.-C., Rabi S. A., Bravo H. C., Shroff N. S., Irizarry R. A., Zhang H., Margolick J. B., Siliciano J. D., and Siliciano R. F. (2011) Influence of host gene transcription level and orientation on HIV-1 latency in a primary-cell model. J. Virol. 85, 5384–5393 - PMC - PubMed
    1. Verdin E., Paras P. Jr., and Van Lint C. (1993) Chromatin disruption in the promoter of human immunodeficiency virus type 1 during transcriptional activation. EMBO J. 12, 3249–3259 - PMC - PubMed

Publication types

MeSH terms

Substances