. 2017 Aug 1;77(15):3990-3999.
doi: 10.1158/0008-5472.CAN-16-2393. Epub 2017 May 23.

SIRT3-Mediated Dimerization of IDH2 Directs Cancer Cell Metabolism and Tumor Growth

Affiliations

SIRT3-Mediated Dimerization of IDH2 Directs Cancer Cell Metabolism and Tumor Growth

Xianghui Zou et al. Cancer Res. .

Abstract

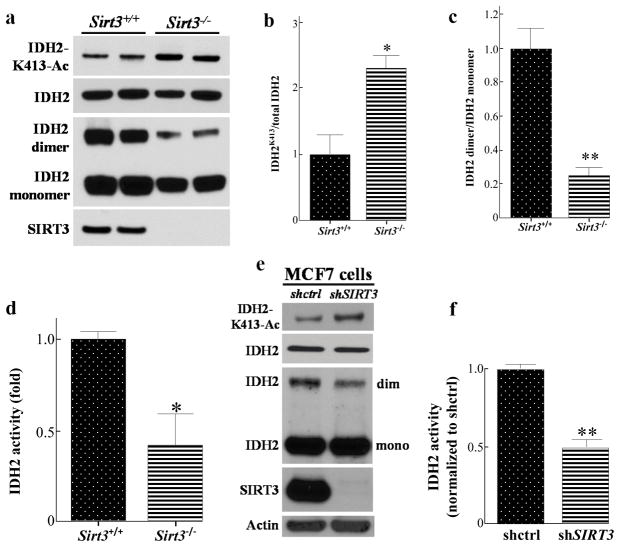
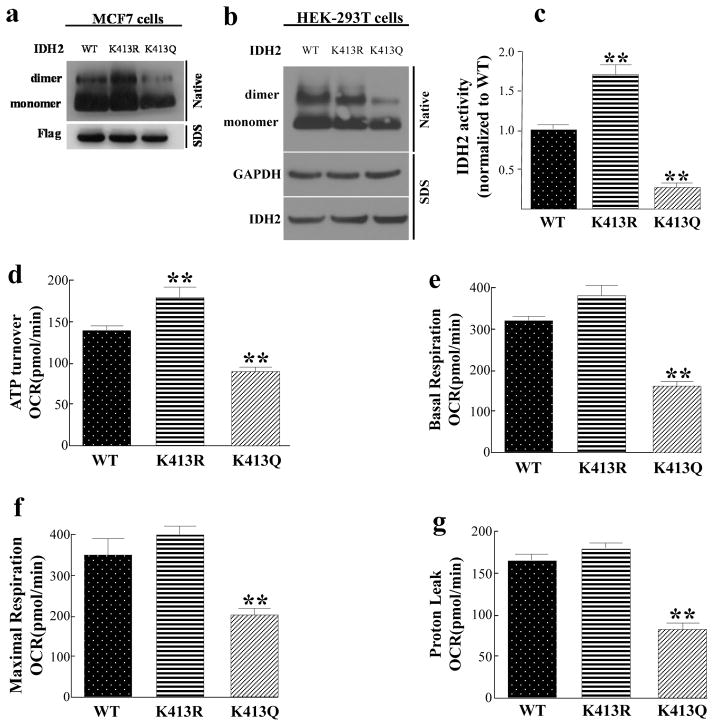
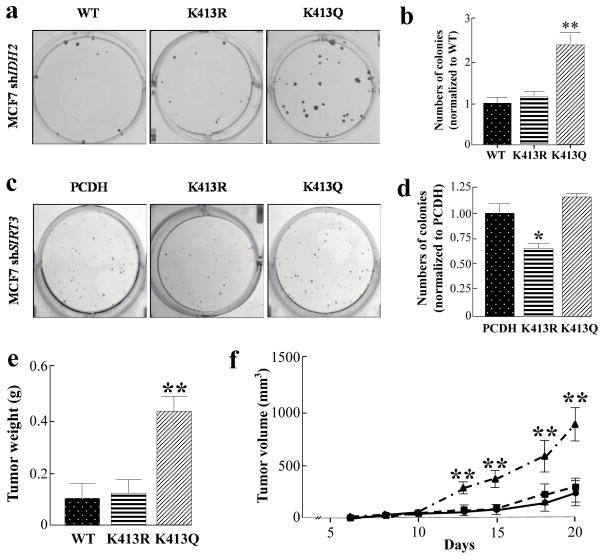
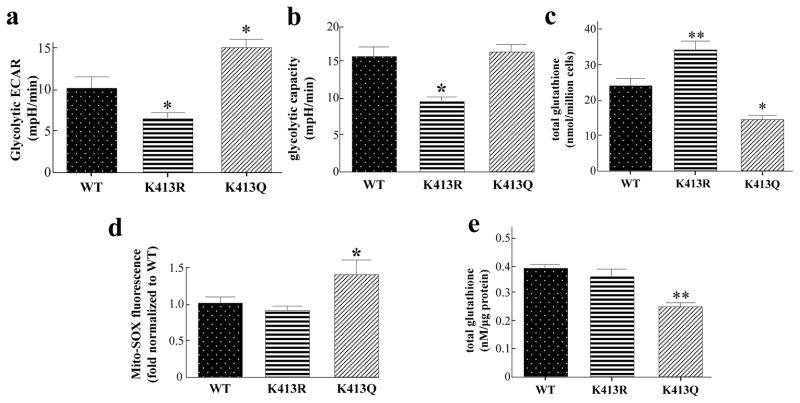
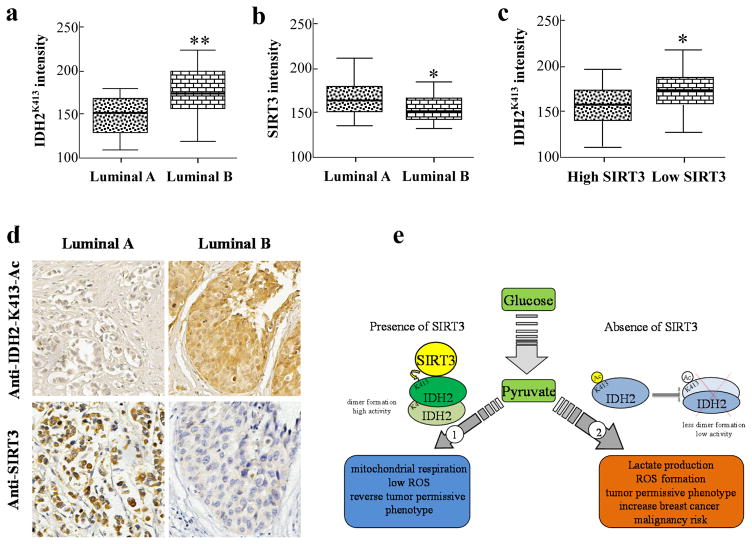
The isocitrate dehydrogenase IDH2 produces α-ketoglutarate by oxidizing isocitrate, linking glucose metabolism to oxidative phosphorylation. In this study, we report that loss of SIRT3 increases acetylation of IDH2 at lysine 413 (IDH2-K413-Ac), thereby decreasing its enzymatic activity by reducing IDH2 dimer formation. Expressing a genetic acetylation mimetic IDH2 mutant (IDH2K413Q) in cancer cells decreased IDH2 dimerization and enzymatic activity and increased cellular reactive oxygen species and glycolysis, suggesting a shift in mitochondrial metabolism. Concurrently, overexpression of IDH2K413Q promoted cell transformation and tumorigenesis in nude mice, resulting in a tumor-permissive phenotype. IHC staining showed that IDH2 acetylation was elevated in high-risk luminal B patients relative to low-risk luminal A patients. Overall, these results suggest a potential relationship between SIRT3 enzymatic activity, IDH2-K413 acetylation-determined dimerization, and a cancer-permissive phenotype. Cancer Res; 77(15); 3990-9. ©2017 AACR.


Conflict of interest statement

The authors have no conflict of interest

Figures

Figure 1
Figure 1. Loss of SIRT3 increases IDH2 K413-Ac, decreases IDH2 dimerization, and its activity
(a) Wild-type and Sirt3−/− mice livers lysates were SDS-PAGE gel separated and immunoblotted with anti-acetyl IDH2K413 and anti-IDH2 antibodies. For IDH2 dimerization, lysates were treated with 0.05% glutaldehyde and separated by SDS-PAGE. (b–c) IDH2 acetylation and IDH2 dimerization were quantified using ImageJ software, and results were normalized to Sirt3+/+ liver samples (n=5). (d) The mitochondrial extracts from wild-type and Sirt3−/− mice livers (n=5) were collected and mitochondrial NADP+-dependent IDH2 activity was measured. (e) Lysates of MCF7-shctrl and MCF7-shSIRT3 cells were immunoblotted with anti-IHD2-K413-Ac, IDH2, SIRT3 and actin antibodies. (f) MCF7-shctrl or MCF7-shSIRT3 cell mitochondrial extracts (n=3) were collected and IDH2 activity was measured. Representative images are shown. Results are from three separate experiments, and error bars represent one standard deviation. * indicates p<0.05, ** indicates p<0.01, by two-tailed unpaired t test using Prism 6.0.
Figure 2
Figure 2. Expression of IDH2K413Q in IDH2 knock-downed MCF7 and HEK-293T cells decreases IHD2 dimerization, mitochondrial respiration capacity, and increases glycolytic capacity
(a–b) MCF7 and HEK-293T cells were transfected with flag-tagged IDH2WT, IDH2K413R (de-acetyl mimetic), or IDH2K413Q (acetyl mimetic). Forty-eight hours after transfection, cells were lysed, eluted, and separated on a native-PAGE gel and immunoblotted with anti-IDH2 antibody. (c) MCF7-shIDH2-IDH2WT, MCF7-shIDH2-IDH2K413R, or MCF7-shIDH2-IDH2K413Q cells (n=3) were measured for IDH2 activity as above. (d–g) MCF7-shIDH2-IDH2WT, MCF7-shIDH2-IDH2K413R, or MCF7-shIDH2-IDH2K413Q cells (n=7) were measured for (d) ATP turnover, (e) mitochondrial basal respiration, (f) mitochondrial respiration capacity, and (g) proton leak. The ATP turnover rate was determined by the difference between the starting OCR and the OCR after adding oligomycin. The basal respiration rate was determined by the difference between the starting OCR and the OCR after adding antimycin /rotenone mixture. The maximal respiration rate was determined by the difference between the OCR after adding CCCP and the OCR after adding antimycin/rotenone. The proton leak rate was determined by the difference between the OCR after adding oligomycin and the OCR after adding antimycin/rotenone mixture. Results are from three separate experiments and error bars represent one standard deviation. * indicates p<0.05, ** indicates p<0.01, comparing to WT by two-tailed unpaired t-test using Prism 6.0.
Figure 3
Figure 3. Expression of IDH2K413Q promotes a transformation permissive phenotype
(a) Fifty MCF7-shIDH2-IDH2WT, MCF7-shIDH2-IDH2K413R, or MCF7-shIDH2-IDH2K413Q cells were plated on a 6-well cell culture plate for 14 days before colonies were stained using crystal violet. (b) Quantification of colony numbers (n=4). (c) Two hundred and fifty MCF7-shSIRT3-PCDH, MCF7-shSIRT3-IDH2K413R and MCF7-shSIRT3-IDH2K413Q cells were plated on a 6-well cell culture plate for 14 days before colonies were stained using crystal violet. (d) Quantification of colony numbers (n=4). (e) Tumors from immunodeficient mice injected with five million MCF7-shIDH2-IDH2WT, MCF7-shIDH2-IDH2K413R, or MCF7-shIDH2-IDH2K413Q cells were harvested and weighed (n=5). (f) Tumor growth was measured starting at day six of tumor incidence (n=5). Results are the average of five biological replicates, and error bars represent one standard deviation. * indicates p<0.05, ** indicates p<0.01, comparing to WT by two-tailed unpaired t-test using Prism 6.0.
Figure 4
Figure 4. MCF7 cells expressing the acetylation mimic mutants exhibit altered mitochondrial energy and detoxification metabolism
(a–b) Glucose, oligomycin, and 2-deoxyglucose (2-DG) were sequentially added to measure extracellular acidification rates (ECAR) in the XF24 analyzer from Seahorse Bioscience (n=7). Glycolytic ECAR was determined by the difference between the ECAR after adding glucose and the ECAR after adding 2-DG. Glycolytic capacity was determined by the difference between the ECAR after adding oligomycin and the ECAR after adding 2-DG. (c) Total glutathione levels were measured in MCF7-shIDH2-IDH2WT, MCF7-shIDH2-IDH2K413R, or MCF7-shIDH2-IDH2K413Q cells (n=4). (d) MCF7 cells were transfected with IDH2WT, IDH2K413R and IDH2K413Q plasmids, trypsinized and resuspended before MitoSOXTM (2 μM) was added to the cells. The fluorescence representing mitochondrial superoxide was measured via flow cytometry (n=3). (e) Total glutathione levels of tumors from the immunodeficient mice were measured (n=4). Results are from three separate experiments. Error bars represent one standard deviation. * indicates p<0.05, ** indicates p<0.01, comparing to WT by two-tailed unpaired t-test using Prism 6.0.
Figure 5
Figure 5. IDH2-K413-Ac is correlated with breast cancer risk
(a–b) Slides containing Luminal A (n=17) or Luminal B (n=38) patient samples (Biomax) were stained using anti-IDH2-K413-Ac and anti-SIRT3 antibody. (c) Samples were separated into high SIRT3 (n=25) and low SIRT3 (n=30) groups, and IDH2K413 levels. (d) A representative image demonstrating IDH2K413 and SIRT3 staining in Luminal A and Luminal B cancer samples. (e) Summarized mechanism. The shaded boxes represent the interquartile range; whiskers represent min and max; bars represent the median. * indicates p<0.05, ** indicates p<0.01 by two-tailed unpaired t-test using Prism 6.0.

References

    1. Xu X, et al. Structures of human cytosolic NADP-dependent isocitrate dehydrogenase reveal a novel self-regulatory mechanism of activity. J Biol Chem. 2004;279(32):33946–33957. - PubMed
    1. Cupp JR, McAlister-Henn L. Kinetic analysis of NAD(+)-isocitrate dehydrogenase with altered isocitrate binding sites: contribution of IDH1 and IDH2 subunits to regulation and catalysis. Biochemistry. 1993;32(36):9323–9328. - PubMed
    1. Haselbeck RJ, McAlister-Henn L. Function and expression of yeast mitochondrial NAD- and NADP-specific isocitrate dehydrogenases. J Biol Chem. 1993;268(16):12116–12122. - PubMed
    1. Yu W, Dittenhafer-Reed KE, Denu JM. SIRT3 protein deacetylates isocitrate dehydrogenase 2 (IDH2) and regulates mitochondrial redox status. J Biol Chem. 2012;287(17):14078–14086. - PMC - PubMed
    1. Lombard DB, Zwaans BM. SIRT3: As Simple As It Seems. Gerontology 2013 - PMC - PubMed