. 2017 May 23;7(1):2301.
doi: 10.1038/s41598-017-02607-1.

Circulating microRNA-214 and -126 as potential biomarkers for canine neoplastic disease

Affiliations

Circulating microRNA-214 and -126 as potential biomarkers for canine neoplastic disease

Kazuki Heishima et al. Sci Rep. .

Abstract

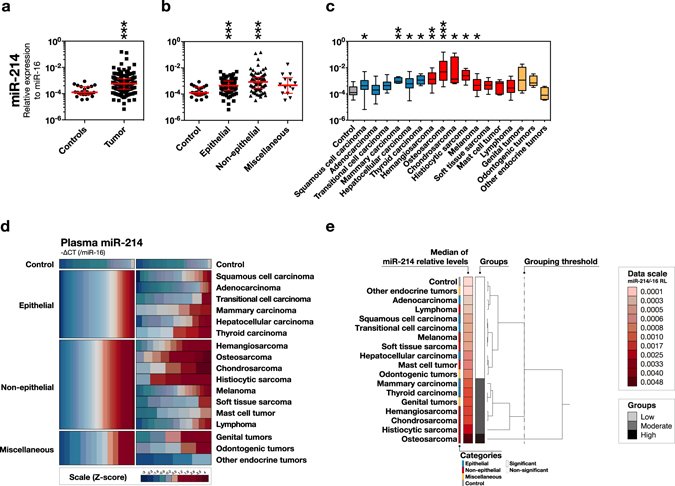
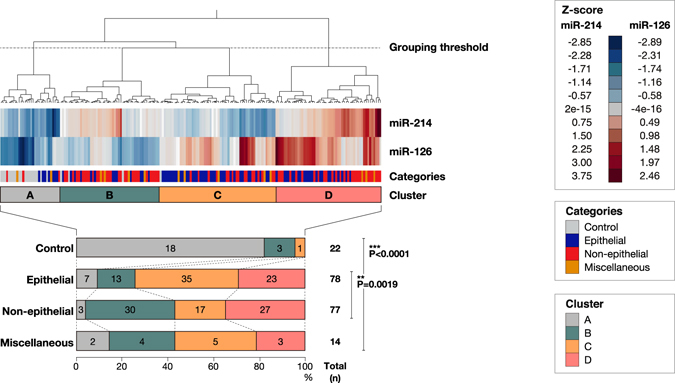
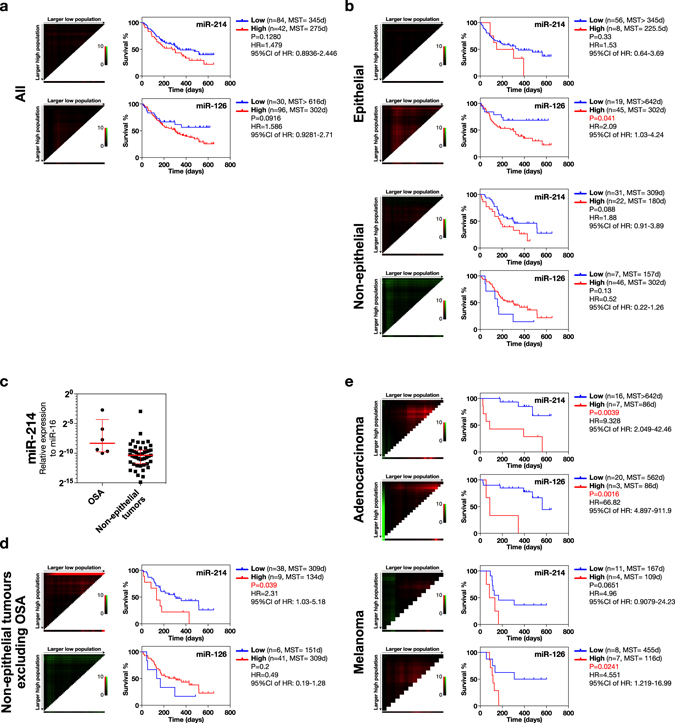
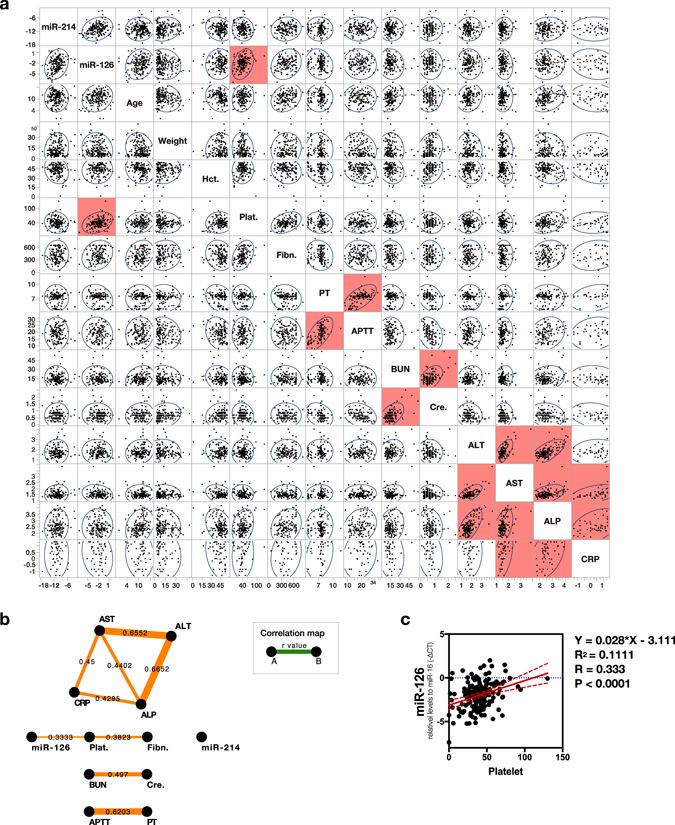
Circulating microRNAs in the blood may provide diagnostic and prognostic information about canine neoplastic diseases, and their profiles may be conserved between human and canine species. We performed RT-qPCR to obtain the profiles of circulating plasma microRNA-214 and -126 in total 181 cases of canine neoplastic diseases and healthy controls. MicroRNA-214 levels were high in 2 epithelial tumours (thyroid and mammary carcinomas) and 4 non-epithelial tumours (osteosarcoma, histiocytic sarcoma, chondrosarcoma, and hemangiosarcoma). In contrast, microRNA-126 levels were high in 6 epithelial tumours (mammary, hepatocellular, squamous cell, thyroid, transitional cell carcinomas, and adenocarcinoma) and 4 non-epithelial tumours (osteosarcoma, mast cell tumour, melanoma, and hemangiosarcoma). The diagnostic potential of microRNA-214 was relatively high in sarcomas, whereas that of microR-126 was high in most types of the tumours. MicroRNA-214 and -126 were prognostic predictors in 2 groups (adenocarcinoma and non-epithelial tumours except for osteosarcoma) and 3 groups (epithelial tumours, adenocarcinoma, and melanoma), respectively. Additionally, the microRNA levels did not show a strong correlation with the other clinical parameters. In conclusion, circulating microRNA-214 and -126 have the potential to be diagnostic and prognostic biomarkers for canine neoplastic diseases. Furthermore, their profiles may be key references as well for exploring novel biomarkers for human cancers.


Conflict of interest statement

The authors declare that they have no competing interests.

Figures

Figure 1
Figure 1
Summarised characteristics of the dogs used in this study. No obvious bias was observed with respect to age, weight, or gender of the dogs enrolled in this study. (a) Summary and case counts of the total 191 dogs enrolled into this study. Samples were categorised into 4 categories and 17 subcategories. (b) Classification used in this study for non-epithelial tumours (c) Swarm plot of ages (years) for the 4 categories (Kruskal-Wallis test). (d) Swarm plot of ages (years) between subcategories (Kruskal-Wallis test). (e) Swarm plot of weights (kg) between 4 categories. (Kruskal-Wallis test) (f) Swarm plot of weights (kg) between subcategories. (Kruskal-Wallis test) (g) Genders of 4 categories (Chi-square Test). (h) Genders of subcategories. Only mammary carcinoma cases had no male ones. Statistical analysis was not available (N/A) due to the limited number of cases in the subcategories to calculate an appropriate P-value by use of the Chi-square test. M, male; CM, castrated male; F, female; SF, spayed female.
Figure 2
Figure 2
Circulating miR-214 profiles for canine tumours. Circulating miR-214 levels (−∆CT, relative to circulating miR-16 levels) were mainly increased in non-epithelial tumours, especially the sarcomas. (a) Swarm plot of circulating miR-214 levels comparing tumour and control. ***P < 0.001 (Mann-Whitney U test) (b) Swarm plot of circulating miR-214 levels comparing the groups of epithelial, non-epithelial, miscellaneous tumours, and controls. *P < 0.05, ***P < 0.001 (Steel’s Test) (c) Box plot of circulating miR-214 levels comparing the subcategories. *P < 0.05, **P < 0.01, ***P < 0.001 (Steel’s Test). (d) Heatmap overview of circulating miR-214 levels. (e) Hierarchical cluster analysis of circulating miR-214 levels. The representative values used were the medians of miR-214 levels. The dendrogram was illustrated by Ward’s method, and categorised into 3 groups based on the indicated threshold.
Figure 3
Figure 3
Profile of circulating miR-126 for canine tumours. Circulating miR-126 levels (-∆CT, relative to circulating miR-16 levels) were high in most of the tumour types. (a) Swarm plot of circulating miR-126 levels comparing tumour and controls. ***P < 0.001 (Mann-Whitney U test) (b) Swarm plot of circulating miR-126 levels comparing the groups of epithelial, non-epithelial, miscellaneous tumours, and controls. ***P < 0.001 (Steel’s Test) (c) Box plot of circulating miR-126 levels comparing the subcategories. *P < 0.05, **P < 0.01, ***P < 0.001 (Steel’s Test). (d) Heatmap overview of circulating miR-126 levels. (e) Hierarchical cluster analysis of circulating miR-126 levels. The representative values used were the medians of miR-126 levels. The dendrogram was illustrated by Ward’s method, and categorised into 3 groups based on the indicated threshold.
Figure 4
Figure 4
Heatmap and hierarchical cluster analysis of circulating miR-214 and -126 levels. Levels of circulating miR-214 and -126, showing different profiles between epithelial and non-epithelial groups. Heatmap and dendrogram were illustrated by Ward’s method using JMP software version 12.3. Samples were classified into 4 clusters based on the indicated threshold line. Relative levels (−∆CT, relative to circulating miR-16) were normalised by the Z-score. Statistical significance between each category was calculated by the Chi-square test (**P < 0.01, ***P < 0.001).
Figure 5
Figure 5
Diagnostic accuracies of circulating miR-214 and -126. Circulating miR-214 and -126 discriminated tumour from control cases with high accuracies. (a) ROC curve analysis of circulating miR-214 and -126 in the case of all types of tumours: epithelial, non-epithelial tumours, sarcomas (hemangiosarcoma, osteosarcoma, chondrosarcoma, histiocytic sarcoma, and soft tissue sarcoma), and aggressive sarcomas (hemangiosarcoma, osteosarcoma, histiocytic sarcoma). Blue lines and red dotted lines indicate the results of circulating miR-214 and miR-126, respectively. The numbers shown under the lines indicate the AUC value of each data set. (b) Summary of the AUC values from ROC curve analysis. Error bars indicate the standard error of each mean. P-values were calculated by using an unpaired two-tailed student’s T-test (***P < 0.0001). The null hypothesis was that the calculated AUC value was 0.5. (c) Specificities and sensitivities of circulating miR-214 and -126 at the optimal cut-offs. Each optimal cut-off was determined by using the Youden index. (d) The combined use of circulating miR-214 and -126 improved the diagnostic accuracies and sensitivities in each group. P-values were calculated by performing a chi-square test (***P < 0.0001).
Figure 6
Figure 6
Survival analysis using Kaplan-Meier survival curve and X-tile plot. The cases with high levels of circulating miR-214 showed significantly shorter survival time in the cases of adenocarcinoma and the non-epithelial tumours without osteosarcoma. The cases with high levels of circulating miR-126 showed significantly shorter survival times in the cases of epithelial tumours, adenocarcinoma, and melanoma. (a) Survival times between the cases with high- and low-circulating miR-214 and -126 in the group including all types of tumours. (b) Survival times between the cases with high- and low-circulating miR-214 and -126 levels for the epithelial and the non-epithelial tumours. (c) Comparison of the levels of circulating miR-214 between osteosarcomas (OSA) and the other non-epithelial tumours. (d) Survival times between the cases with high- and low-circulating miR-214 and -126 levels for the non-epithelial tumours excluding osteosarcomas. (e) Survival times between the cases with high- and low-circulating miR-214 and -126 levels for adenocarcinomas and melanomas. All MST values (days) were calculated from the analysis using Kaplan-Meier survival curves. The optimal cut-offs to determine the groups of high- and low-miRNA levels were calculated by use of the X-tile plot. The hazard ratios and P-values were calculated by using the Log-rank test.
Figure 7
Figure 7
Correlation analysis between the circulating miR-214, -126 levels, and various clinical parameters. Circulating miR-214 and -126 levels did not show a strong correlation with the other clinical parameters. (a) Multivariate correlation analysis using scatter plots for circulating miR-214, -126 levels, age, weight, Hct., Plat., Fibn., PT, APTT, BUN, Cre., ALT, AST, ALP, and CRP. Blue circles indicate trends of scatter points. Areas given in red indicate that the 2 parameters show a significant correlation (P < 0.05, Pearson product-moment correlation coefficient). (b) Map for correlation between the parameters. The correlations between parameters connected to each other with bands are indicated. R-values are displayed in the centre between 2 parameters, and band thickness represents the degree of correlation. R-values only with statistical significance are illustrated on the map. (c) Linear regression analysis for platelet counts and circulating miR-126 levels. P-value was calculated based on the null hypothesis that the slope of the regression curve is 0.

Similar articles

Cited by

References

    1. Benchimol S, Fuks A, Jothy S, Beauchemin N. Carcinoembryonic antigen, a human tumor marker, functions as an intercellular adhesion molecule. Cell. 1989;57:327–334. doi: 10.1016/0092-8674(89)90970-7. - DOI - PubMed
    1. Sato Y, et al. Early recognition of hepatocellular carcinoma based on altered profiles of alpha-fetoprotein. N Engl J Med. 1993;328:1802–1806. doi: 10.1056/NEJM199306243282502. - DOI - PubMed
    1. Selting KA, Sharp CR, Ringold R, Knouse J. Serum thymidine kinase 1 and C-reactive protein as biomarkers for screening clinically healthy dogs for occult disease. Vet Comp Oncol. 2015;13:373–384. doi: 10.1111/vco.12052. - DOI - PubMed
    1. Khanna C, et al. The dog as a cancer model. Nat Biotechnol. 2006;24:1065–1066. doi: 10.1038/nbt0906-1065b. - DOI - PubMed
    1. Pinho SS, Carvalho S, Cabral J, Reis CA, Gartner F. Canine tumors: a spontaneous animal model of human carcinogenesis. Transl Res. 2012;159:165–172. doi: 10.1016/j.trsl.2011.11.005. - DOI - PubMed