. 2017 May 9:11:133.
doi: 10.3389/fncel.2017.00133. eCollection 2017.

Thyroid Hormone Induces PGC-1α during Dendritic Outgrowth in Mouse Cerebellar Purkinje Cells

Affiliations

Thyroid Hormone Induces PGC-1α during Dendritic Outgrowth in Mouse Cerebellar Purkinje Cells

Tetsu Hatsukano et al. Front Cell Neurosci. .

Abstract

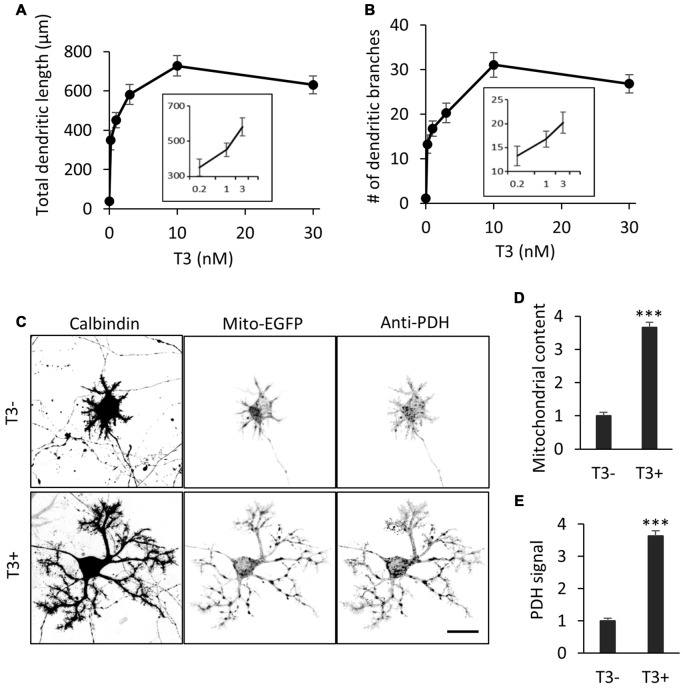
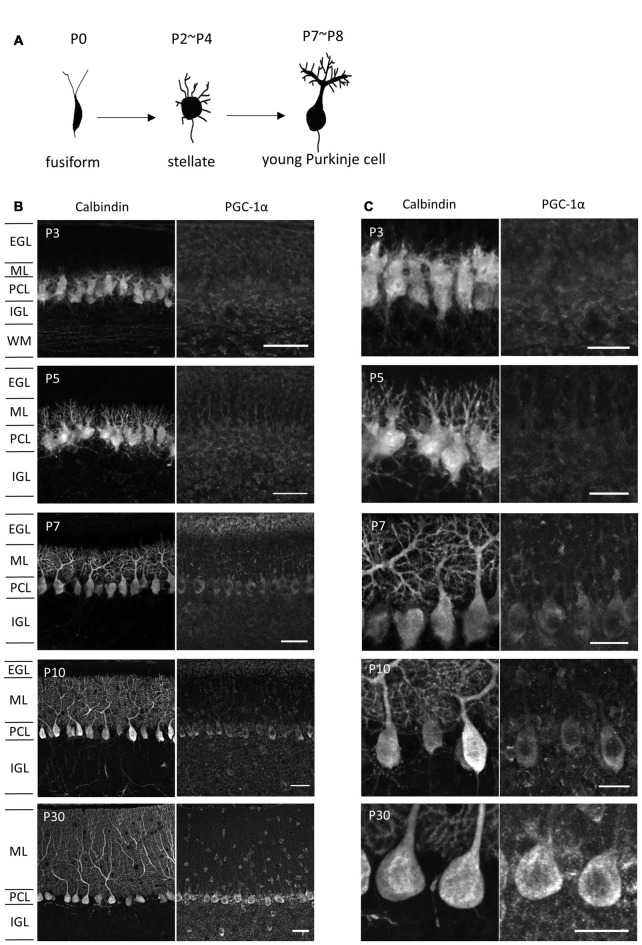
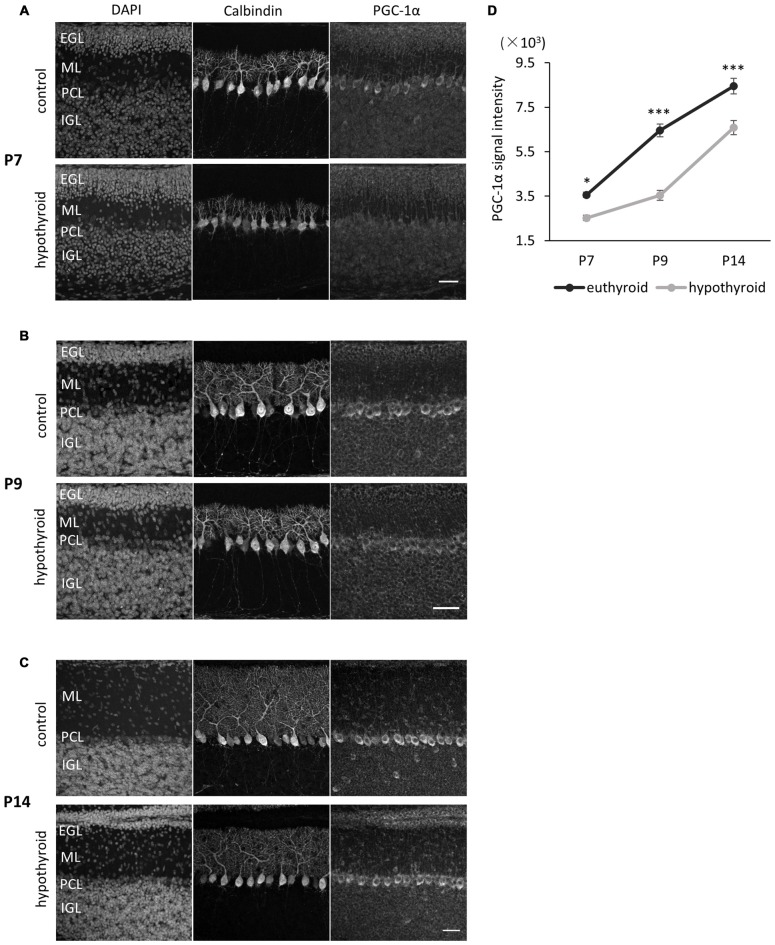
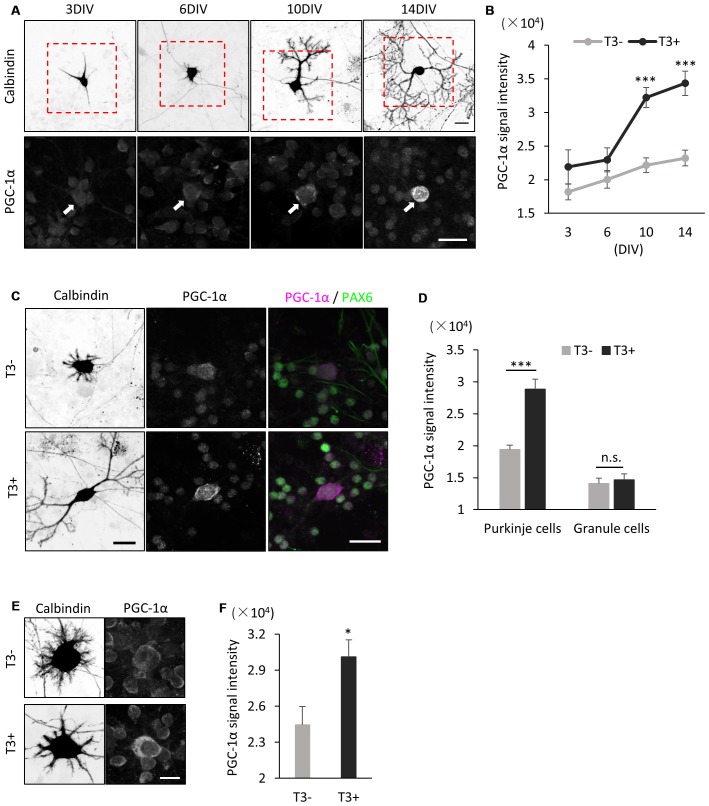
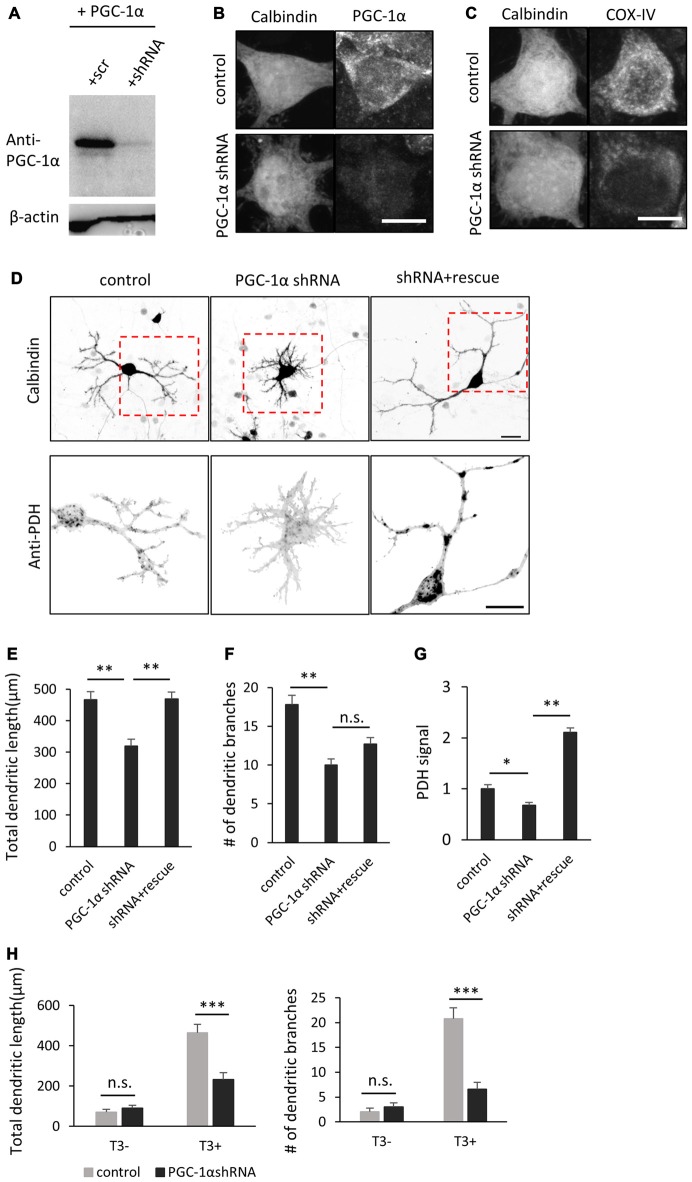
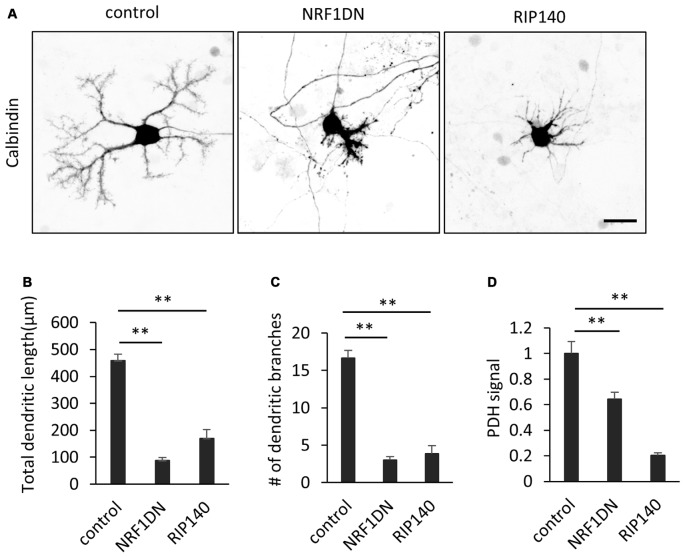
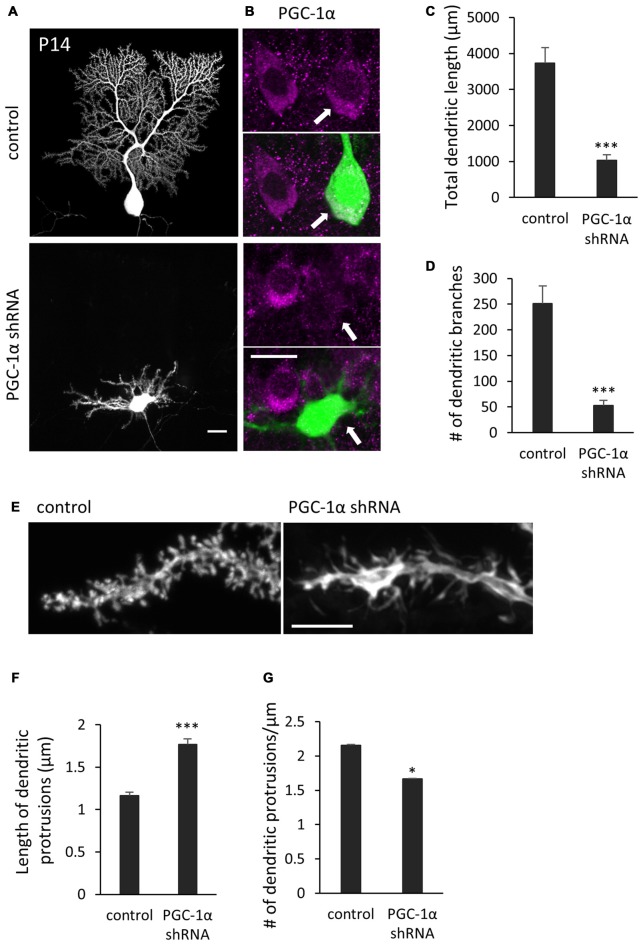
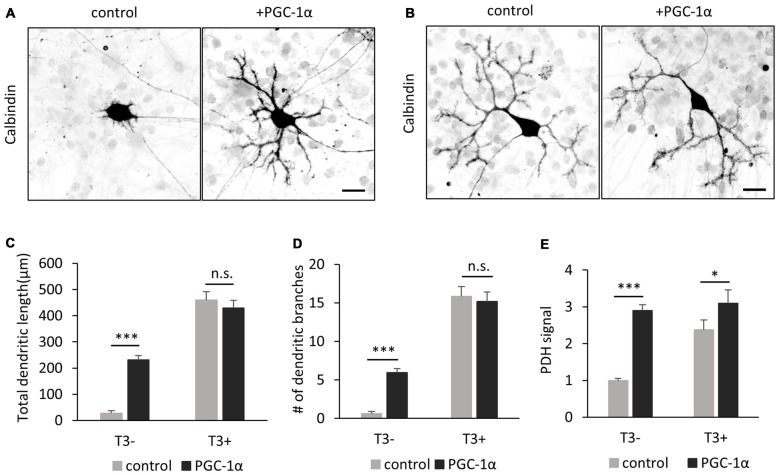
Thyroid hormone 3,3',5-Triiodo-L-thyronine (T3) is essential for proper brain development. Perinatal loss of T3 causes severe growth defects in neurons and glia, including strong inhibition of dendrite formation in Purkinje cells in the cerebellar cortex. Here we show that T3 promotes dendritic outgrowth of Purkinje cells through induction of peroxisome proliferator-activated receptor gamma (PPARγ) co-activator 1α (PGC-1α), a master regulator of mitochondrial biogenesis. PGC-1α expression in Purkinje cells is upregulated during dendritic outgrowth in normal mice, while it is significantly retarded in hypothyroid mice or in cultures depleted of T3. In cultured Purkinje cells, PGC-1α knockdown or molecular perturbation of PGC-1α signaling inhibits enhanced dendritic outgrowth and mitochondrial generation and activation caused by T3 treatment. In contrast, PGC-1α overexpression promotes dendrite extension even in the absence of T3. PGC-1α knockdown also downregulates dendrite formation in Purkinje cells in vivo. Our findings suggest that the growth-promoting activity of T3 is partly mediated by PGC-1α signaling in developing Purkinje cells.

Keywords: PGC-1α; Purkinje cell; dendritogenesis; hypothyroid; mitochondria; thyroid hormone.


Figures

Figure 1
Figure 1
3,3′,5-Triiodo-L-thyronine (T3) enhances mitochondrial biogenesis and dendritic outgrowth in cerebellar Purkinje cells. Primary cerebellar cell cultures prepared from P0 mice were incubated for 10 days in the absence or presence of different concentrations of T3. The morphology of Purkinje cells was visualized by immunostaining with anti-Calbindin. (A,B) Dose-dependent effects of T3 on total length (A) and branch number (B) of Purkinje cell dendrites at 10 DIV. (C) Purkinje cells were labeled with adeno-associated viruses (AAV)-Mito-EGFP to visualize mitochondria and cultured with or without 10 nM T3. Cells were costained with anti-Calbindin and anti-pyruvate dehydrogenase (PDH) antibodies. Scale bar, 20 μm. (D,E) Quantification of mitochondrial content (D) and PDH expression (E) in Purkinje cells with or without T3 treatment. Signal intensity was normalized to the value of cells in the T3-deficient (T3-) condition. N = 30 for all data points. Data represent mean ± SEM; ***p < 0.001, Student’s t test.
Figure 2
Figure 2
PGC-1α expression in the developing cerebellar cortex. (A) Shape changes of Purkinje cell dendrites during postnatal development. (B,C) Sagittal cerebellar sections were immunostained for PGC-1α and Calbindin at different ages of development and were observed at low (B) and high (C) magnification. Scale bars, 40 μm (B) and 20 μm (C). PGC-1α was predominantly detected in the Purkinje cells from P7. EGL, external granule layer; ML, molecular layer; PCL, Purkinje cell layer; IGL, internal granule layer; WM, white matter.
Figure 3
Figure 3
PGC-1α expression in Purkinje cells is downregulated in hypothyroid mice. (A–C) PGC-1α expression was compared at P7 (A), P9 (B) and P14 (C). Representative images from four mice in each condition are shown. Dendritic growth of Purkinje cells is retarded in the hypothyroid condition. At P14 (C), the EGL is thicker in hypothyroid animals compared to control animals. Each section was immunostained with anti-Calbindin and anti-PGC-1α. DNA was counterstained with 4′,6-diamidino-2-phenylindole (DAPI). Scale bars, 40 μm. (D) Quantitative comparison of PGC-1α expression in Purkinje cells in control (euthyroid) and hypothyroid animals. Data represent mean ± SEM, N = 15 cells from four mice from two independent experiments for each points, *p < 0.05, ***p < 0.001, two-way analysis of variances (ANOVA) with Tukey’s HSD post hoc analysis.
Figure 4
Figure 4
PGC-1α expression is induced in cultured Purkinje cells by T3 treatment. (A) Cerebellar cells were cultured in the presence of 10 nM T3 and then immunostained with anti-Calbindin and PGC-1α at the indicated day in culture. Boxed regions in the upper panels are enlarged in lower panels. PGC-1α expression is gradually increased in Purkinje cells (arrows) from 6 DIV. Scale bars, 20 μm. (B) Quantitative comparison of PGC-1α expression in Purkinje cells cultured with (black dots and line) or without (gray dots and line) T3. Data represent mean ± SEM, N = 15 cells for each points, ***p < 0.001, two-way ANOVA with Tukey’s HSD post hoc analysis. (C) Dissociated cerebellar cells were cultured with or without T3 treatment and immunostained for Calbindin, Pax-6 and PGC-1α at 10 DIV. Scale bars, 20 μm. (D) Quantitative comparison of PGC-1α expression in Purkinje cells and granule cells cultured with or without T3. (E,F) Immunofluorescent images (E) and quantitative comparison (F) of PGC-1α expression in Purkinje cells treated with or without T3 for 24 h. Scale bar, 10 μm. (D,F) The average pixel intensities of PGC-1α signals in the cell soma were measured. Mean ± SEM, N = 15 for each point, *p < 0.05, ***p < 0.001, Student’s t test.
Figure 5
Figure 5
PGC-1α knockdown inhibits T3-induced dendritic growth in Purkinje cells. (A) HEK293T cells expressing mouse PGC-1α were transfected with PGC-1α-scramble (scr) or short hairpin RNA (shRNA) construct and analyzed by western blotting with anti-PGC-1α and anti-β-actin antibodies. (B,C) Cultured Purkinje cells were transfected with PGC-1α-shRNA or scr-shRNA (control) constructs and stained for Calbindin and PGC-1α (B) or Calbindin and cytochrome C oxidase IV (COX-IV) (C) at 10 DIV. Scale bars, 10 μm. (D) Representative images of Purkinje cells transfected with scr shRNA (control), PGC-1α shRNA (PGC-1α shRNA), or PGC-1α shRNA plus an shRNA-resistant mutant of PGC-1α (shRNA + rescue). Cells were cultured in the presence of 10 nM T3 until 10 DIV and immunostained with anti-Calbindin and anti-PDH antibodies. Boxed regions in the upper panels are enlarged in lower panels. Scale bars, 20 μm. (E–G) Quantitative analyses of the total dendritic length (E), number of dendritic branches (F) and PDH signal (G). Data represent mean ± SEM, N = 30 for each point, **p < 0.01 and *p < 0.05, one-way ANOVA with Tukey’s HSD post hoc analysis. (H) Quantification of the effects of PGC-1α knockdown on Purkinje cells morphology in the presence or absence of T3. Mean ± SEM, N = 15 for each point, ***p < 0.001, Student’s t test.
Figure 6
Figure 6
Molecular perturbation of PGC-1α inhibits dendritic outgrowth and mitochondrial activity in Purkinje cells. (A) Representative images of Purkinje cells overexpressing EGFP (control), EGFP-NRF1DN or FLAG-RIP140. Cells were stained for Calbindin at 10 DIV. Scale bar, 20 μm. (B–D) Quantitative analyses of the total dendritic length (B), number of dendritic branches (C) and PDH signal (D). N = 40 cells for control, 30 cells for NRF1DN and 30 cells for RIP140. Data represent mean ± SEM, **p < 0.01, one-way ANOVA followed by Tukey Kramer HSD tests.
Figure 7
Figure 7
Knockdown of PGC-1α inhibits dendritic outgrowth in vivo Purkinje cells. (A) Representative images of Purkinje cells transfected with scr shRNA (control) or PGC-1α shRNA construct. Scale bar, 20 μm. (B) Dual color images of GFP derived from shRNA constructs (green) and immunostaining with anti-PGC-1α (magenta). Scale bar, 20 μm. (C,D) Quantitative analyses of the total dendritic length (C) and number of dendritic branches (D) in Purkinje cells expressing scr shRNA (control) or PGC-1α shRNA constructs. Data represent mean ± SEM, N = 12 cells from three mice, ***p < 0.001, Student’s t test. (E) Representative images of distal dendrites of Purkinje cells expressing scr shRNA (control) and PGC-1α shRNA. Scale bar, 5 μm. (F,G) The length (F) and number (G) of dendritic protrusions in the Purkinje cells expressing scr shRNA (control) or PGC-1α shRNA (shRNA). Data represent mean ± SEM, N = 200 (control) and N = 259 (shRNA). Twelve cells from three mice were analyzed for each group. Data represent mean ± SEM, ***p < 0.001, *p < 0.05, Student’s t test.
Figure 8
Figure 8
PGC-1α overexpression enhances dendritic outgrowth of Purkinje cells in the absence of T3. (A,B) The morphology of Purkinje cells transfected with tdTomato (control) or PGC-1α-mCherry (+PGC-1α). Cells were cultured with (B) or without (A) T3 and stained for Calbindin at 10 DIV. Scale bars, 20 μm. PGC-1α overexpression induced dendritic outgrowth in the absence of T3 (A), but not in the presence of T3 (B). (C–E) Quantitative analyses of total dendritic length (C) branch numbers (D) and PDH signal (E). Purkinje cells expressing tdTomato (control) or PGC-1α were cultured with or without T3 treatment. N = 30 for all data points. Data represent mean ± SEM, ***p < 0.001 and *p < 0.05, Student’s t test.

Similar articles

Cited by

References

    1. Anderson G. W. (2001). Thyroid hormones and the brain. Front. Neuroendocrinol. 22, 1–17. 10.1006/frne.2000.0208 - DOI - PubMed
    1. Armengol J. A., Sotelo C. (1991). Early dendritic development of Purkinje cells in the rat cerebellum. A light and electron microscopic study using axonal tracing in “in vitro” slices. Dev. Brain Res. 64, 95–114. 10.1016/0165-3806(91)90213-3 - DOI - PubMed
    1. Bernal J. (2007). Thyroid hormone receptors in brain development and function. Nat. Clin. Pract. Endocrinol. Metab. 3, 249–259. 10.1038/ncpendmet0424 - DOI - PubMed
    1. Boukhtouche F., Brugg B., Wehrlé R., Bois-Joyeux B., Danan J.-L., Dusart I., et al. . (2010). Induction of early Purkinje cell dendritic differentiation by thyroid hormone requires RORα. Neural Dev. 5:18. 10.1186/1749-8104-5-18 - DOI - PMC - PubMed
    1. Boukhtouche F., Janmaat S., Vodjdani G., Gautheron V., Mallet J., Dusart I., et al. . (2006). Retinoid-related orphan receptor α controls the early steps of purkinje cell dendritic differentiation. J. Neurosci. 26, 1531–1538. 10.1523/JNEUROSCI.4636-05.2006 - DOI - PMC - PubMed