. 2017 May 9:8:795.
doi: 10.3389/fmicb.2017.00795. eCollection 2017.

Comparative Proteomic Analysis of Mycobacterium tuberculosis Lineage 7 and Lineage 4 Strains Reveals Differentially Abundant Proteins Linked to Slow Growth and Virulence

Affiliations

Comparative Proteomic Analysis of Mycobacterium tuberculosis Lineage 7 and Lineage 4 Strains Reveals Differentially Abundant Proteins Linked to Slow Growth and Virulence

Solomon A Yimer et al. Front Microbiol. .

Abstract

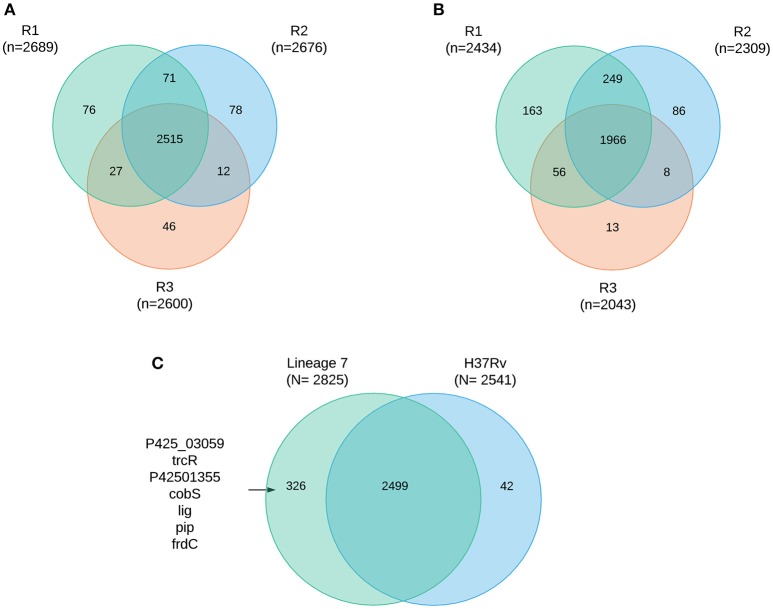
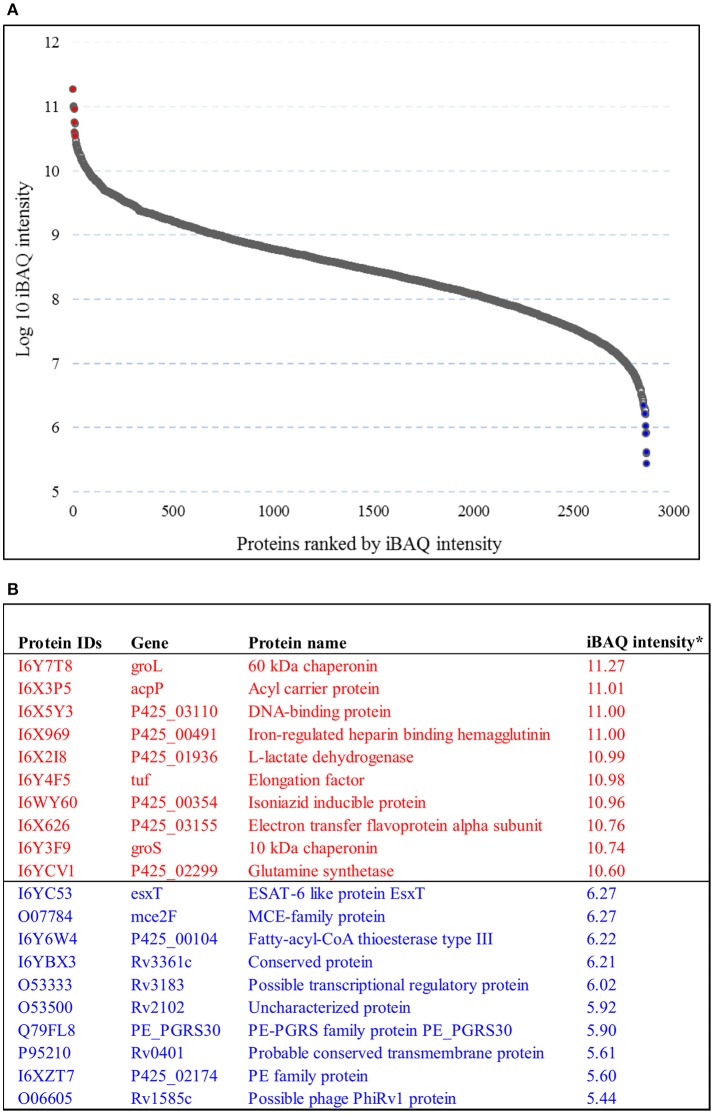
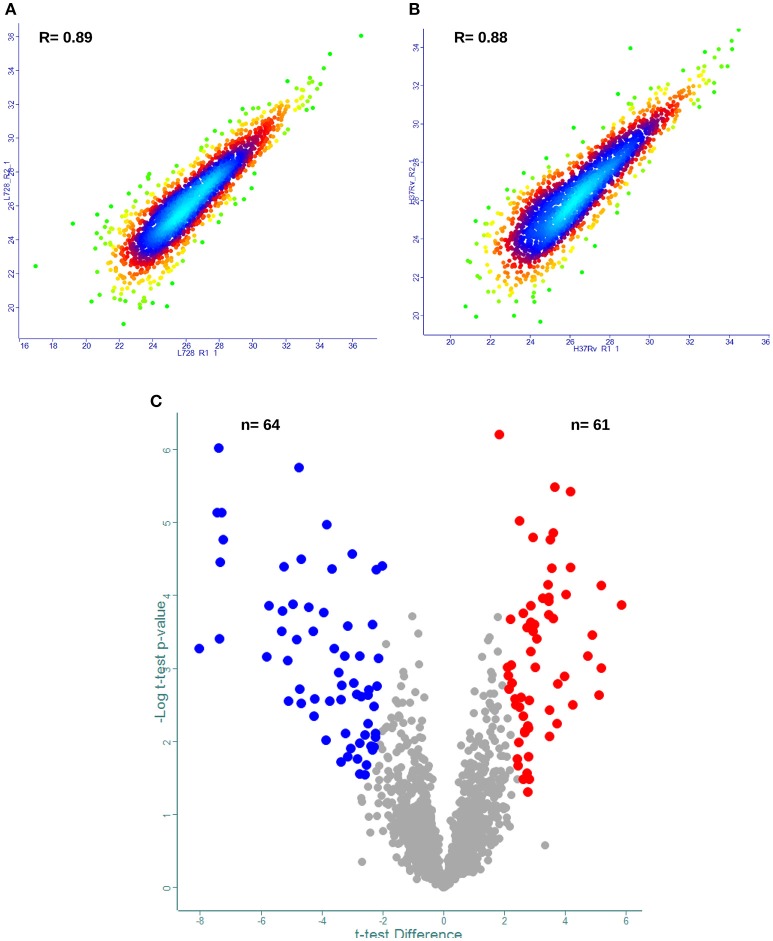
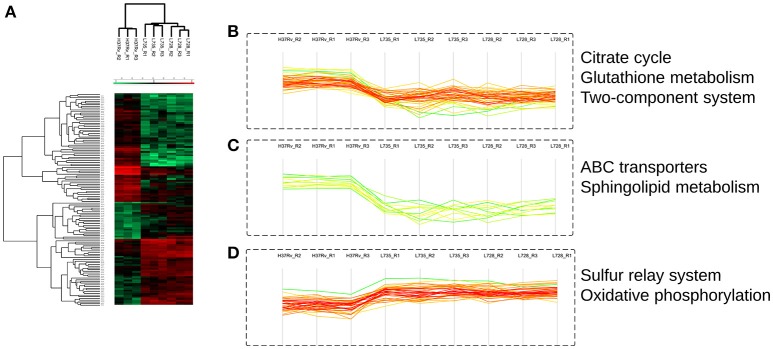
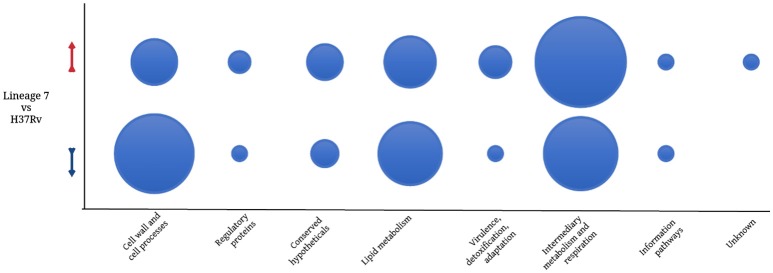
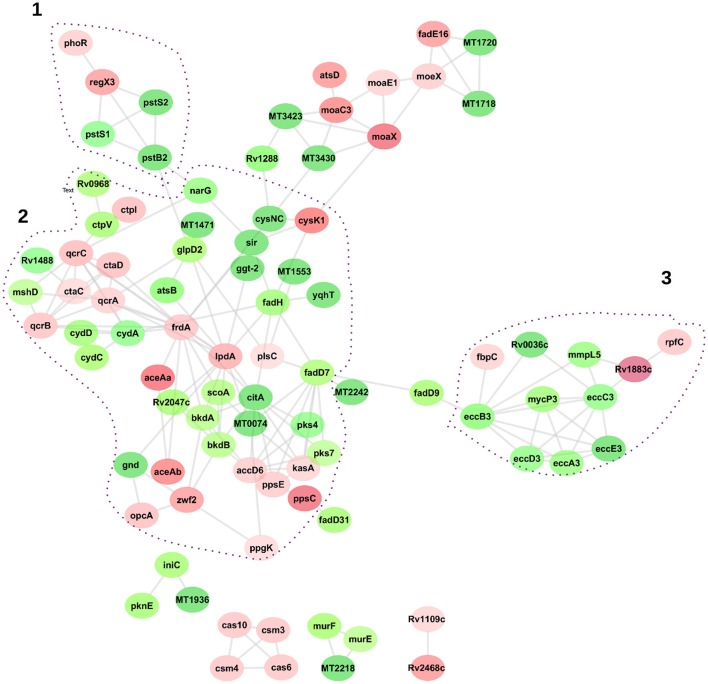
In order to decipher the nature of the slowly growing Mycobacterium tuberculosis (M.tuberculosis) lineage 7, the differentially abundant proteins in strains of M. tuberculosis lineage 7 and lineage 4 were defined. Comparative proteomic analysis by mass spectrometry was employed to identify, quantitate and compare the protein profiles of strains from the two M. tuberculosis lineages. Label-free peptide quantification of whole cells from M. tuberculosis lineage 7 and 4 yielded the identification of 2825 and 2541 proteins, respectively. A combined total of 2867 protein groups covering 71% of the predicted M. tuberculosis proteome were identified. The abundance of 125 proteins in M. tuberculosis lineage 7 and 4 strains was significantly altered. Notably, the analysis showed that a number of M. tuberculosis proteins involved in growth and virulence were less abundant in lineage 7 strains compared to lineage 4. Five ABC transporter proteins, three phosphate binding proteins essential for inorganic phosphate uptake, and six components of the type 7 secretion system ESX-3 involved in iron acquisition were less abundant in M. tuberculosis lineage 7. This proteogenomic analysis provided an insight into the lineage 7-specific protein profile which may provide clues to understanding the differential properties of lineage 7 strains in terms of slow growth, survival fitness, and pathogenesis.

Keywords: Ethiopia; Mycobacterium tuberculosis; lineage 7; mass spectrometry; proteomics; tuberculosis; type 7 secretion.


Figures

Figure 1
Figure 1
Protein coverage Venn plot illustrating protein identification overlaps among the three biological replicates (R1–R3) in M. tuberculosis lineage 7 (A) and in lineage 4 (B) isolates, (C) overlap of protein identification between lineages and some of the mutually exclusively identified proteins.
Figure 2
Figure 2
Protein dynamic range estimation. (A) Combined intensity based absolute quantification (iBAQ) values for the 2,825 proteins were plotted with log10 iBAQ intensity on the y axis, and proteins were ranked by iBAQ intensity on the x axis. The plot shows a dynamic range of 6 orders of magnitude. (B) List of the ten most (colored red) and 10 least (colored blue) abundant proteins based on iBAQ intensity.
Figure 3
Figure 3
Label free proteome quantification of Mycobacterium tuberculosis lineages. Quantitative analysis was performed using the MaxQuant and Perseus software environments as described in the method section. Reproducibility of the analytic workflow for biological replicates was assessed by Pearson correlation coefficients (R-values). (A,B) Represent density scatter plot of peptide intensities for biological replicates of M. tuberculosis lineage 7 and lineage 4, respectively. (C) volcano plot of protein abundance differences as a function of statistical significance (t-test p ≤ 0.05 and fold change cutoff point ±2) between lineage 7 and lineage 4 isolates. Y-axis indicates p-value (−log10). X-axis shows protein ratio (x-axis) in lineage 7 vs. lineage 4 stains. The color code indicates upregulation (red) and downregulation (blue). Proteins with no statistically significant difference in abundances between the two lineages are shown in gray.
Figure 4
Figure 4
Quantitative proteomics analysis reveals distinct pattern of M. tuberculosis differentially abundant proteins that are involved in several important pathways. (A) Unsupervised hierarchical clustering representing the T-test significant proteins (n = 125). Color code indicates the normalized median abundance of the proteins belonging to the category (red more abundant; green less abundant). (B–D) Representative clusters of significantly enriched KEGG pathways.
Figure 5
Figure 5
Bubble plot comparing the number of M. tuberculosis differentially abundant proteins in each functional category. Red arrow denotes upregulation and the blue arrow indicates downregulation. Functional categorization was performed according to TubercuList v 2.6 (http://tuberculist.epfl.ch/).
Figure 6
Figure 6
Network interaction analysis of differentially abundant proteins related to M. tuberculosis lineages 7 and 4. Graphical representation of the interaction was generated by the Cytoscape software version 3.4. Proteins are represented as nodes, and the biological relationship between two nodes is represented as an edge (line). The intensity of the node color indicates the increased (red) or decreased (green) abundance according to fold changes. Dot-lined circles indicate sub-networks of proteins linked to specific KEGG pathways.

References

    1. Albanna A. S., Reed M. B., Kotar K. V., Fallow A., McIntosh F. A., Behr M. A., et al. . (2011). Reduced transmissibility of East African Indian strains of Mtb. PLoS ONE 6:e25075. 10.1371/journal.pone.0025075 - DOI - PMC - PubMed
    1. Alland D., Steyn A. J., Weisbrod T., Aldrich K., Jacobs W. R. (2000). Characterization of the Mycobacterium tuberculosis iniBAC promoter, a promoter that responds to cell wall biosynthesis inhibition. J. Bacteriol. 182, 1802–1811. 10.1128/JB.182.7.1802-1811.2000 - DOI - PMC - PubMed
    1. Assenov Y., Ramírez F., Schelhorn S. E., Lengauer T., Albrecht M. (2008). Computing topological parameters of biological networks. Bioinformatics 24, 282–284. 10.1093/bioinformatics/btm554 - DOI - PubMed
    1. Azuaje F., Devaux Y., Wagner D. R. (2010). Coordinated modular functionality and prognostic potential of a heart failure biomarker-driven interaction network. BMC Syst. Biol. 4:60. 10.1186/1752-0509-4-60. - DOI - PMC - PubMed
    1. Bader G. D., Hogue C. W. (2003). An automated method for finding molecular complexes in large protein interaction networks. BMC Bioinform. 4:2. 10.1186/1471-2105-4-2 - DOI - PMC - PubMed

LinkOut - more resources