. 2017 May 9:8:743.
doi: 10.3389/fpls.2017.00743. eCollection 2017.

Molecular Characterization and Expression Profiling of Brachypodium distachyon L. Cystatin Genes Reveal High Evolutionary Conservation and Functional Divergence in Response to Abiotic Stress

Affiliations

Molecular Characterization and Expression Profiling of Brachypodium distachyon L. Cystatin Genes Reveal High Evolutionary Conservation and Functional Divergence in Response to Abiotic Stress

Saminathan Subburaj et al. Front Plant Sci. .

Abstract

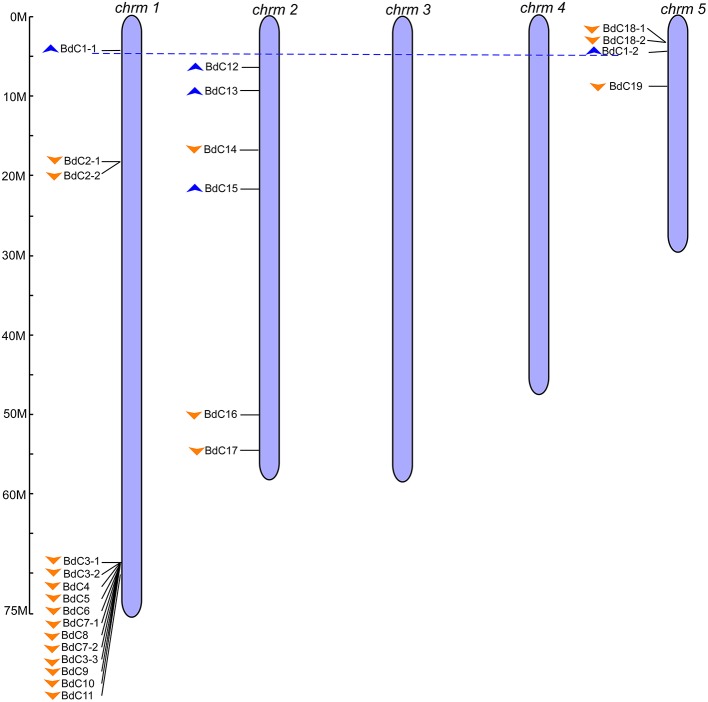
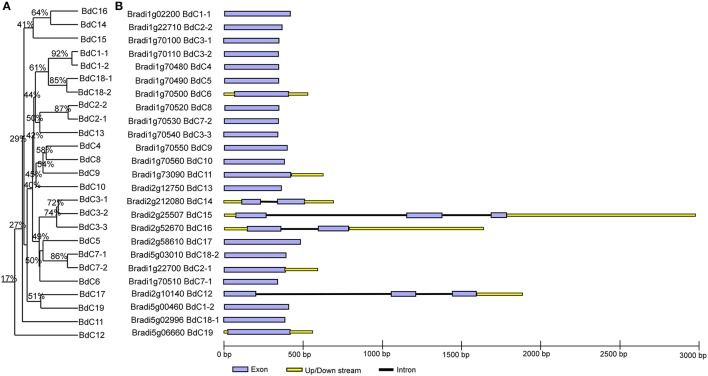
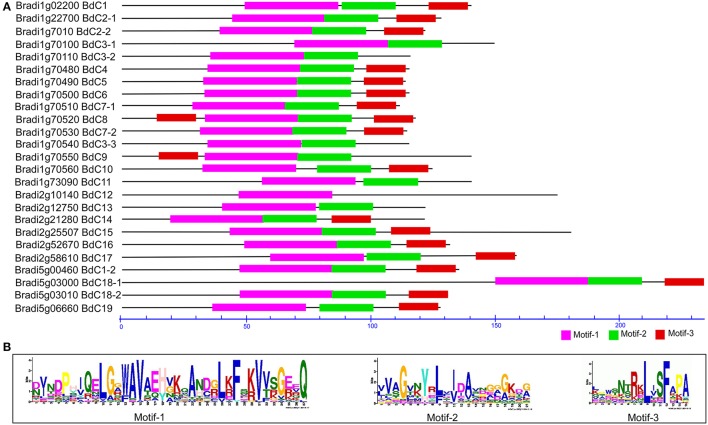
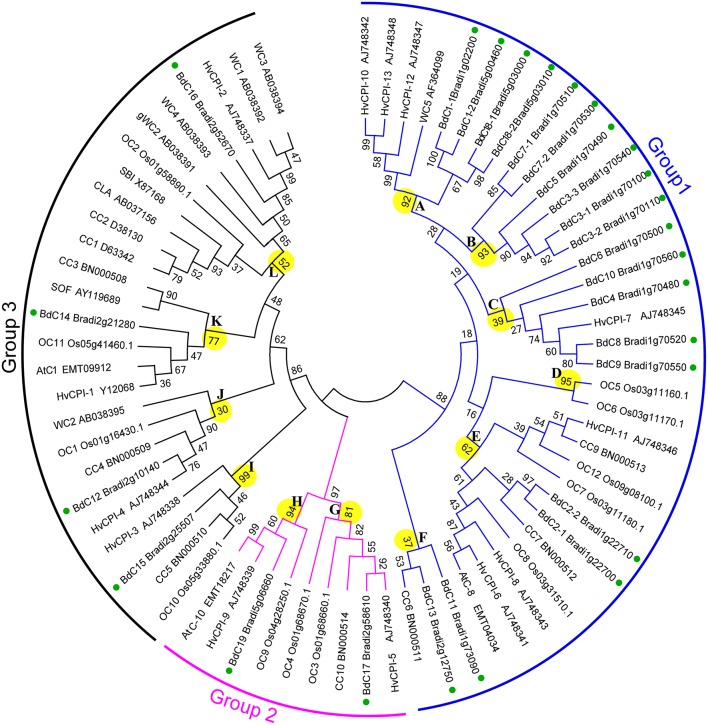
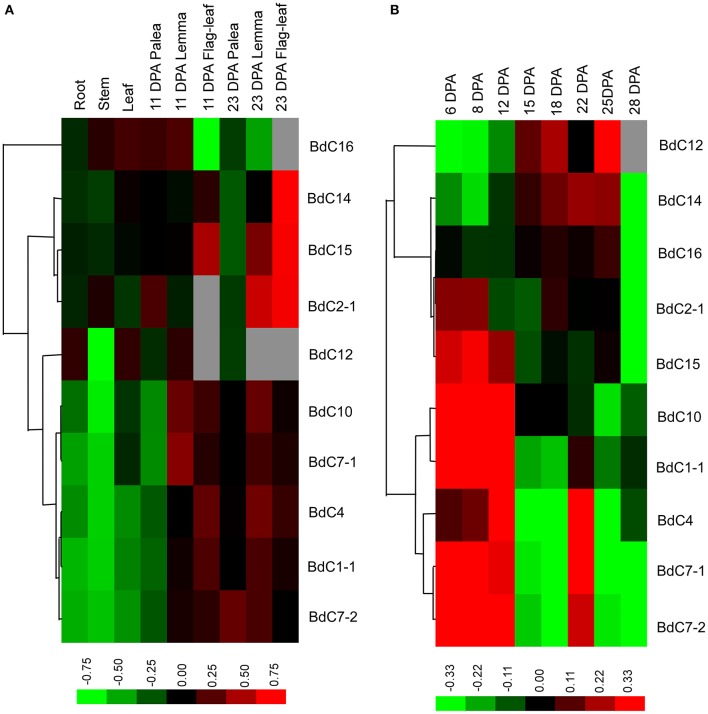
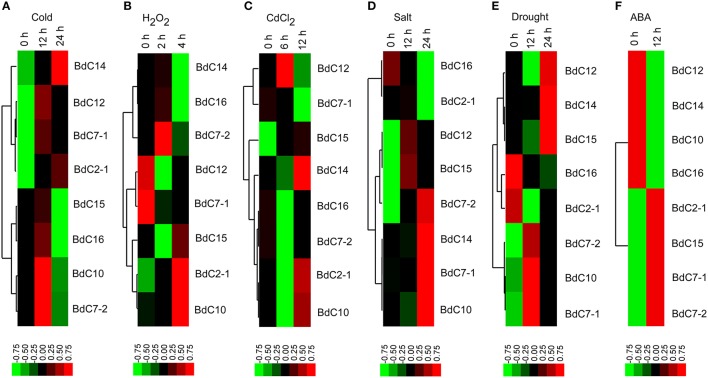
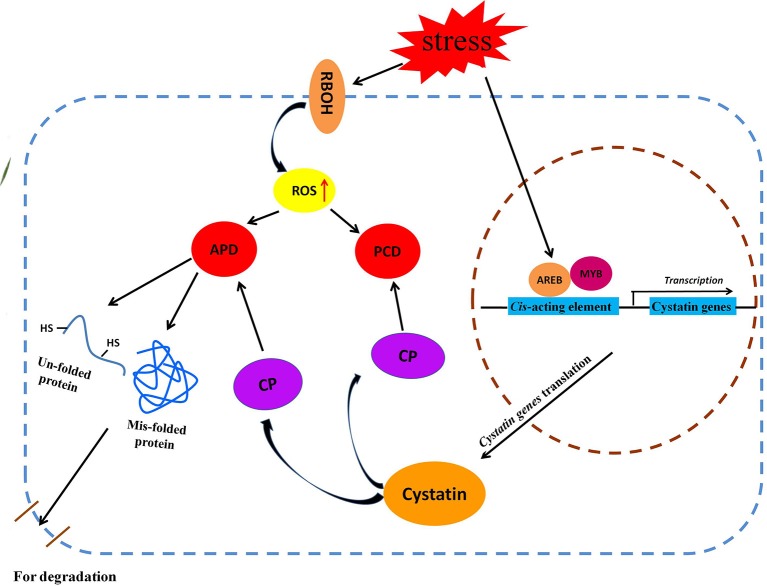
Cystatin is a class of proteins mainly involved in cysteine protease inhibition and plant growth and development, as well as tolerance under various abiotic stresses. In this study, we performed the first comprehensive analysis of the molecular characterization and expression profiling in response to various abiotic stresses of the cystatin gene family in Brachypodium distachyon, a novel model plant for Triticum species with huge genomes. Comprehensive searches of the Brachypodium genome database identified 25 B. distachyon cystatin (BdC) genes that are distributed unevenly on chromosomes; of these, nine and two were involved in tandem and segmental duplication events, respectively. All BdC genes had similar exon/intron structural organization, with three conserved motifs similar to those from other plant species, indicating their high evolutionary conservation. Expression profiling of 10 typical BdC genes revealed ubiquitous expression in different organs at varying expression levels. BdC gene expression in seedling leaves was particularly highly induced by various abiotic stresses, including the plant hormone abscisic acid and various environmental cues (cold, H2O2, CdCl2, salt, and drought). Interestingly, most BdC genes were significantly upregulated under multiple abiotic stresses, including BdC15 under all stresses, BdC7-2 and BdC10 under five stresses, and BdC7-1, BdC2-1, BdC14, and BdC12 under four stresses. The putative metabolic pathways of cytastin genes in response to various abiotic stresses mainly involve the aberrant protein degradation pathway and reactive oxygen species (ROS)-triggered programmed cell death signaling pathways. These observations provide a better understanding of the structural and functional characteristics of the plant cystatin gene family.

Keywords: BdC genes; Brachypodium distachyon L.; abiotic stress; expression profiling; phylogenetic relationships; qRT-PCR.


Figures

Figure 1
Figure 1
Genomic distribution of B. distachyon cystatin (BdC) genes. Chromosome numbers are indicated at the top of each bar and the scales show their each size (Mb). Blue and orange triangles indicate the upward and downward direction of transcription, respectively. Blue dotted lines connect the BdC genes present on duplicate chromosomal segments. The ruler represented in mega bases (M).
Figure 2
Figure 2
Phylogenetic relationships and gene structure analysis of cystatin genes in Brachypodium. (A) Rooted homology tree was constructed from the alignment of full-length amino acid sequences using the DNAMAN package. (B) Gene structure of BdC genes. Lavender solid boxes represent exons; black lines represent introns; yellow boxes represents up/down stream regions. Intronic phases were indicated by numbers 0, 1, and 2.
Figure 3
Figure 3
Conserved motif analysis of BdC proteins using MEME suite (A) Schematic diagram of amino acid motifs of cystatin genes. Motif analysis performed as described in the methods. Black solid line represents corresponding cystatin proteins and its length described by a residue scale. Various colored boxes indicating different motif and their position in each cystatin sequences as indicated. (B) Conserved protein motifs 1 (LARFAV), 2 (QTVAG), and 3 (W-residue) present in the variable region of cystatin genes.
Figure 4
Figure 4
Phylogenetic tree of the Poaceae cystatins showing relationships between the deduced amino acid sequences of 71 cystatin genes from different plant species. 25 from B. distachyon (BdC), 5 from T. aestivum (WC), 13 from H. vulgare (HvCPI), 1 from S. bicolor (SbC), 3 from Ae. tauschii (AeC), 10 from Z. mays (CC), 12 from O. sativa (OC), 1 from C. lacryma-jobi (CLA) and 1 from S. officinarum (SOF). Multiple alignments of sequences were performed by ClusalW, and the phylogenetic tree was constructed by the neighbor-joining (NJ) method and evaluated by bootstrap analysis. Numbers on the main branches indicate boot strap percentages for 1,000 replicates. The three major groups (1–3) and twelve phylogenetic subgroups (A–L) identified in the plant cystatin family are highlighted with different color arcs and branch, respectively. GenBank numbers for corresponding to the sequences are also shown. Green full circles indicate the BdC genes in the branches.
Figure 5
Figure 5
Expression profiling of BdC genes in different B. distachyon organs detected by qRT-PCR. (A) Comparative expression levels of 10 BdC genes in different Brachypodium distachyon organs, including roots, stems and leaves at the two-leaf stage; seed palea, lemma, flag-leaf at 11, and 23 days after anthesis (DPA). (B) Dynamic expression profiles of 10 BdC genes during seed development in Bd21. Relative quantification of the expression levels in developing caryopses was collected between 6 and 28 DPA. Log transform data was used to create the heatmap. Expression data were obtained from three biological replicates. Differences in gene expression changes are shown in color as the scale.
Figure 6
Figure 6
Expression profiles of BdC family members in the leaves of B. distachyon in response to different abiotic stress treatments (cold, H2O2, CdCl2, drought, salt, and ABA) by qRT-PCR. Blocks with colors indicated decreased (green) or increased (red) transcript accumulation relative to the respective control. Filled squares indicate a significant difference from the control (p < 0.05) by using SPSS (Statistical Product and Service Solutions) software. Expression profiles of the BdC genes under cold (A), H2O2 (B), CdCl2 (C), drought (D), salt (E) and ABA (F) stresses from different time points are indicated.
Figure 7
Figure 7
Schematic representation of putative metabolic pathways of cystatin genes involved in two major metabolic pathway (APD and PCD) under various abiotic stresses. AREB, ABA-responsive element binding protein; APD, Aberrant protein degradation; CP, Cysteine protease; MYB, Myeloblastosis family of transcription factor; PCD, Programmed cell death; RBOH, Respiratory burst oxidase homolog.

References

    1. Abe K., Emori Y., Kondo H., Suzuki K., Arai S. (1987). Molecular cloning of a cysteine proteinase inhibitor of rice (oryzacystatin). Homology with animal cystatins and transient expression in the ripening process of rice seeds. J. Biol. Chem. 262, 16793–16797. - PubMed
    1. Abraham Z., Martinez M., Carbonero P., Diaz I. (2006). Structural and functional diversity within the cystatin gene family of Hordeum vulgare. J. Exp. Bot. 57, 4245–4255. 10.1093/jxb/erl200 - DOI - PubMed
    1. Abrahamson M., Alvarez-Fernandez M., Nathanson C. M. (2003). Cystatins. Biochem. Soc. Symp. 70, 179–199. 10.1042/bss0700179 - DOI - PubMed
    1. Arai S., Matsumoto I., Emori Y., Abe K. (2002). Plant seed cystatins and their enzymes of endogenous and exogenous origin. J. Agric. Food Chem. 50, 6612–6617. 10.1021/jf0201935 - DOI - PubMed
    1. Bailey T. L., Williams N., Misleh C., Li W. W. (2006). MEME: discovering and analyzing DNA and protein sequence motifs. Nucleic Acids Res. 34, W369–W373. 10.1093/nar/gkl198 - DOI - PMC - PubMed

LinkOut - more resources