. 2016 Dec 3:21:27.
doi: 10.1186/s11658-016-0029-6. eCollection 2016.

IgG silencing induces apoptosis and suppresses proliferation, migration and invasion in LNCaP prostate cancer cells

Affiliations

IgG silencing induces apoptosis and suppresses proliferation, migration and invasion in LNCaP prostate cancer cells

Yawen Xu et al. Cell Mol Biol Lett. .

Abstract

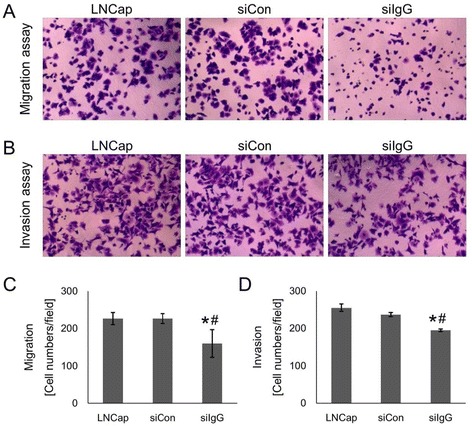
Immunoglobulin G (IgG) has been implicated in the progression of various cancers. This study explored the role of IgG in the proliferation, apoptosis, cell cycle and in vitro invasive properties of LNCaP prostate cancer cells. We used IGHG1 small interfering RNA to silence IgG1 expression in LNCaP cells. The efficacy of IgG1 gene knockdown was confirmed using qPCR and western blotting. The colony formation, proliferation, migration and invasion abilities of LNCaP cells after transfection were assessed using colony-forming, flow cytometry and transwell assays. The expressions of PCNA and caspase-3 proteins in LNCaP cells after transfection were detected with immunofluorescence staining and western blotting. IgG1 silencing significantly decreased the colony formation, survival, cell cycle progression, migration and invasion of LNCaP cells (p < 0.05). IgG1 silencing also reduced the amount of the proliferation marker PCNA and induced formation of the apoptotic marker caspase-3 (p < 0.05). Our results show that IgG1 produced by LNCaP cells confers advantages for tumor cell survival, proliferation, migration and invasion, suggesting that IgG1 is a potential target for prostate cancer treatment.

Keywords: Apoptosis; Caspase-3; Cell cycle; Immunoglobulin G; Invasion; LNCaP cells; Migration; Proliferation; Prostate cancer; RNA interference.


Figures

Fig. 1
Fig. 1
IGHG1 silencing suppresses the clonogenicity and survival of LNCaP cells. Cells were transfected with IgG1 (siIgG) and control siRNA (siCon). a – Cells were harvested at 36 h for qPCR to determine the mRNA expression levels. b – Cells were harvested at 48 h for western blotting to determine the protein expression levels. c – Transfected cells were used for a colony-forming assay. Colonies were stained with crystal violet and then counted to calculate the colony-forming efficiency (CFE). d – The same stained colonies were counted to determine the surviving fraction (SF). *p < 0.01 vs. siCon; # p < 0.01 vs. LNCaP (non-transfected control)
Fig. 2
Fig. 2
IGHG1 silencing attenuates the cell cycle progression of LNCaP cells. Cells were transfected with IgG1 (siIgG) and control siRNA (siCon) for 48 h, then harvested, fixed and stained with propidium iodide (PI). The cell cycle was analyzed by flow cytometry. a – Representative histograms. b – Quantitative results from three independent experiments. *p < 0.05 vs. siCon; # p < 0.05 vs. LNCaP (non-transfected control)
Fig. 3
Fig. 3
IGHG1 silencing reduces in vitro migration and invasion of LNCaP cells. Cells were transfected with IgG1 (siIgG) and control siRNA (siCon) and then seeded into transwells to determine a – The cell migration ability and b – The cell invasion ability. For migration assays, the cells were seeded in inserts containing fresh medium. For invasion assays, the inserts contained matrigel. Representative pictures are shown (scale bar, 100 μM). c, d – Quantitative results from three independent experiments are shown. *p < 0.05 vs. siCon; # p < 0.05 vs. LNCaP (non-transfected control)
Fig. 4
Fig. 4
IGHG1 silencing decreases PCNA and increases caspase-3 in LNCaP cells. Cells were transfected with IgG1 (siIgG) and control siRNA (siCon) for 48 h and then fixed with 4% paraformaldehyde and stained for a – PCNA proliferation marker and b – caspase-3 apoptotic marker. Representative images are shown (scale bar, 100 μM). c, d – The integrated optical density (IOD) of green fluorescence and the area were quantified. *p < 0.05 vs. siCon; # p < 0.05 vs. LNCaP (non-transfected control)

Similar articles

Cited by

References

    1. Siegel R, Naishadham D, Jemal A. Cancer statistics, 2012. CA Cancer J Clin. 2012;62:10–29. doi: 10.3322/caac.20138. - DOI - PubMed
    1. Siegel RL, Miller KD, Jemal A. Cancer statistics, 2015. CA Cancer J Clin. 2015;65:5–29. doi: 10.3322/caac.21254. - DOI - PubMed
    1. Yang L, Parkin DM, Whelan S, Zhang S, Chen Y, Lu F, Li L. Statistics on cancer in China: cancer registration in 2002. Eur J Cancer Prev. 2005;14:329–35. doi: 10.1097/00008469-200508000-00004. - DOI - PubMed
    1. DeSantis CE, Lin CC, Mariotto AB, Siegel RL, Stein KD, Kramer JL, Alteri R, Robbins AS, Jemal A. Cancer treatment and survivorship statistics, 2014. CA Cancer J Clin. 2014;64:252–71. doi: 10.3322/caac.21235. - DOI - PubMed
    1. Chen Z, Gu J. Immunoglobulin G expression in carcinomas and cancer cell lines. FASEB J. 2007;21:2931–8. doi: 10.1096/fj.07-8073com. - DOI - PubMed