

Measuring the orbital angular momentum spectrum of an electron beam
- PMID: 28537248
- PMCID: PMC5458084
- DOI: 10.1038/ncomms15536
Measuring the orbital angular momentum spectrum of an electron beam
Abstract
Electron waves that carry orbital angular momentum (OAM) are characterized by a quantized and unbounded magnetic dipole moment parallel to their propagation direction. When interacting with magnetic materials, the wavefunctions of such electrons are inherently modified. Such variations therefore motivate the need to analyse electron wavefunctions, especially their wavefronts, to obtain information regarding the material's structure. Here, we propose, design and demonstrate the performance of a device based on nanoscale holograms for measuring an electron's OAM components by spatially separating them. We sort pure and superposed OAM states of electrons with OAM values of between -10 and 10. We employ the device to analyse the OAM spectrum of electrons that have been affected by a micron-scale magnetic dipole, thus establishing that our sorter can be an instrument for nanoscale magnetic spectroscopy.
Conflict of interest statement
V.G., R.W.B, R.E.-D., M.J.P. and E.K. conceived the idea; M.J.P, V.G., M.P.J.L., and E.K. designed the hologram; F.V., G.C.G., P.-H.L., and E.M. fabricated the hologram; F.V., G.C.G., and S.F. fabricated the magnetic pillar; A.H.T., V.G., S.F. and R.B. performed the experiment; V.G., and A.H.T analysed the data; V.G., H.L., F.B., and E.K developed the application theory; H.L., F.B., and E.K. with the help from other authors wrote the manuscript. All authors discussed the results and contributed to the text of the manuscript.
The authors declare no competing financial interests.
Figures
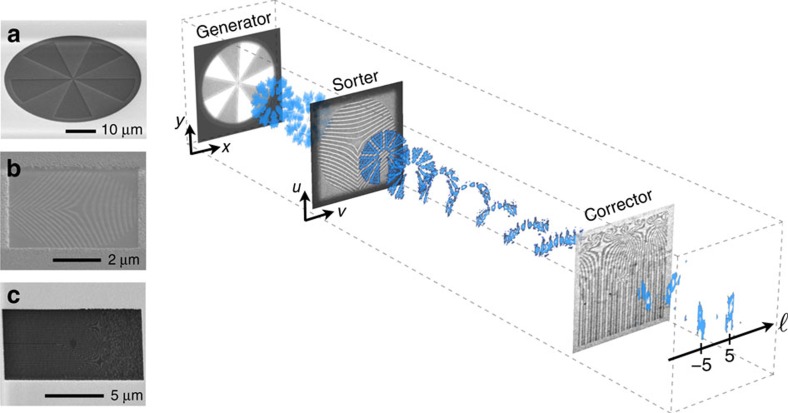
 . Once the beam is unwrapped, it passes through a hologram in the sorter's corrector plane corresponding to the microscope's selected area diffraction (SAD) aperture. This hologram brings corrections to any phase defects to the beam to stabilize its propagation through the rest of the sorter. At the sorter's output, the original beam's OAM content is spatially resolved on a screen and captured by a CCD camera. A more detailed schematic of our sorter's implementation is included in Supplementary Fig. 1 and Supplementary Note 1 where we provide details concerning the electron microscope lenses required to perform the mapping. Scanning electron microscopy (SEM) images of the depicted holograms, the ones in the generator, sorter and corrector planes, are shown in a–c, respectively.
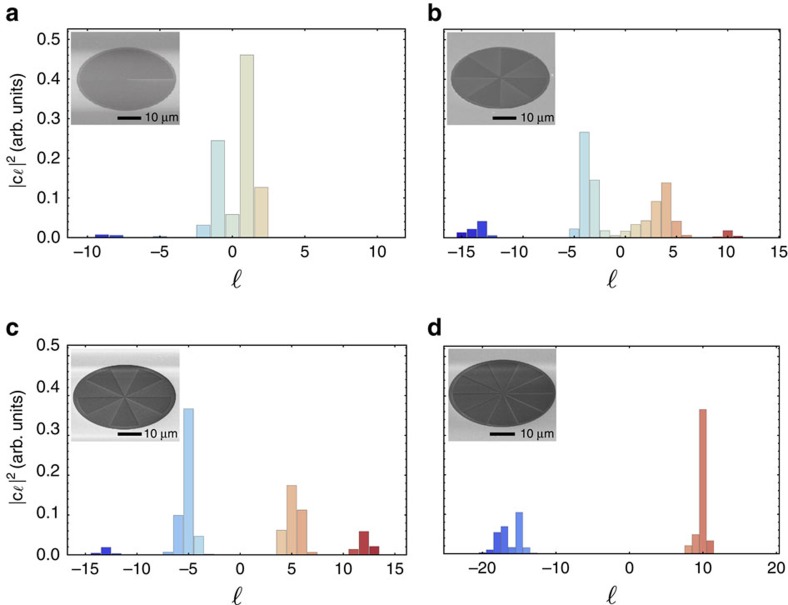
 , generated by a phase mask; (c) a superposition of ±5 OAM states,
  , generated by a phase mask; and (d) OAM of +10, ψ+10, produced by a spiral phase plate. Scanning electron microscopy (SEM) images of the devices used to generate the analysed electron beams are provided in the insets of their respective spectra.
References
-
- Bliokh K. Y., Bliokh Y. P., Savel'ev S. & Nori F. Semiclassical dynamics of electron wave packet states with phase vortices. Phys. Rev. Lett. 99, 190404 (2007). - PubMed
-
- Lloyd S., Babiker M. & Yuan J. Quantized orbital angular momentum transfer and magnetic dichroism in the interaction of electron vortices with matter. Phys. Rev. Lett. 108, 074802 (2012). - PubMed
-
- Asenjo-Garcia A. & de Abajo F. G. Dichroism in the interaction between vortex electron beams, plasmons, and molecules. Phys. Rev. Lett. 113, 066102 (2014). - PubMed
-
- Kaminer I. et al.. Quantum čerenkov radiation: spectral cutoffs and the role of spin and orbital angular momentum. Phys. Rev. X 6, 011006 (2016).
-
- Kaminer I., Nemirovsky J., Rechtsman M., Bekenstein R. & Segev M. Self-accelerating dirac particles and prolonging the lifetime of relativistic fermions. Nat. Phys. 11, 261–267 (2015).
Publication types
LinkOut - more resources
Full Text Sources
Other Literature Sources
Molecular Biology Databases
