. 2017 May 24:8:15402.
doi: 10.1038/ncomms15402.

Antigen-specific CD8+ T cell feedback activates NLRP3 inflammasome in antigen-presenting cells through perforin

Affiliations

Antigen-specific CD8+ T cell feedback activates NLRP3 inflammasome in antigen-presenting cells through perforin

Yikun Yao et al. Nat Commun. .

Abstract

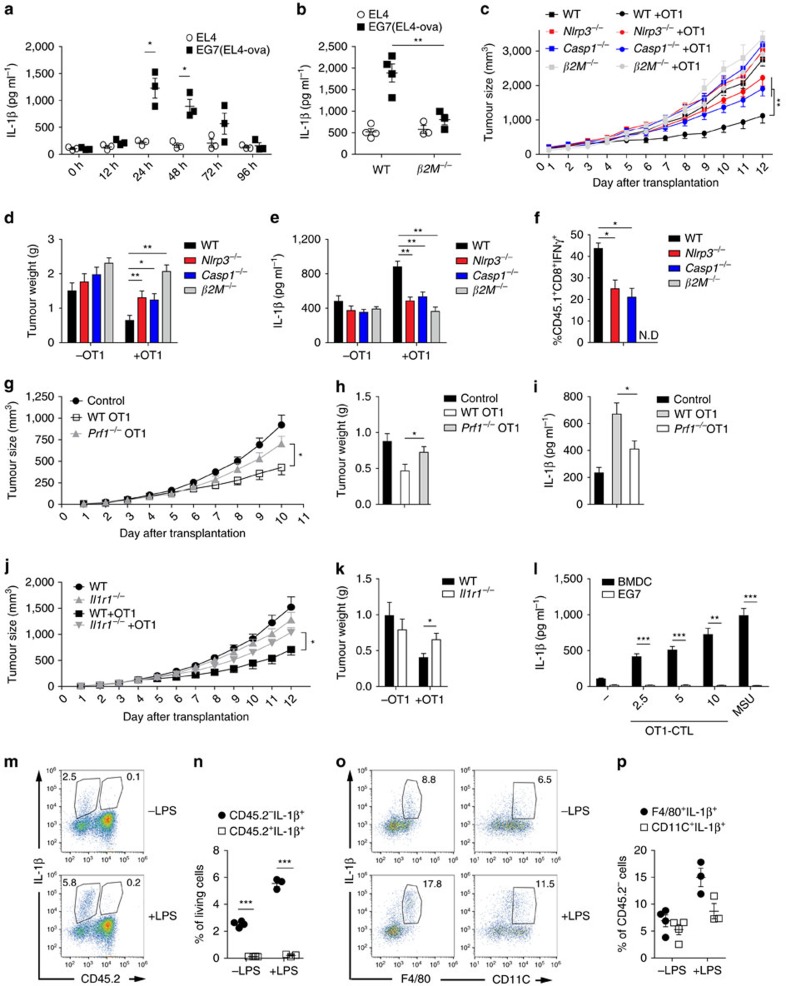
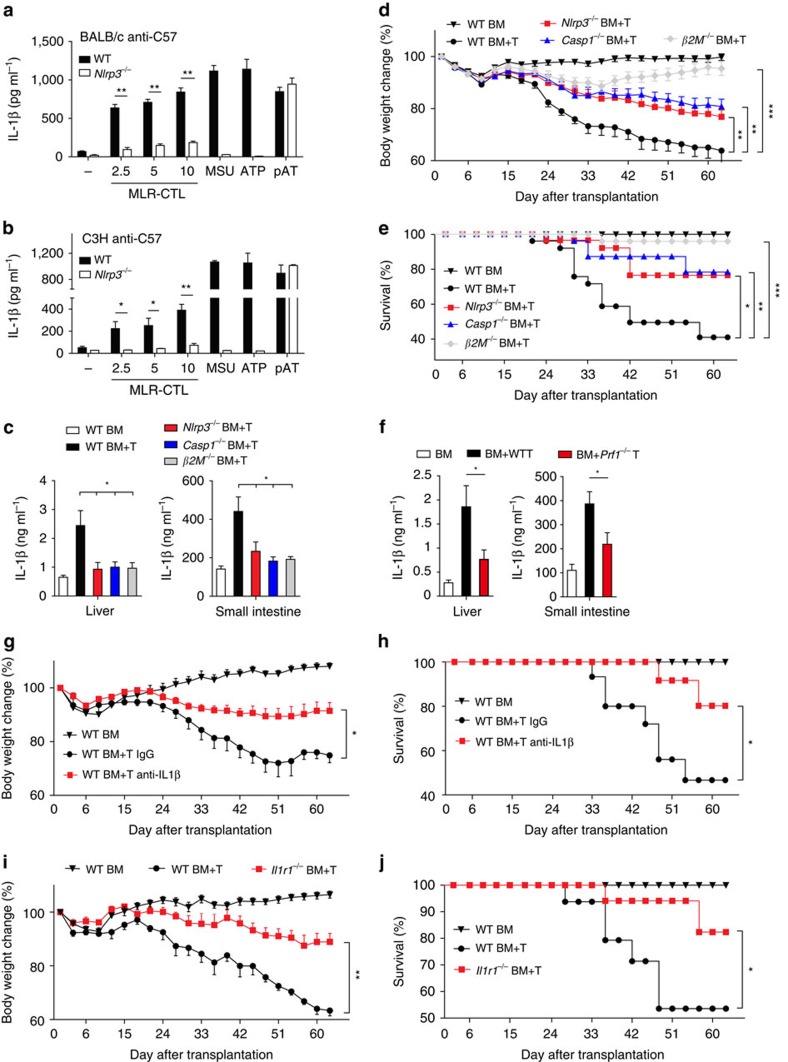
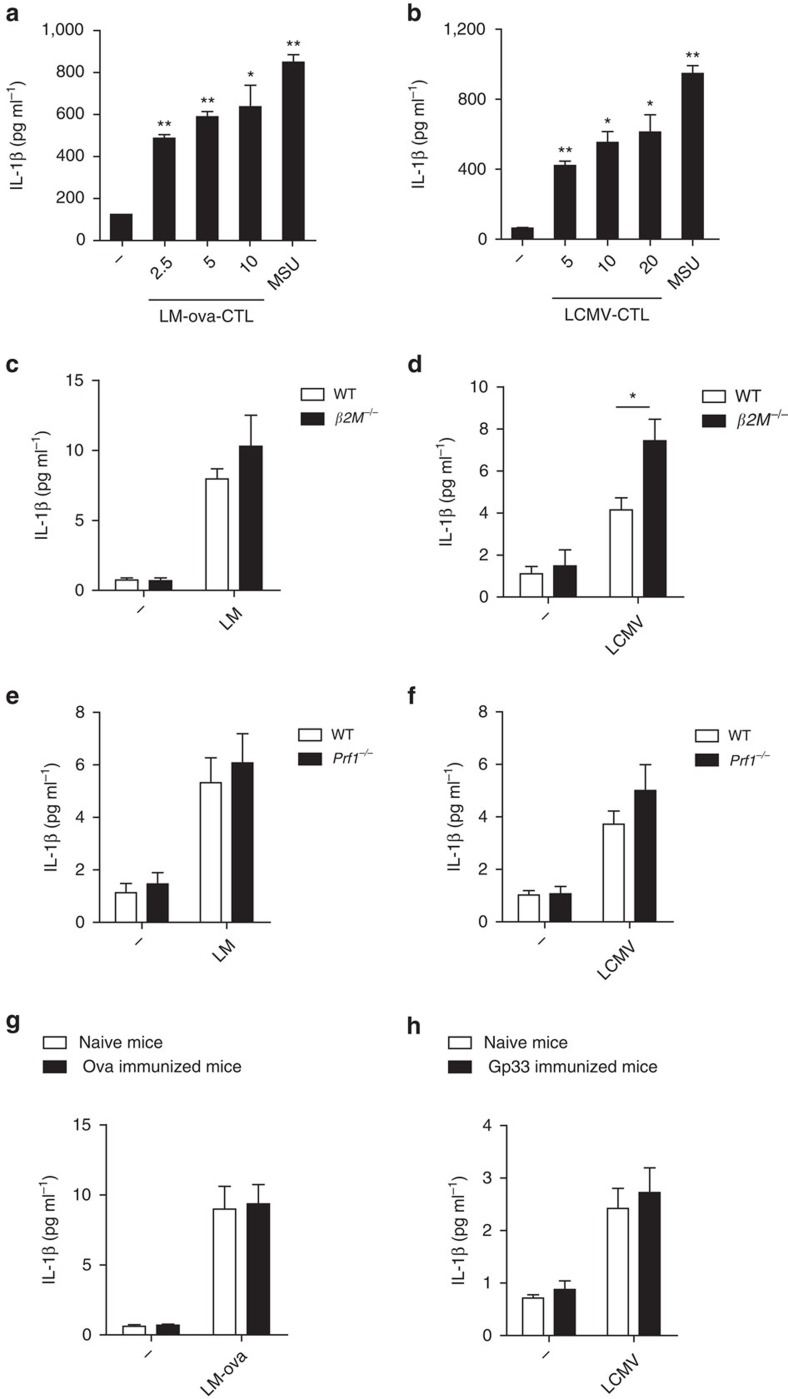
The connection between innate and adaptive immunity is best exemplified by antigen presentation. Although antigen-presenting cells (APCs) are required for antigen receptor-mediated T-cell activation, how T-cells feedback to APCs to sustain an antigen-specific immune response is not completely clear. Here we show that CD8+ T-cell (also called cytotoxic T lymphocytes, CTL) feedback activates the NLRP3 inflammasome in APCs in an antigen-dependent manner to promote IL-1β maturation. Perforin from antigen-specific CTLs is required for NLRP3 inflammasome activation in APCs. Furthermore, such activation of NLRP3 inflammasome contributes to the induction of antigen-specific antitumour immunity and pathogenesis of graft-versus-host diseases. Our study reveals a positive feedback loop between antigen-specific CTLs and APC to amplify adaptive immunity.


Conflict of interest statement

The authors declare no competing financial interests.

Figures

Figure 1
Figure 1. Inflammasome assembly in APCs induced by antigen-specific CTLs.
(a,b) Confocal microscopy analysis (a) and quantification (b) of ASC specks assembled of LPS-primed and ova-pulsed BMDCs incubated with activated OT1-CTLs (DC+CTL) or with MSU (DC+MSU). Scale bar, 10 μm of the top panel, 5 μm of the bottom panel. (c) Western blot of cell lysates (Lys), DSS cross-linked pellets (Pellet) or supernatants (Sup) from LPS-primed and ova-pulsed BMDCs co-cultured with activated OT1-CTLs at the ratios indicated for 4 h. (d) The levels of IL-1β from LPS-primed BMDCs that were pulsed with or without ova peptide for 1 h and then co-cultured with the activated OT1-CTLs at the ratios indicated. LPS+ATP (ATP) was used as a positive control. (e) IL-1β release from LPS-primed and ova-pulsed BMDCs co-incubated with OT1-CTLs for the indicated time. (f) The levels of IL-1β from LPS-primed and ova-pulsed BMDMs or peritoneal macrophages (PM) co-incubated with OT1-CTLs for 4 h. (g,h) Confocal microscopy analysis (g) and quantification (h) of ASC specks assembled of LPS-primed BMDCs incubated with MLR-CTLs (DC+CTL) or with MSU (DC+MSU). Scale bar, 10 μm of the top panel, 5 μm of the bottom panel. (i) Western blot of cell lysates (Lys), DSS cross-linked pellets (Pellet) or supernatants (Sup) from LPS-primed BMDCs co-cultured with MLR-CTLs. (j) IL-1β release determined by ELISA from LPS-primed BMDCs co-cultured with MLR-CTLs (C57 anti-BALB/c or BALB/c anti-C57) with the indicated ratios for 4 h. MSU and ATP were used as positive controls. (k) The levels of IL-1β from LPS-primed BMDCs co-cultured with purified MLR CTLs or all the other remaining cells for 4 h. (l) The level of IL-1β from LPS-primed and ova-pulsed BMDCs co-cultured with MLR-CTLs (C57 anti-BALB/c) that were sorted as indicated in Supplementary Fig. 1f. Data are representative of two (c,e,i) or three (a,b,d,fh,jl) independent experiments. Error bars, s.e.m. *P<0.05, **P<0.01, ***P<0.001 by two-tailed Student's t-test.
Figure 2
Figure 2. The essential role of NLRP3 for CTL-induced IL-1β secretion.
(a) IL-1β release from LPS-primed and ova-pulsed wild-type or Aim2−/− BMDCs co-incubated with OT1-CTLs at the ratios indicated for 4 h. pAT (poly(dA:dT)) was used as a positive control. (b) The levels of IL-1β from LPS-primed and ova-pulsed wild-type or Nlrp3−/− BMDCs co-incubated with OT1-CTLs at the ratios indicated. MSU and ATP were used as positive controls. (c) Confocal microscopy analysis of ASC specks assembled of LPS-primed and ova-pulsed wild-type (WT) or Nlrp3−/− BMDCs incubated with activated OT1-CTLs (DC+CTL). Far right, magnification of the area in red colour outlined at left showing the typical NLRP3 inflammasome structure. Scale bar, 5 μm. (d) Western blot analysis of cell lysates (Lys), DSS cross-linked pellets (Pellet) or supernatants (Sup) of wild-type, Nlrp3−/− or Casp1−/− BMDCs that were LPS-primed and ova-pulsed and then co-cultured with OT1-CTLs. (e) The levels of IL-1β from LPS-primed and ova-pulsed wild-type or Casp1−/− BMDCs co-incubated with OT1-CTLs at the ratios indicated. (f) IL-1β release from LPS-primed and ova-pulsed BMDCs co-incubated with OT1-CTLs in the presence or absence of the Caspase-1 inhibitor z-YVAD-fmk for 4 h. (g) The levels of IL-1β from wild-type C57 or 129X1/SvJ BMDCs that were LPS-primed and ova-pulsed and then co-cultured with OT1-CTLs. (h,i) Western blot analysis of cell lysates (Lys), DSS cross-linked pellets (Pellet) or supernatants (Sup) (h) and IL-1β release (i) of wild-type, Nlrp3−/− or Casp1−/− BMDMs that were LPS-primed and ova-pulsed and then co-cultured with OT1-CTLs. (j) Neutrophil influx or IL-1β level of peritoneal lavage from wild-type or Nlrp3−/− mice that were challenged i.p. with or without ova (10 μg) for 1.5 h and then with OT1-CTLs for 6 h. n=4 Neutrophil influx, n=6 IL-1β level. Data are representative of two (d,f,g,h) or three (ac,e,i,j) independent experiments. Error bars, s.e.m. *P<0.05, **P<0.01, ***P<0.001 by two-tailed Student's t-test.
Figure 3
Figure 3. Antigen presentation for CTL-induced NLRP3 activation.
(a) Confocal microscopy analysis of ASC specks assembled of LPS-primed and ova-pulsed wild-type (WT) or β2M−/− BMDCs incubated with activated OT1-CTLs (DC+CTL). Scale bar, 5 μm. (b) Western blot of cell lysates (Lys), DSS cross-linked pellets (Pellet) or supernatants (Sup) from LPS-primed and with or without ova-pulsed wild-type BMDCs or LPS-primed and ova-pulsed β2M−/− BMDCs co-cultured with activated OT1-CTLs. (c) IL-1β release from LPS-primed and ova-pulsed BMDCs from wild-type or β2M−/− mice that were co-cultured with OT1-CTLs. (d) IL-1β release from LPS-primed and ova-pulsed BMDCs from wild-type or H2-KbDb−/− mice that were co-cultured with OT1-CTLs. (e) Confocal microscopy analysis of ASC specks assembled of LPS-primed wild-type (WT) or β2M−/− BMDCs incubated with MLR-CTLs (DC+CTL) (BALB/c anti-C57). Scale bar, 5 μm. (f) Western blot of cell lysates (Lys), DSS cross-linked pellets (Pellet) or supernatants (Sup) from LPS-primed wild-type BMDCs or β2M−/− BMDCs co-cultured with MLR-CTLs. (g) IL-1β release from LPS-primed BMDCs from wild-type or β2M−/− mice that were co-cultured with MLR-CTLs. (h,i) IL-1β levels from LPS-primed BMDCs co-cultured with ConA, PMA plus ionomycin (h) or anti-CD3 (i) activated CTLs. (j) OT1 mice were challenged i.v. with ova peptide (2 μg) once (OT1-first ova) or rechallenged i.v. on day 7 (OT1-second ova). IL-1β release from spleen homogenates from challenged and rechallenged mice was determined by ELISA after 6 h i.v. with ova peptide. n=3 per group. (k) IL-1β release from spleen homogenates from wild-type, β2M−/− or H2-KbDb−/− mice that were challenged i.v. with ova peptide for 1.5 h and then injected i.v. with activated OT1-CTLs for 6 h. n=3 per group. Data are representative of two (bd,f) or three (a,e,gk) independent experiments. Error bars, s.e.m. *P<0.05, **P<0.01, ***P<0.001 by two-tailed Student's t-test.
Figure 4
Figure 4. Perforin in CTLs required for IL-1β secretion in APCs.
(a) IL-1β release in the supernatants (Sup) of LPS-primed and ova-pulsed BMDCs co-cultured with OT1-CTLs for 4 h or in the supernatants (Sup+DC) from LPS-primed DC cells stimulated with the previous Sup for 4 h. (b) IL-1β release from LPS-primed and ova-pulsed BMDCs, co-cultured with OT1-CTLs or with transwell-seperated OT1-CTLs for 4 h. LPS+ATP (ATP) were added as a positive control. (c) IL-1β release from LPS-primed wild-type or Faslpr BMDCs co-cultured with OT1-CTLs. (d) The percentages of different CTL populations as indicated in MLR reaction at day 6. (e) The mRNA levels of perforin and granzyme B of CTL populations as in d. (f) IL-1β secretion from BMDCs co-cultured with the different CTL populations from MLR as in e. (g) IL-1β release from LPS-primed and ova-pulsed BMDCs co-incubated with OT1-CTLs for 4 h in the presence of perforin inhibitor CMA (100 ng ml−1). (h) IL-1β release from LPS-primed BMDCs co-cultured with MLR-CTLs (C57 or 129 anti BALB/c) from the indicated mice. (i) IL-1β release from BMDMs that were co-cultured overnight with anti-CD3 plus anti-CD28 treated CTLs from wild-type and Prf1−/− mice in the presence of anti-CD3 and then were primed with LPS and stimulated with MSU. (j) IL-1β release from LPS-primed wild-type or Nlrp3−/− BMDCs treated with the perforin buffer or perforin buffer plus perforin in the presence or absence of calcium inhibitor BAPTA-AM (50 μM). (k) IL-1β release from LPS-primed wide-type or Nlrp3−/− BMDCs transfected with the indicated proteins by the profectP1 protein delivery system. (l) IL-1β release from LPS-primed ova-pulsed BMDCs co-cultured with OT1 CTLs in the presence of 2-APB (50 μM) or BAPTA-AM (25 μM). (m) IL-1β release from LPS-primed ova-pulsed BMDCs co-cultured with OT1 CTLs in the presence or absence of KCl (50 mM). Data are representative of three (am) independent experiments. Error bars, s.e.m. *P<0.05, **P<0.01, ***P<0.001 by two-tailed Student's t-test.
Figure 5
Figure 5. CTL-induced NLRP3 activation in antitumour immunity.
(a,b) IL-1β levels in tumour homogenates from wild-type mice (a) and wild-type or β2M−/− mice (b) injected s.c. with EL4 or EG7 (EL4-ova) and then injected i.v. with activated OT1 CTLs for the indicated time (a) n=3 or 24 h (b) n=4 WT, n=3 β2M−/−. (c,d) Tumour size (c) and tumour weight (d) from the indicated mice first injected s.c. with EG7 cells and then injected i.v. with OT1-CTLs. n=11 WT, n=7 Nlrp3−/−, n=11 Casp1−/−, n=5 β2M−/−. (e) IL-1β level in tumour homogenates at day 5 after OT1 CTLs injection from the mice treated as in c,d. n=8 WT, n=7 Nlrp3−/−, n=5 Casp1−/−, n=5 β2M−/−. (f) The T-cell percentage in tumours of the indicated mice first injected s.c. with EG7 cells and then injected i.v. with CD45.1+ OT1 CTLs. n=5 WT, n=7 Nlrp3−/−, n=5 Casp1−/−, n=5 β2M−/−. (gi) Tumour size (g), tumour weight (h) and IL-1β level (i) in tumours from mice first injected s.c. with EG7 cells and then injected i.v. with OT1-CTLs or Prf1−/− OT1-CTLs. n=8 per group. (j,k) Tumour size (j) and tumour weight (k) from wild-type and Il1r1−/− mice first injected s.c. with EG7 cells and then injected i.v. with OT1-CTLs. n=8 per group. (l) IL-1β release from LPS-primed and ova-pulsed BMDCs or EG7 tumour cells co-cultured with OT1-CTLs. (m,n) Flow analysis (m) and quantification (n) of IL-1β producing cells in tumours from CD45.1+ mice first injected s.c. with EG7 cells (CD45.2+) and then injected i.v. with OT1-CTLs (CD45.2+) for 5 days. n=4 −LPS, n=3 +LPS. (o,p) Flow analysis (o) and quantification (p) of IL-1β producing cells gated from CD45.2 cell population in m. n=4 −LPS, n=3 +LPS. (a,b and ck, mp) followed the procedures in Supplementary Fig. 5a and 5d respectively. Data are representative of three (ap) independent experiments. Error bars, s.e.m. Two-way ANOVA (c,g,j), two-tailed Student's t-test (a,b,df,h,i,k,l,n), *P<0.05, **P<0.01, ***P<0.001.
Figure 6
Figure 6. CTL-induced NLRP3 activation in GVHD.
(a,b) IL-1β release from LPS-primed wild-type or Nlrp3−/− BMDCs co-cultured with BALB/c anti-C57 (a) or C3H anti-C57 (b) MLR-CTLs. (ce) The level of IL-1β (c) n=5 per group, body weight change (d) and survival rate (e) of wild-type, Nlrp3−/−, Casp1−/− or β2M−/− mice underwent total body irradiation (TBI) followed by i.v. injection of C3H BM alone or C3H BM plus CTLs. n=9 WT BM, n=17 WT BM+T, n=14 Nlrp3−/− BM+T, n=11 Casp1−/− BM+T, n=13 β2M−/− BM+T. (f) The level of IL-1β in the liver or small intestine of the mice underwent TBI followed by i.v. injection of bm1 BM alone or bm1 BM plus CTLs from wide-type or Prf1−/−mice. n=6 per group. (g,h) Body weight change (g) and survival rate (h) of control IgG or anti-IL1β treated mice underwent TBI followed by i.v. injection of C3H BM alone or C3H BM plus CTLs. n=5 WT BM, n=8 WT BM+T IgG, n=8 WT BM+T anti-IL1β. (i,j) Body weight change (i) and survival rate (j) of wild-type, Il1r1−/− mice underwent TBI followed by i.v. injection of C3H BM alone or C3H BM plus CTLs. n=5 WT BM, n=8 WT BM+T, n=8 Il1r1−/− BM+T. Data are representative of three (aj) independent experiments. Error bars, s.e.m. two-tailed Student's t-test (ac,f), two-way ANOVA (d,g,i), log-rank test (e,h,j). *P<0.05, **P<0.01, ***P<0.001.
Figure 7
Figure 7. NLRP3 activation by CTL is not important for anti-LM or LCMV immunity.
(a) IL-1β secretion in ova-plused BMDCs after co-cultured with the CTLs from Listeria monocytogenes-ova immunized mice (LM-ova-CTL) at the indicated ratios for 4 h. (b) IL-1β secretion in gp33-plused BMDCs after co-cultured with the CTLs from LCMV immunized mice (LCMV-CTL) at the indicated ratio for 4 h. (c) IL-1β level in spleen from wild-type or β2M−/− mice after i.v. injection of Listeria monocytogenes (LM). n=5 per group. (d) IL-1β in spleen from wild-type or β2M−/− mice after i.p. injection of LCMV virus. n=5 per group. (e) IL-1β level in spleen from wild-type or Prf1−/− mice after i.v. injection of Listeria monocytogenes (LM). n=6 per group. (f) IL-1β level in spleen from wild-type or Prf1−/− mice after i.p. injection of LCMV virus. n=6 per group. (g) IL-1β level in spleen at day 5 after i.v. injection of LM-ova from the mice with or without ova pre-immunization for one month. n=5 per group. (h) IL-1β level in spleen at day 5 after i.v. injection of LCMV from the mice with or without gp33 pre-immunization for one month. n=5 per group. Data are representative of three (ah) independent experiments. Error bars, s.e.m. *P<0.05, **P<0.01 by two-tailed Student's t-test.

Similar articles

Cited by

References

    1. Franchi L., Munoz-Planillo R. & Nunez G. Sensing and reacting to microbes through the inflammasomes. Nat. Immunol. 13, 325–332 (2012). - PMC - PubMed
    1. de Zoete M. R., Palm N. W., Zhu S. & Flavell R. A. Inflammasomes. Cold Spring Harb. Perspect. Biol. 6, a016287 (2014). - PMC - PubMed
    1. Lamkanfi M. & Dixit V. M. Mechanisms and functions of inflammasomes. Cell 157, 1013–1022 (2014). - PubMed
    1. Latz E., Xiao T. S. & Stutz A. Activation and regulation of the inflammasomes. Nat. Rev. Immunol. 13, 397–411 (2013). - PMC - PubMed
    1. Franchi L., Eigenbrod T., Munoz-Planillo R. & Nunez G. The inflammasome: a caspase-1-activation platform that regulates immune responses and disease pathogenesis. Nat. Immunol. 10, 241–247 (2009). - PMC - PubMed

Publication types

MeSH terms