

A rare-variant test for high-dimensional data
- PMID: 28537275
- PMCID: PMC5513099
- DOI: 10.1038/ejhg.2017.90
A rare-variant test for high-dimensional data
Abstract
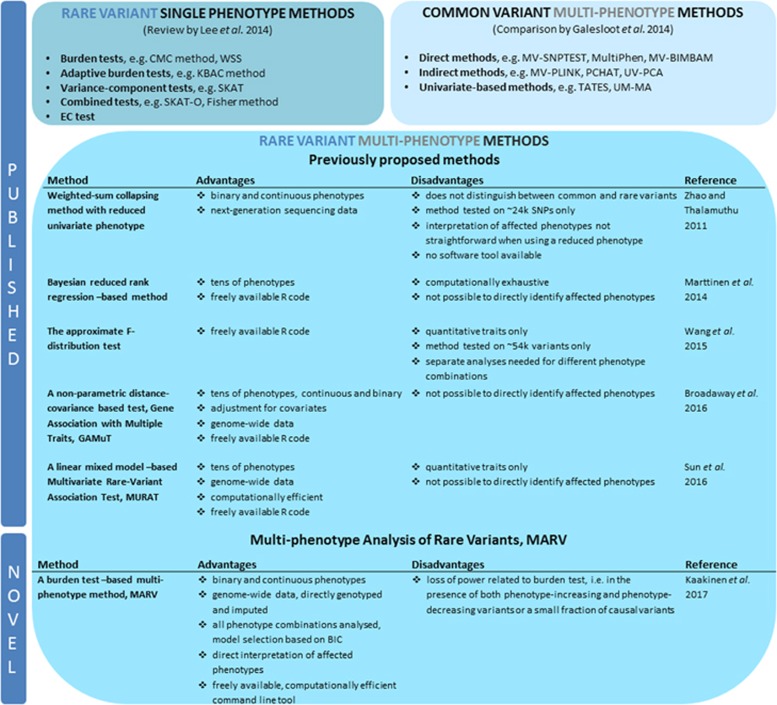
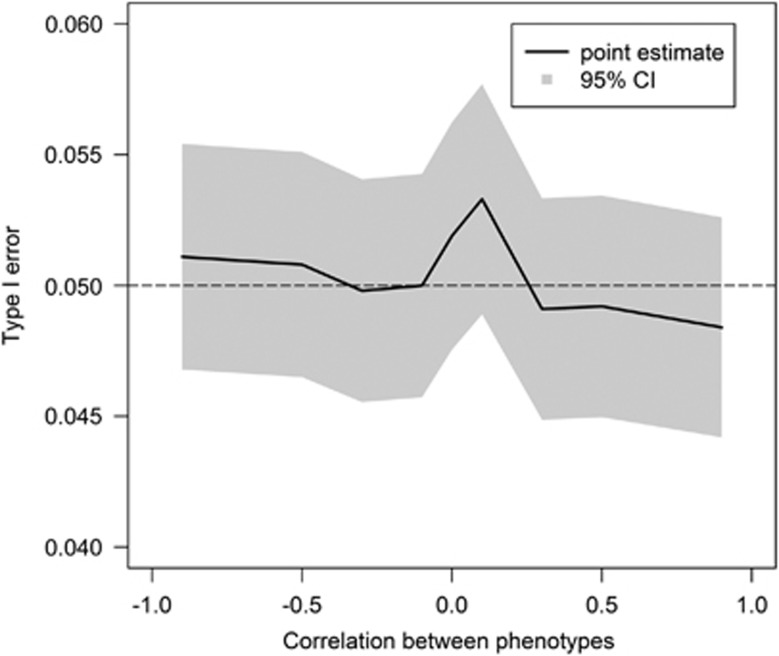
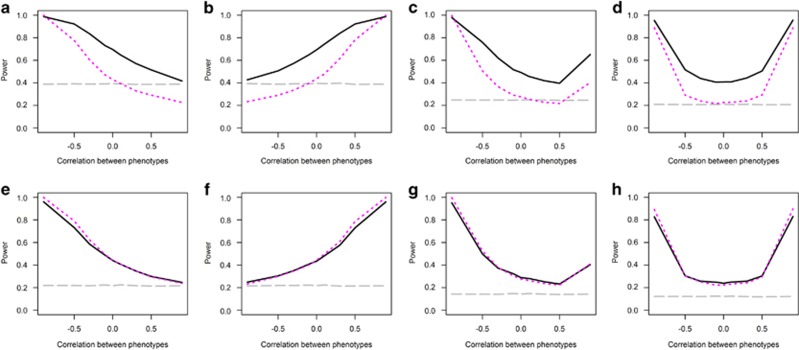
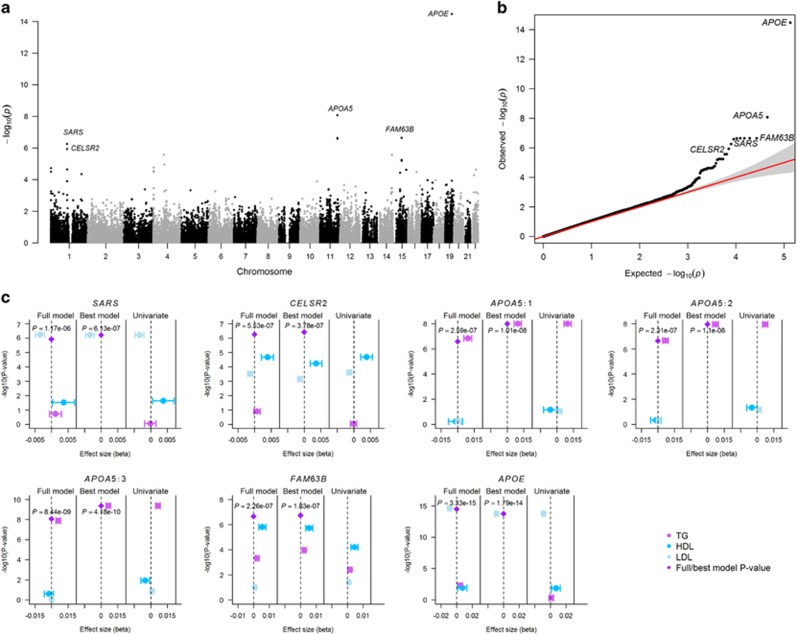
Genome-wide association studies have facilitated the discovery of thousands of loci for hundreds of phenotypes. However, the issue of missing heritability remains unsolved for most complex traits. Locus discovery could be enhanced with both improved power through multi-phenotype analysis (MPA) and use of a wider allele frequency range, including rare variants (RVs). MPA methods for single-variant association have been proposed, but given their low power for RVs, more efficient approaches are required. We propose multi-phenotype analysis of rare variants (MARV), a burden test-based method for RVs extended to the joint analysis of multiple phenotypes through a powerful reverse regression technique. Specifically, MARV models the proportion of RVs at which minor alleles are carried by individuals within a genomic region as a linear combination of multiple phenotypes, which can be both binary and continuous, and the method accommodates directly the genotyped and imputed data. The full model, including all phenotypes, is tested for association for discovery, and a more thorough dissection of the phenotype combinations for any set of RVs is also enabled. We show, via simulations, that the type I error rate is well controlled under various correlations between two continuous phenotypes, and that the method outperforms a univariate burden test in all considered scenarios. Application of MARV to 4876 individuals from the Northern Finland Birth Cohort 1966 for triglycerides, high- and low-density lipoprotein cholesterols highlights known loci with stronger signals of association than those observed in univariate RV analyses and suggests novel RV effects for these lipid traits.
Conflict of interest statement
The authors declare no conflict of interest.
Figures
Similar articles
-
MARV: a tool for genome-wide multi-phenotype analysis of rare variants.BMC Bioinformatics. 2017 Feb 16;18(1):110. doi: 10.1186/s12859-017-1530-2. BMC Bioinformatics. 2017. PMID: 28209135 Free PMC article.
-
Estimating genetic effects and quantifying missing heritability explained by identified rare-variant associations.Am J Hum Genet. 2012 Oct 5;91(4):585-96. doi: 10.1016/j.ajhg.2012.08.008. Epub 2012 Sep 27. Am J Hum Genet. 2012. PMID: 23022102 Free PMC article.
-
A Robust and Powerful Set-Valued Approach to Rare Variant Association Analyses of Secondary Traits in Case-Control Sequencing Studies.Genetics. 2017 Mar;205(3):1049-1062. doi: 10.1534/genetics.116.192377. Epub 2016 Dec 30. Genetics. 2017. PMID: 28040743 Free PMC article.
-
Dynamic incorporation of multiple in silico functional annotations empowers rare variant association analysis of large whole-genome sequencing studies at scale.Nat Genet. 2020 Sep;52(9):969-983. doi: 10.1038/s41588-020-0676-4. Epub 2020 Aug 24. Nat Genet. 2020. PMID: 32839606 Free PMC article.
-
Hierarchical Bayesian model for rare variant association analysis integrating genotype uncertainty in human sequence data.Genet Epidemiol. 2015 Feb;39(2):89-100. doi: 10.1002/gepi.21871. Epub 2014 Nov 13. Genet Epidemiol. 2015. PMID: 25395270
Cited by
-
The Role of Next-Generation Sequencing in Pharmacogenetics and Pharmacogenomics.Cold Spring Harb Perspect Med. 2019 Feb 1;9(2):a033027. doi: 10.1101/cshperspect.a033027. Cold Spring Harb Perspect Med. 2019. PMID: 29844222 Free PMC article. Review.
-
Cardioinformatics: the nexus of bioinformatics and precision cardiology.Brief Bioinform. 2020 Dec 1;21(6):2031-2051. doi: 10.1093/bib/bbz119. Brief Bioinform. 2020. PMID: 31802103 Free PMC article.
-
Gene Association Analysis of Quantitative Trait Based on Functional Linear Regression Model with Local Sparse Estimator.Genes (Basel). 2023 Mar 30;14(4):834. doi: 10.3390/genes14040834. Genes (Basel). 2023. PMID: 37107592 Free PMC article.
-
MARV: a tool for genome-wide multi-phenotype analysis of rare variants.BMC Bioinformatics. 2017 Feb 16;18(1):110. doi: 10.1186/s12859-017-1530-2. BMC Bioinformatics. 2017. PMID: 28209135 Free PMC article.
-
Recent advances and challenges of rare variant association analysis in the biobank sequencing era.Front Genet. 2022 Oct 6;13:1014947. doi: 10.3389/fgene.2022.1014947. eCollection 2022. Front Genet. 2022. PMID: 36276986 Free PMC article. Review.
References
-
- Amos CI, Laing A: A comparison of univariate and multivariate tests for genetic linkage. Genet Epidemiol 1993; 10: 671–676. - PubMed
Publication types
MeSH terms
Substances
Grants and funding
LinkOut - more resources
Full Text Sources
Other Literature Sources
