. 2017 May 23;112(10):2159-2172.
doi: 10.1016/j.bpj.2017.03.040.

New Continuum Approaches for Determining Protein-Induced Membrane Deformations

Affiliations

New Continuum Approaches for Determining Protein-Induced Membrane Deformations

David Argudo et al. Biophys J. .

Abstract

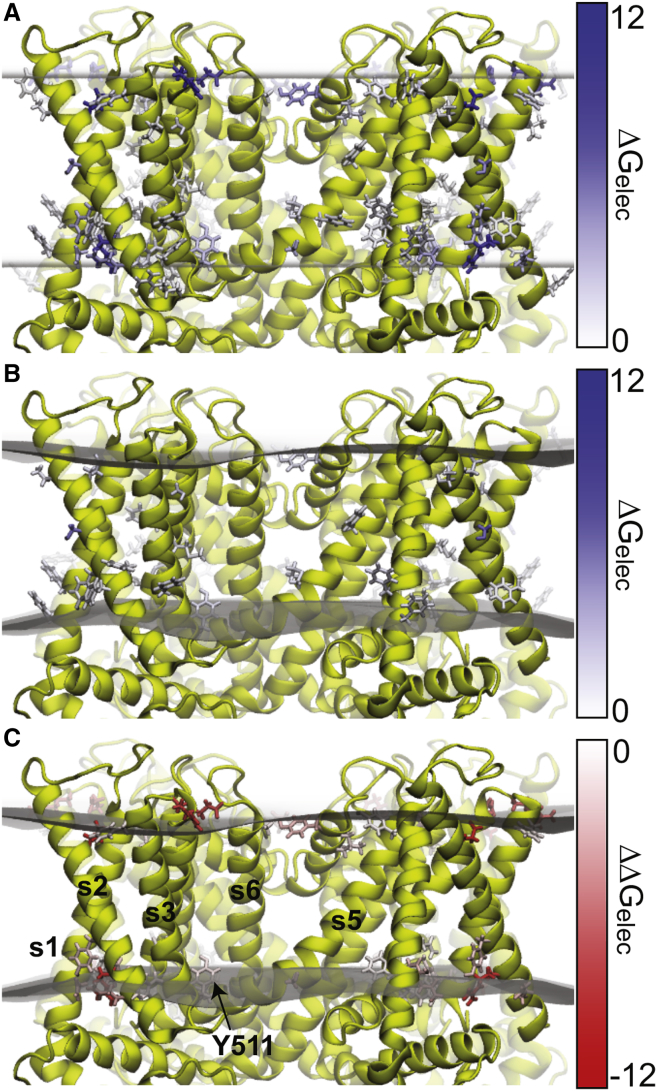
The influence of the membrane on transmembrane proteins is central to a number of biological phenomena, notably the gating of stretch activated ion channels. Conversely, membrane proteins can influence the bilayer, leading to the stabilization of particular membrane shapes, topological changes that occur during vesicle fission and fusion, and shape-dependent protein aggregation. Continuum elastic models of the membrane have been widely used to study protein-membrane interactions. These mathematical approaches produce physically interpretable membrane shapes, energy estimates for the cost of deformation, and a snapshot of the equilibrium configuration. Moreover, elastic models are much less computationally demanding than fully atomistic and coarse-grained simulation methodologies; however, it has been argued that continuum models cannot reproduce the distortions observed in fully atomistic molecular dynamics simulations. We suggest that this failure can be overcome by using chemically and geometrically accurate representations of the protein. Here, we present a fast and reliable hybrid continuum-atomistic model that couples the protein to the membrane. We show that the model is in excellent agreement with fully atomistic simulations of the ion channel gramicidin embedded in a POPC membrane. Our continuum calculations not only reproduce the membrane distortions produced by the channel but also accurately determine the channel's orientation. Finally, we use our method to investigate the role of membrane bending around the charged voltage sensors of the transient receptor potential cation channel TRPV1. We find that membrane deformation significantly stabilizes the energy of insertion of TRPV1 by exposing charged residues on the S4 segment to solution.


Figures

Figure 1
Figure 1
Continuum membrane model for proteins of arbitrary shape. (A) Shown here is a wide view of membrane deformation around an embedded membrane protein from the continuum model. The membrane headgroup-tail interfaces are shown as gray surfaces, where h+(x,y) describes the upper leaflet shape and h(x,y) describes the lower leaflet shape. The membrane dividing (compression) surface CM is shown by the dashed line and the unperturbed membrane thickness is labeled L0. The protein is shown in molecular surface representation. Residues are blue and white for hydrophilic and hydrophobic residues, respectively. (B) Given here is the top-down view of grid used in membrane solver. The blue area denotes the region where the upper and lower leaflets are matched ΩM, meaning u+ = h+L0/2 and u = h + L0/2 are defined. The red areas near the boundary correspond to the unmatched Ω1 region where only the lower leaflet variable u is defined. The black areas near the boundary represent the unmatched region Ω2 where only the upper leaflet variable u+ is defined and r2 is the normal vector to the curve describing the protein/upper-monolayer interface. For illustrative purposes, the grid spacing has been enlarged and truncated around the protein. To see this figure in color, go online.
Figure 2
Figure 2
Comparison of protein-induced membrane deformations from molecular dynamics and continuum elasticity. (AC) Shown here are the average membrane height profiles for the upper leaflet (A), lower leaflet (B), and hydrophobic thickness (C) from one 250-ns MD simulation of gramicidin in a POPC bilayer. (D)–(F) show the corresponding continuum membrane surfaces. For the continuum calculations (D)–(F), we used boundary conditions at the protein-membrane boundary and at the edges of the box that were extracted from the MD data in (A)–(C). The region where the membrane is compressed near the protein (compression ring) can be clearly seen in the hydrophobic mismatch panels of both the MD (C) and continuum calculations (F). Dashed arc line in (C) shows a 55 Å radial distance measured from the center of the protein. White asterisks show the location of maximum difference between leaflet heights calculated using simulation (A) and (B) when compared to continuum (D) and (E). For reference, in Fig. S8 we show the gramicidin-induced membrane deformations calculated using our hybrid-atomistic model without any input from MD. To see this figure in color, go online.
Figure 3
Figure 3
The continuum model predicts the correct protein orientation in the membrane. Given here is the orientation of gramicidin in the membrane predicted from MD simulations (A), our hybrid continuum-atomistic model (Eq. 1) (B), and the continuum model without membrane bending (C). In all panels, the heat map on the left shows the probability of finding gramicidin at specific tilt θ and rotation ρ-angles, where θ is the angle between the z axis and the long axis of the helix, and ρ corresponds to rotation about the long axis of the channel. To define the rotation ρ, we use as reference points the projection of the z axis together with the vector formed by the helical principal axis and the Cα position in residue W9 (16). The most probable configuration has been marked with a white asterisk (). The right panel shows the protein configuration corresponding to the most probable configuration, as well as the pictorial description of θ and ρ. Probabilities were obtained by calculating the energy at each orientation, then using Boltzmann weighting to convert the energies to probabilities. To see this figure in color, go online.
Figure 4
Figure 4
Comparison of protein-membrane boundary distortions from the continuum model and MD simulation. Given here are the membrane height values at the protein-membrane boundary for the upper leaflet (A) and lower leaflet (B). The dotted line corresponds to the average solution calculated from 32 protein snapshots by our continuum model. The blue and green solid lines are the average membrane height values from the two independent 250 ns MD simulations. The blue- and green-shaded regions correspond to MD solutions within 1 SD and the overlap between the blue- and green-shaded region has been highlighted in a darker color. The equilibrium height of the undeformed monolayer L0/2 is shown by dashed lines. (C) Shown here are the membrane surface profiles calculated from the model. The angular coordinate in (A) and (B) are with respect to the x axis shown here. The protein-membrane boundaries align with the indole nitrogens of the tryptophans and the hydroxyl of the terminal ethanolamine. The right view corresponds to a 180° rotation about the z axis. To see this figure in color, go online.
Figure 5
Figure 5
The hybrid continuum-atomistic model predicts that TRPV1 deforms the membrane. (A) Shown here are the electrostatic membrane insertion penalties for membrane-exposed residues when the membrane is represented as a rigid slab. Hydrophobic interfaces are shown as transparent surfaces. Residues are colored by electrostatic insertion penalty. We calculate this penalty as the electrostatic energy of the protein in membrane minus the electrostatic energy of the protein in solution. (B) Electrostatic insertion penalty after the membrane is allowed to deform. In (A) and (B), only residues with a penalty >1 kcal/mol are shown. (C) Given here is the reduction in electrostatic penalty after the membrane is allowed to deform. This is the penalty of (A) subtracted from the penalty in (B). For clarity, only residues with reductions >1 kcal/mol are shown. Tyr-511 and TM helices are labeled. To see this figure in color, go online.

References

    1. Zimmerberg J., Kozlov M.M. How proteins produce cellular membrane curvature. Nat. Rev. Mol. Cell Biol. 2006;7:9–19. - PubMed
    1. Andersen O.S., Koeppe R.E., 2nd, Koeppe E. Bilayer thickness and membrane protein function: an energetic perspective. Annu. Rev. Biophys. Biomol. Struct. 2007;36:107–130. - PubMed
    1. Argudo D., Bethel N.P., Grabe M. Continuum descriptions of membranes and their interaction with proteins: towards chemically accurate models. Biochim. Biophys. Acta. 2016;1858:1619–1634. - PMC - PubMed
    1. Urry D.W. The gramicidin A transmembrane channel: a proposed pi(L,D) helix. Proc. Natl. Acad. Sci. USA. 1971;68:672–676. - PMC - PubMed
    1. Perozo E., Cortes D.M., Martinac B. Open channel structure of MscL and the gating mechanism of mechanosensitive channels. Nature. 2002;418:942–948. - PubMed