. 2017 May 23;19(8):1503-1511.
doi: 10.1016/j.celrep.2017.04.074.

Proliferation Drives Aging-Related Functional Decline in a Subpopulation of the Hematopoietic Stem Cell Compartment

Affiliations

Proliferation Drives Aging-Related Functional Decline in a Subpopulation of the Hematopoietic Stem Cell Compartment

Kristina Kirschner et al. Cell Rep. .

Abstract

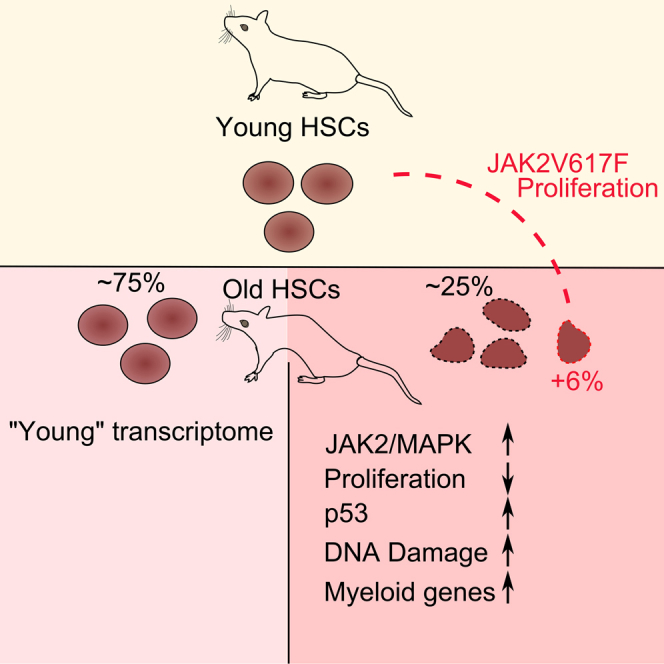
Aging of the hematopoietic stem cell (HSC) compartment is characterized by lineage bias and reduced stem cell function, the molecular basis of which is largely unknown. Using single-cell transcriptomics, we identified a distinct subpopulation of old HSCs carrying a p53 signature indicative of stem cell decline alongside pro-proliferative JAK/STAT signaling. To investigate the relationship between JAK/STAT and p53 signaling, we challenged HSCs with a constitutively active form of JAK2 (V617F) and observed an expansion of the p53-positive subpopulation in old mice. Our results reveal cellular heterogeneity in the onset of HSC aging and implicate a role for JAK2V617F-driven proliferation in the p53-mediated functional decline of old HSCs.

Keywords: JAK2; aging; cancer; cellular aging; genomics; hematology; leukemia; p53; scRNA-seq; stem cells.


Figures

None
Graphical abstract
Figure 1
Figure 1
LT-HSCs Display a Distinct Subpopulation with Age (A) Sorting strategy for HSCs. (B) SC3 clustering of young and old HSC transcriptomes. Replicates: purple and green bars. Age: orange (young) and turquoise (old) bars. Similarity between cells is indicated from blue to red (identical). Rep, replicate. (C) Heatmap of top ten marker genes of cluster 1. Expression is shown from blue (low) to red (high). (D) Silhouette plots for all clusters. The silhouette index (si) and the number of cells per cluster are given. xSi, average silhouette index. (E) Boxplots for ESLAM marker intensity for old-specific (blue) and other old (red) HSCs. Rel. Expr., relative expression. (F) SCDE plots for marker genes of cluster 1 in young (blue) and old (orange) HSCs. Expression levels of individual cells are indicated by individual lines. See also Supplemental Experimental Procedures.
Figure 2
Figure 2
Age-Specific Cluster Carries Signature of Pro-proliferative and Anti-proliferative Stimuli (A) Manual annotation of top 20 marker genes with Ras senescence (RIS), apoptosis (Kirschner et al., 2015), and pStat3 and pStat5 datasets (Lau et al., 2015). Red indicates p53, and green indicates pStat targets. (B) KEGG pathway analysis of marker genes for old-specific cluster. Selected pathways are shown as ratio of enrichment (green indicates pro-proliferative, and red indicates anti-proliferative). (C) GSEA for p53 RIS, apoptosis (Apo), and STAT3 and STAT5 targets. p values and enrichment scores are shown. (D) Schematic of TPO-regulated microarray experiment in HPC7. GSEA of TPO-specific targets and marker gene list. (E) IF quantification of old HSCs for p53Ser15 and/or gH2AX (n = 3; error bars indicate SEM). (F) Quantification of EdU (5-ethynyl-2′-deoxyuridine) incorporation, gH2AX, and p53 in old HSCs (n = 3; error bars indicates SEM). (G) GSEA for lineage markers. ChIP, chromatin immunoprecipitation, MA, microarray; TGF, transforming growth factor; n.s., not significant; nb, number of genes.
Figure 3
Figure 3
Constitutively Active JAK2 Increases Cell Contribution to the Old-Specific Subpopulation (A) Kinetics of JAK2V617F and WT HSCs. Ratios of JAK2V617F and WT for indicated divisions in young (black) and old (gray) HSCs. Black line denotes WT levels (n = 3; error bars indicate SEM). Mut, mutated. (B) Kinetics data from young (upper row) and old (lower row) WT (blue) and homozygous (Hom) JAK2V671F (red) HSCs. Percentage of all cells upon division (n = 3; error bars indicate SEM). hrs, hours. (C) SC3 clustering of HSC transcriptomes from young (yg; upper orange bars) and old (upper turquoise bars) WT (lower orange bars) and JAK2V617F (lower turquoise bars) mice. Replicates are indicated in green and red. Similarity between cells is indicated from blue to red (identical). (D) SC3 clustering of old HSC transcriptomes from WT and JAK2V617F mice (replicate 1). Overlap with marker genes is given as a percentage. Cell number for old-specific HSCs is given as a percentage of all old HSCs. (E) Immunofluorescent images of old WT and JAK2V617F HSCs stained for pSer15p53 (green), pSer27FosB (red), and DAPI (blue). Bar plots quantify the percentage of double-positive HSCs from indicated mice (n = 3; error bars indicate SEM). (F) SC3 clustering of 1-year-old WT and JAK2V617F HSCs. Similarity between cells is indicated from blue to red (identical). Overlap with marker genes is shown in percentages. (G) Model for relation between proliferation and functional decline of HSCs. Compared are physiological (upper row) against enforced proliferation through JAK2V617F (lower row). Young HSCs in the JAK2 condition expand faster (number of cells) but exhaust more readily upregulating p53- and cyclin-dependent kinase inhibitors (CDKNs; shades of red). Arrow cycle indicates self-renewal.

References

    1. Baxter E.J., Scott L.M., Campbell P.J., East C., Fourouclas N., Swanton S., Vassiliou G.S., Bench A.J., Boyd E.M., Curtin N. Acquired mutation of the tyrosine kinase JAK2 in human myeloproliferative disorders. Lancet. 2005;365:1054–1061. - PubMed
    1. Beauséjour C.M., Krtolica A., Galimi F., Narita M., Lowe S.W., Yaswen P., Campisi J. Reversal of human cellular senescence: roles of the p53 and p16 pathways. EMBO J. 2003;22:4212–4222. - PMC - PubMed
    1. Beckerman R., Prives C. Transcriptional regulation by p53. Cold Spring Harb. Perspect. Biol. 2010;2:a000935. - PMC - PubMed
    1. Beerman I., Maloney W.J., Weissmann I.L., Rossi D.J. Stem cells and the aging hematopoietic system. Curr. Opin. Immunol. 2010;22:500–506. - PMC - PubMed
    1. Bernitz J.M., Kim H.S., MacArthur B., Sieburg H., Moore K. Hematopoietic stem cells count and remember self-renewal divisions. Cell. 2016;167:1296–1309.e10. - PMC - PubMed

Publication types