. 2017 May 23;19(8):1586-1601.
doi: 10.1016/j.celrep.2017.04.069.

Wolf-Hirschhorn Syndrome Candidate 1 Is Necessary for Correct Hematopoietic and B Cell Development

Affiliations

Wolf-Hirschhorn Syndrome Candidate 1 Is Necessary for Correct Hematopoietic and B Cell Development

Elena Campos-Sanchez et al. Cell Rep. .

Abstract

Immunodeficiency is one of the most important causes of mortality associated with Wolf-Hirschhorn syndrome (WHS), a severe rare disease originated by a deletion in chromosome 4p. The WHS candidate 1 (WHSC1) gene has been proposed as one of the main genes responsible for many of the alterations in WHS, but its mechanism of action is still unknown. Here, we present in vivo genetic evidence showing that Whsc1 plays an important role at several points of hematopoietic development. Particularly, our results demonstrate that both differentiation and function of Whsc1-deficient B cells are impaired at several key developmental stages due to profound molecular defects affecting B cell lineage specification, commitment, fitness, and proliferation, demonstrating a causal role for WHSC1 in the immunodeficiency of WHS patients.

Keywords: B cell development; H3K36 methylation; Wolf-Hirschhorn syndrome; cell cycle; class-switch recombination; hematopoiesis; hematopoietic stem cells; immunodeficiency; replicative stress.


Conflict of interest statement

COMPETING FINANCIAL INTERESTS

The authors declare no competing financial interests.

Figures
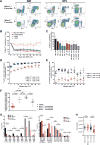
Figure 1
Figure 1
Lymphoid and hematopoietic differentiation is impaired in Whsc1+/− and Whsc1−/− cells. (A) Representative FACS plots (out of a total of 10 experiments) of aged WT and Whsc1+/− mice, showing the reduction in the percentages of Whsc1+/− B and T cells. (B) Disadvantage of Whsc1+/− hematopoietic cells in a competitive BM reconstitution assay. The vertical axis shows the percentage of contribution of the indicated Whsc1+/− cell types to the peripheral blood of recipient mice injected with a 1:1 mix of WT:Whsc1+/− cells, as determined by flow cytometry of peripheral blood samples at the times indicated on the “x” axis. Mean ± SEM are shown (C) Percentage of contribution of the indicated Whsc1+/− cell types in recipient mice injected with a 1:1 mix of WT:Whsc1+/− cells, 3–6 months after injection. n = 5 mice for each time point. Mean ± SD are shown. (D) Kinetic delay in the reconstitution of the peripheral blood cellularity by Whsc1−/− cells (red) in comparison with Whsc1+/− (blue) or WT (black) cells, monitored by flow cytometry over 30 weeks after fetal liver transplantation. The vertical axis represents the percentage of donor cells in the peripheral blood of recipient mice at the indicated time points. n= number of mice analyzed. Mean ± SD are shown. (E) Reduced percentage of B cells of Whsc1−/− donor origin in peripheral blood, with time, as indicated in previous panel. Mean ± SD are shown. (F) Reduced absolute numbers of total blood lymphocytes in mice reconstituted with Whsc1−/− donor cells, as measured by automatic hematic biometry. Samples are from mice reconstituted with either Whsc1−/− (red dots), Whsc1+/− (blue diamonds), or WT (black filled squares) cells, 2 months after FLT, or from non-reconstituted, normal age-matched C57Bl/6 control animals (black hollow squares). Mean ± SD are shown. (G) Percentages of the different developmental stages of hematopoietic cells in the BM and spleen from mice reconstituted with either WT or Whsc1−/− cells, 3–6 months after transplant: B cell developmental stages (left graph) and other hematopoietic cell types (right graph). Mean ± SD are shown. (H) Total cellularity of BM and spleen of reconstituted mice. n = number of mice analyzed. Mean ± SEM are shown. See also Figures S1, S2 and S3.
Figure 2
Figure 2
Whsc1−/− cells are outcompeted in competitive transplantation. (A) Vertical axis shows the drastically reduced percentage of contribution of the indicated Whsc1−/− cell types to the peripheral blood of recipient mice injected with a 1:1mix of WT:Whsc1−/− cells, as determined by flow cytometry of peripheral blood samples at the weeks indicated on the “x” axis. (B, C) Percentage of contribution of the indicated Whsc1−/− cell types in recipient mice injected with a 1:20 mix of WT:Whsc1−/− cells, 3 months (B) or 7 months (C) after injection. The panels show the drastic reduction of B cell developmental stages beyond proB cells, and the decrease in LSK cells with time. n = 2 or 5 mice (3 and 7 months, respectively). Mean ± SD are shown. See also Figure S2.
Figure 3
Figure 3
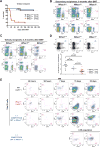
Impaired functionality of Whsc1−/− HSCs. (A) Kaplan-Meier survival plot of recipients of a 3ary serial BMT of cells of the indicated genotypes, showing the exhausted reconstitutive capacity of Whsc1−/− cells. n = number of transplanted animals. (B) PB from mice reconstituted with a secondary serial transplant of either WT, Whsc1+/−, or Whsc1−/− cells, 6 months after transplant. Data shown are representative FACS plots, out of at least 14 Whsc1+/− and 31 Whsc1−/−-reconstituted mice independently analyzed, from 3 different donors. (C) PB from mice reconstituted with a tertiary serial transplant of either WT, Whsc1+/−, or Whsc1−/− cells, 3.5 months after transplant. Data shown are representative FACS plots, out of at least 8 Whsc1+/− and 17 Whsc1−/−-reconstituted mice independently analyzed, from 3 different donors. (D) Percentages of LSK cells in the BM of recipients of cells of the indicated genotypes, 6–8 weeks after transplantation with fetal liver cells from littermate embryos of the indicated genotypes. FACS plots are representative of the data summarized in the graph below (mean ± SD). (E) Short-term engraftment of Whsc1−/− cells into irradiated Ly5.1/Ly5.2 heterozygous recipients. First two rows: kinetics of short-term B cell reconstitution in the BM of mice injected with either WT or Whsc1−/− cells. FACS plots are gated in total B220+ cells. Third row: competitive kinetics of short-term B cell reconstitution in the BM of mice injected with a 1:1 mix of WT:Whsc1−/− cells. FACS plots are gated in total B220+ cells. Lower row: kinetics of short-term reconstitution, at 15 and 30 days, of LSK cells in the BM of mice injected with a 1:1 mix of WT:Whsc1−/−cells. The whole experiment was repeated twice with similar results. See also Figure S3.
Figure 4
Figure 4
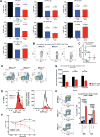
Impaired CSR in Whsc1−/− B cells. (A) Differences in the percentages of class-switched B cells depending on their genotype, expressed as percentages relative to WT cells (left black bar, 100%). The stimuli used and the switched immunoglobulin subtypes measured are indicated. n = number of independent experiments performed. p values refer to a two-sided Student’s t test vs. WT. Mean ± SD are shown. (B) Reduction of in vivo splenic Ig-switched GC B cells (pre-gated as B220+,PNA+,FAS+) in Whsc1+/+, Whsc1+/− or Whsc1−/− recipients. Spleens were analyzed 13 days after immunizing with SRBCs recipient mice reconstituted with cells of the indicated phenotypes. FACS plots are representative of the data summarized in the graph shown in the next panel (mean ± SD). (C) Graphical representation and statistical analysis of the percentages of in vivo IgG1+ cells for each genotype. Mean ± SD are shown. (D) Whsc1−/− cells can give rise to plasma cells; representative FACS plots are shown from three independent replicate experiments analyzing the spleen of mice reconstituted with the indicated genotypes. (E) FACS histogram showing the deconvolution, after 72 hours of stimulation with LPS, of the total cellular population in the different generations of cells, using the dilution of the CellTrace dye to separate the cells according to the number of times they have divided. The “y” axis scale in the left histogram is expressed as percentage related to the maximum, and in the right histogram is expressed as absolute numbers of cells. G0 to G4 = generations of cells. (F) Evolution of the percentage of either WT or Whsc1−/− ex vivo LPS-stimulated Ly5.2+ B cells, in competition against WT Ly5.1+ B cells, along the different generations, and relative to the initial percentage when plated. Mean ± SD are shown. (G) Reduced absolute numbers of Whsc1−/− cells obtained 72 hours after stimulation of splenic B cells in absence of competition, in the presence of a defined number of microbeads. (H) Percentages of apoptotic B cells after 48h or 72h in culture under LPS-stimulation. Left: gating strategy and representative plots of cells after 48h in culture. C57Bl6 refers to cells from WT non-reconstituted animals (n=7), while the other two lanes show plots of mice reconstituted with either WT (n=3) or Whsc1−/− (n=9) cells. Right: bar graph plot summarizing the data. See also Figure S4.
Figure 5
Figure 5
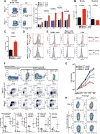
Cell cycle alterations and DNA damage accumulation in Whsc1−/− cells. (A) FACS analysis of cell cycle in ex vivo LPS-stimulated, BrdU-labelled B cells. 72 hours after stimulation, cell culture medium was supplemented with BrdU and cells were harvested 1 hour later. Leftmost panels show the total incorporation of BrdU and the dilution of CellTrace. Central panels display the cell cycle profile (BrdU vs. 7AAD) for the generation 3 (G3) of cells, showing the 3-fold increased percentage of Whsc1−/−cells in the S phase. Bar graph shows the percentage of cells in S phase for each generation for the three indicated genotypes. Bars represent mean ± SD. n = number of independent experiments. (B) 3-fold increased percentage of Whsc1−/− total B cells in the S phase in vivo in the BM, and absence of changes in myeloid cells Mice were intraperitoneally injected with BrdU and sacrificed after two hours. Bar graphs represent the mean ± SD. (C) Increased BrdU incorporation in vivo by BM Whsc1−/−LSK cells. Bar graphs represent the mean ± SD. (D) Histograms showing the increased levels of γH2AX accumulation in ex vivo LPS-stimulated Whsc1−/− B cells, in comparison with either WT or Whsc1+/− B cells, as determined by flow cytometry. (E) Increased levels of γH2AX in vivo in total BM Whsc1−/− B cells and LSK cells, in comparison with WT counterparts. Whsc1−/− myeloid cells do not present abnormal γH2AX levels, and neither do Whsc1+/− BM cells. Representative plots are shown. (F) Cell cycle analysis through the different stages of B cell development in the BM. Upper row: gating strategy for BM B cell compartments (cells were fixed for cell cycle studies). Middle rows: representative FACS plots for WT and Whsc1−/− cells. Lower graphs: percentages of cells in S-phase for the indicated BM B cell compartments, as determined by in vivo incorporation of BrdU. (G) Impaired proliferation of Whsc1+/− and Whsc1−/− MEFs. Growth curves of freshly prepared MEFs of the indicated genotypes showing the reduced proliferative capacity of Whsc1−/− cells. Representative analyses are shown out of three independent experiments with a total of 17 MEF preparations (4Whsc1+/+, 5 Whsc1+/− and 8 Whsc1−/− embryos). (H) Impaired DNA damage repair in Whsc1−/− MEFs. WT and Whsc1−/− MEFs were irradiated with 5 Gy and γH2AX levels were measured after 1 and 5 hours. Whsc1−/− MEFs cannot efficiently remove gamma irradiation-induced γH2AX accumulation, while WT MEFS have reverted to normal levels of γH2AX within 5 hours after exposure. One representative analysis is shown out of three independent experiments with a total of 12 MEF preparations (6 Whsc1+/+and 6 Whsc1−/− embryos). See also Figure S5.
Figure 6
Figure 6
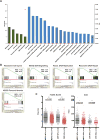
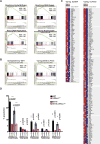
Severe alteration of biological processes in Whsc1−/− GC B cells (A) Threshold-based functional pathway analysis for the differentially expressed genes in GC B cells (Whsc1−/− vs. WT) with DAVID. Selected KEGG (green) and GO (blue) pathways are represented. Bars represent the antilogarithm of the adjusted P value (left vertical axis). Red dots represent the False Discovery Rate for the corresponding pathways (right vertical axis). (B) Gene Set Enrichment Analysis (GSEA) plots for the indicated genesets, (see their corresponding heatmaps in Figure S5B). The GSEA comparison was performed [WT minus Whsc1−/−], so the genes downregulated in the Whsc1−/− cells appear at the left of the scale on each graph, and those upregulated appear at the right side. Therefore genesets downregulated in Whsc1−/− cells have a positive Normalized Enrichment Score (NES), and genesets upregulated in Whsc1−/−cells have a negative NES. (C) Impaired DNA replication of Whsc1−/− MEFs and CSR-B cells, as determined by DNA fiber analysis. Fork rate (left panel) in Kbps/min, and Inter Origin Distance, (IOD, right panel) in Kpbs were measured for either MEFs (two leftmost columns in every graph) or CSR-stimulated B cells (two right columns) for WT (grey) or Whsc1−/− (red) cells. n= number of different clones (donors). Horizontal bar represents the median for each data column. See also Figures S5 and S6.
Figure 7
Figure 7
Downregulation of essential B cell genes in developmentally impaired Whsc1−/− BM proB cells (A) Gene Set Enrichment Analysis (GSEA) plots for the indicated genesets for the differentially expressed genes in Whsc1−/− vs. WT BM proB cells, (see their corresponding heatmaps in Figure S7A). The GSEA comparison was performed [WT minus Whsc1−/−], so the genes downregulated in the Whsc1−/− cells appear at the left of the scale on each graph, and those upregulated appear at the right side. Therefore genesets downregulated in Whsc1−/− cells have a positive Normalized Enrichment Score (NES), and genesets upregulated in Whsc1−/− cells have a negative NES. (B) GSEA plots for the genesets corresponding to genes upregulated by either Ebf1 or Pax5 during normal early B cell development (see main text for the generation of the lists of genes). The GSEA analysis shows the global decrease in the levels of expression of these genes in Whsc1−/− proB cells. (C) Partial heatmaps corresponding to the GSEA analyses shown in panel B. For clarity, only the part corresponding to the genes that become downregulated in Whsc1−/− proB cells is shown. The full heatmaps can be seen in Figure S7B. (D) The introduction of a rearranged VHDHJH B1–8 allele in the Whsc1−/− proB cells does not rescue the leaky developmental block at the proB-to-preB cell transition. The bar graph represents the percentages of the indicated B cell developmental stages in the BM of recipient mice transplanted with cells of the indicated genotypes. n: number of mice analyzed. See also Figure S7.

Similar articles

Cited by

References

    1. Andricovich J, Kai Y, Peng W, Foudi A, Tzatsos A. Histone demethylase KDM2B regulates lineage commitment in normal and malignant hematopoiesis. J Clin Invest. 2016;126:905–920. - PMC - PubMed
    1. Battaglia A, Carey JC, South ST. Wolf-Hirschhorn syndrome: A review and update. Am J Med Genet C Semin Med Genet. 2015;169:216–223. - PubMed
    1. Battaglia A, South S, Carey JC. Clinical utility gene card for: Wolf-Hirschhorn (4p-) syndrome. Eur J Hum Genet. 2011;19 - PMC - PubMed
    1. Bergemann AD, Cole F, Hirschhorn K. The etiology of Wolf-Hirschhorn syndrome. Trends Genet. 2005;21:188–195. - PubMed
    1. Cobaleda C, Schebesta A, Delogu A, Busslinger M. Pax5: the guardian of B cell identity and function. Nat Immunol. 2007;8:463–470. - PubMed

Publication types

Substances