. 2017 May 23;19(8):1669-1684.
doi: 10.1016/j.celrep.2017.04.077.

Taxane-Platin-Resistant Lung Cancers Co-develop Hypersensitivity to JumonjiC Demethylase Inhibitors

Affiliations

Taxane-Platin-Resistant Lung Cancers Co-develop Hypersensitivity to JumonjiC Demethylase Inhibitors

Maithili P Dalvi et al. Cell Rep. .

Abstract

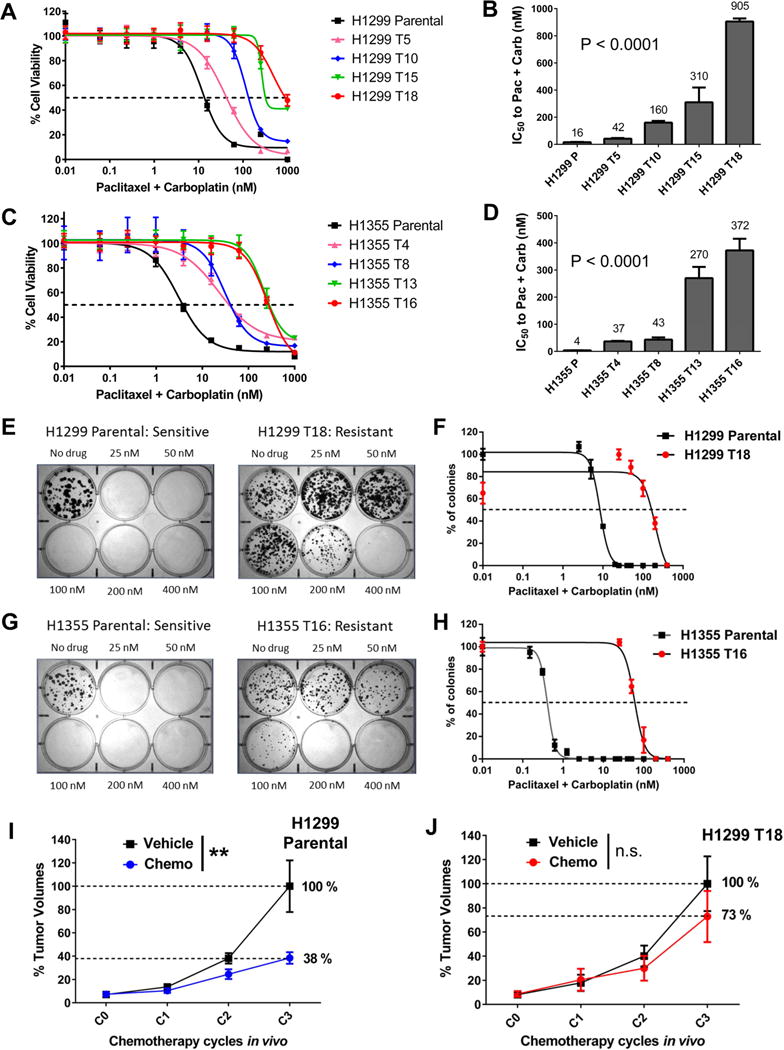
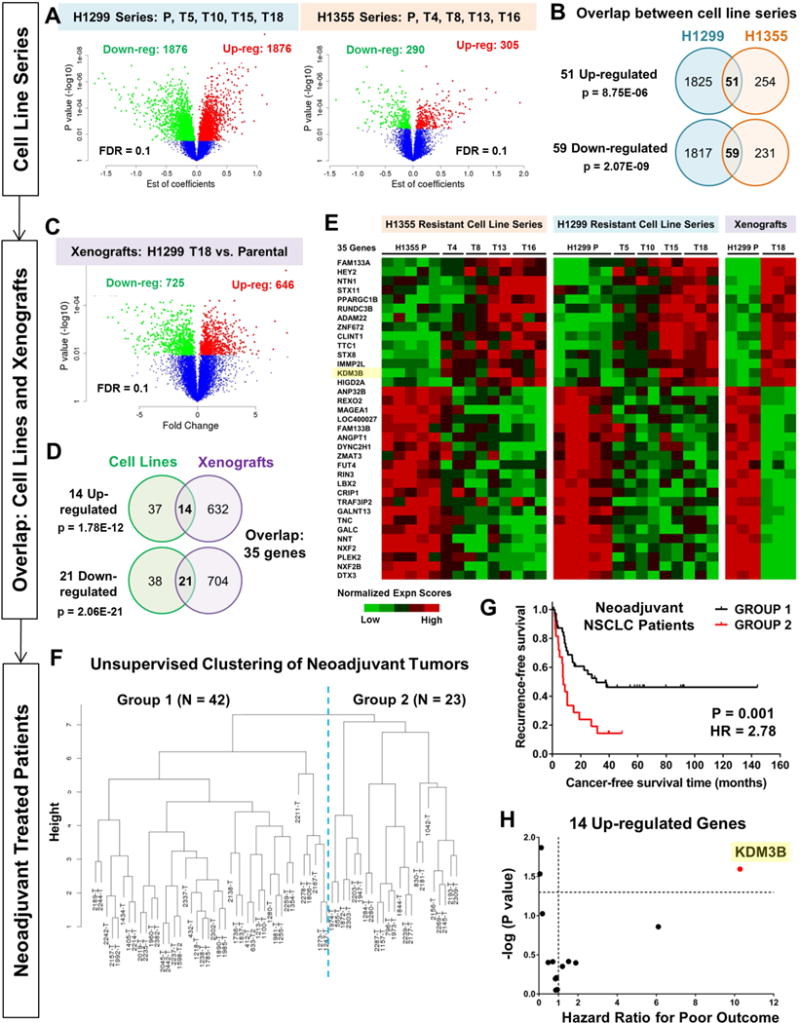
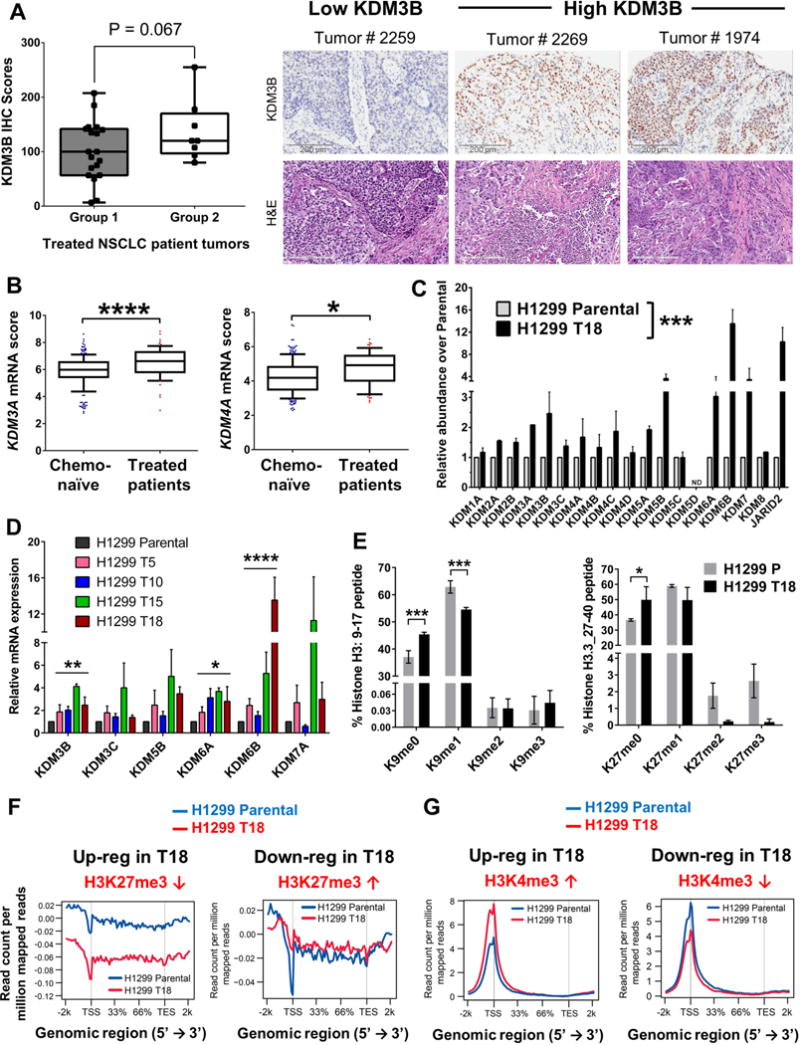
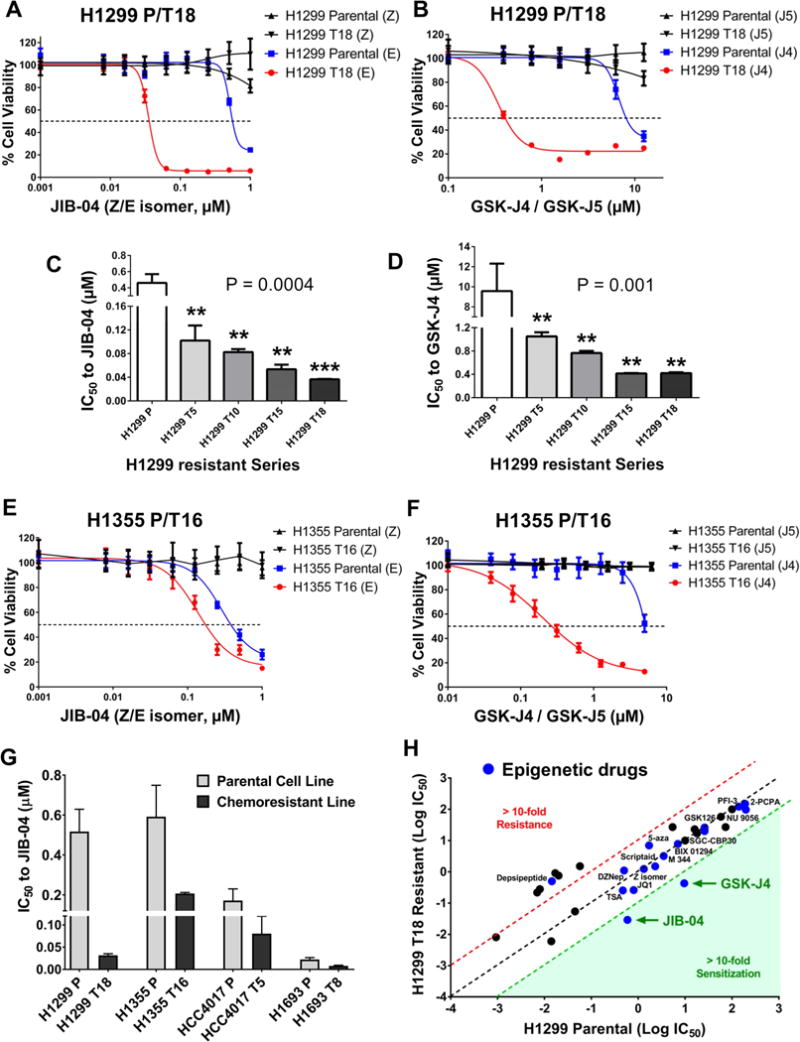
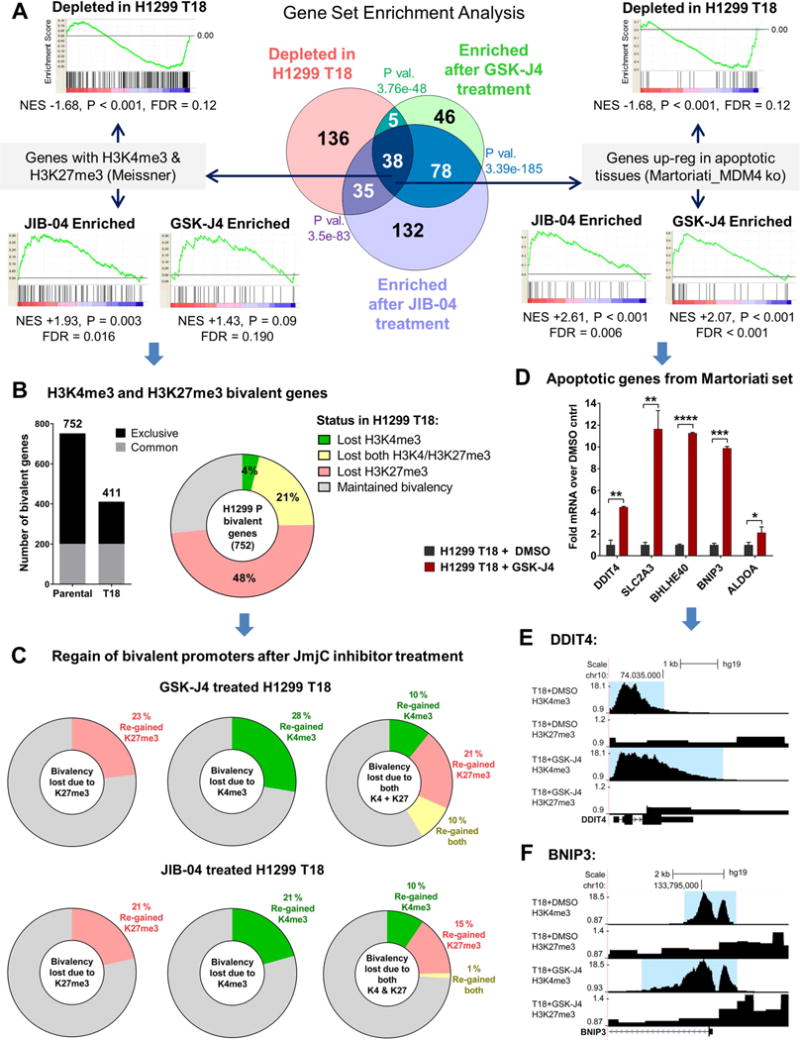
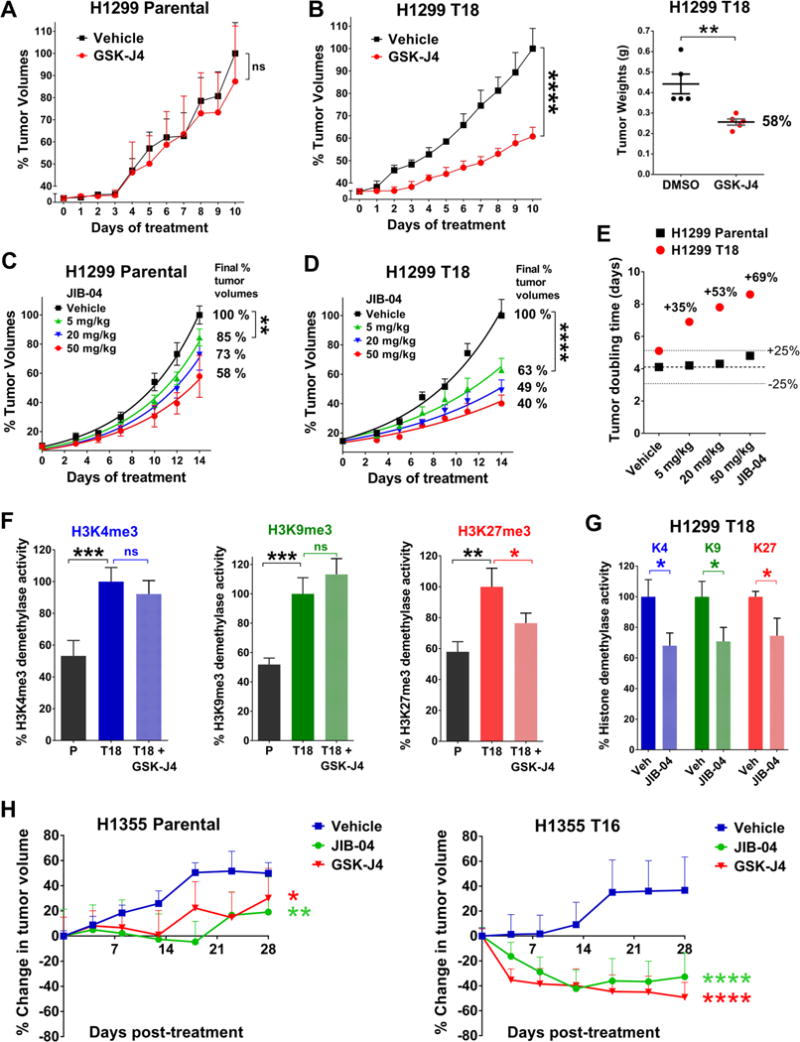
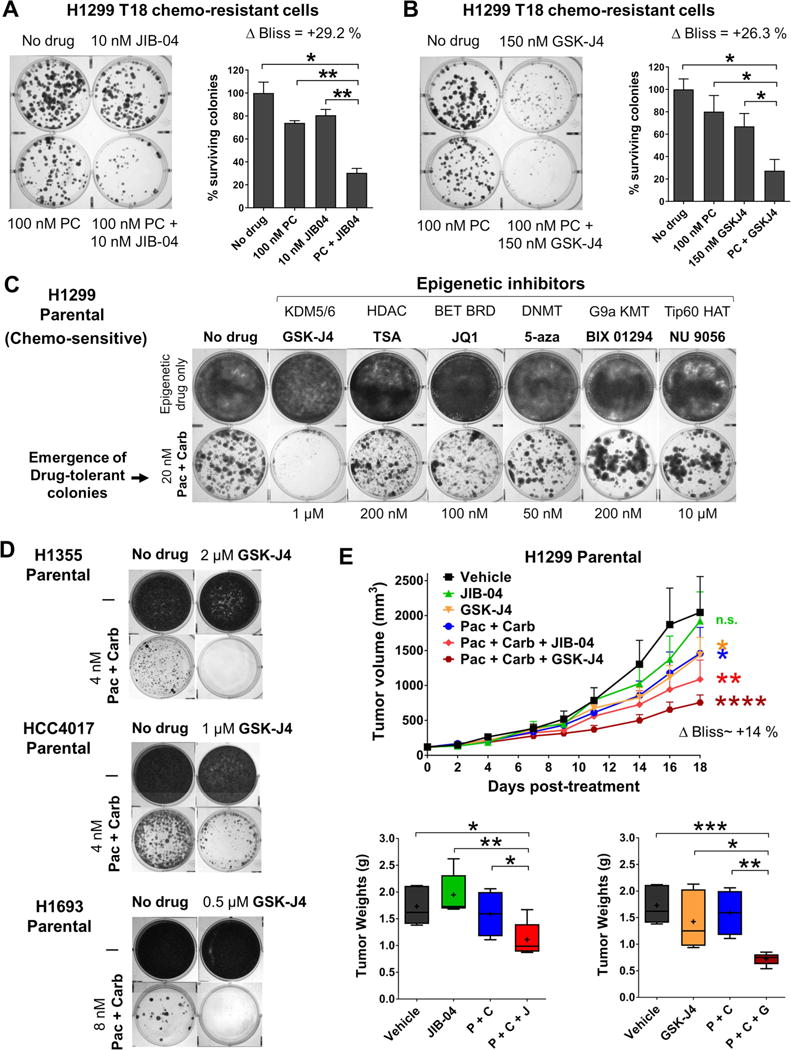
Although non-small cell lung cancer (NSCLC) patients benefit from standard taxane-platin chemotherapy, many relapse, developing drug resistance. We established preclinical taxane-platin-chemoresistance models and identified a 35-gene resistance signature, which was associated with poor recurrence-free survival in neoadjuvant-treated NSCLC patients and included upregulation of the JumonjiC lysine demethylase KDM3B. In fact, multi-drug-resistant cells progressively increased the expression of many JumonjiC demethylases, had altered histone methylation, and, importantly, showed hypersensitivity to JumonjiC inhibitors in vitro and in vivo. Increasing taxane-platin resistance in progressive cell line series was accompanied by progressive sensitization to JIB-04 and GSK-J4. These JumonjiC inhibitors partly reversed deregulated transcriptional programs, prevented the emergence of drug-tolerant colonies from chemo-naive cells, and synergized with standard chemotherapy in vitro and in vivo. Our findings reveal JumonjiC inhibitors as promising therapies for targeting taxane-platin-chemoresistant NSCLCs.

Keywords: GSK-J4; JIB-04; Jumonji demethylases; KDM; demethylase inhibitors; drug resistance; histone demethylases; histone methylation; lung cancer; taxane-platin chemotherapy.


Figures

Figure 1
Figure 1. Long-term treated NSCLC cell lines develop progressively increasing resistance to paclitaxel + carboplatin chemotherapy
(A, C) Dose response curves for NCI-H1299 and NCI-H1355 cells after long-term treatment with drug on/drug off cycles of paclitaxel + carboplatin. P: Parental cell line, T[n]: Resistant variant generated after ‘n’ cycles of doublet chemotherapy. Values on the X-axis indicate nM paclitaxel concentration in the drug combination (see Experimental Procedures for dosing details). Each data-point represents mean + SD of 8 replicates. (B, D) IC50 plots for H1299 and H1355 resistant cell line variants. IC50 values represent nM paclitaxel concentration in the 2:3 wt/wt drug combination. Data represents IC50 mean + SD of >4 replicate assays. P values are from post-test for linear trend following one-way ANOVA. (E, G) Resistance was validated in liquid colony formation assays. Representative plate images are shown. Drug values indicate nM concentration of paclitaxel in the 2:3 wt/wt doublet. (F, H) Dose response curves were generated by counting stained colonies from colony formation assays. For parental cell lines, additional plates were treated with lower doses from 40 nM highest. Error bars represent mean + SEM. (I, J) H1299 Parental and H1299 T18 tumor bearing mice were randomized (n=8 per group) to receive vehicle or docetaxel + cisplatin once a week, for 3 weeks. Tumor volumes were measured after each treatment cycle (C1, C2, C3). Error bars represent mean + SEM. Groups were compared using two-way ANOVA followed by Sidak’s multiple comparison tests. H1299 Parental xenografts, two-way ANOVA: **P=0.002, Sidak’s test at C3: ****P<0.0001; H1299 T18 xenografts, two-way ANOVA: P value not significant (n.s.). See Table S1 and related Fig S1, S2 and S3.
Figure 2
Figure 2. Gene signature from chemoresistant models clusters neoadjuvant treated NSCLC patients based on relapse-free outcome, and identifies KDM3B as a significant contributor to poor recurrence-free survival
(A) Linear regression model was fitted on microarray data to identify genes that were progressively up/down-regulated with increasing drug resistance. Parental cell lines (P) and four resistant variants per model were analyzed. Differentially expressed genes are represented in the volcano plots (red: up-regulated; green: down-regulated). FDR 0.1 (B) Common up- and down-regulated genes across the two resistant cell line series are shown. P values are from hypergeometric tests. (C) Differential gene expression analysis on xenograft microarray data (H1299 T18 resistant vs H1299 Parental) using student’s t-test. FDR 0.1 (D) Gene lists obtained from cell line and xenograft microarray analyses were overlapped to identify common genes (14 up-regulated, 21 down-regulated). P values are from hypergeometric tests. (E) Heat map representation of the expression pattern of 35-gene resistance signature in resistant cell lines and xenografts. (F) Using mRNA expression of 35 genes, unsupervised hierarchical clustering of neoadjuvant treated NSCLC patients (n=65, mainly taxane + platin treated) was found to separate the patients into two major groups. (G) Kaplan-Meier survival analysis of the two groups of neoadjuvant treated NSCLC patients revealed significant differences in cancer recurrence-free survival (P=0.001, Hazard Ratio=2.78, 95% CI, 1.46–5.29). Survival P value was adjusted for clinical covariates (Cox multivariate regression, Table S3). (H) Cox multivariate regression identified individual contributions of the 35 genes to poor recurrence-free survival (Table S4). X-axis depicts hazard ratios i.e. exp (regression coefficient) and Y-axis represents –log (P values) for the 14 up-regulated genes. KDM3B showed the largest hazard risk for poor recurrence-free patient survival (Hazard ratio=10.28, P=0.025). See Tables S2–S4.
Figure 3
Figure 3. Neoadjuvant-treated NSCLC patient tumors and chemoresistant cell lines exhibit elevated expression of JmjC histone lysine demethylases (KDMs) and altered histone methylation
(A) Group 2 of neoadjuvant treated patients (poor recurrence-free survival) showed higher KDM3B IHC scores compared to Group 1 patients. Representative images of KDM3B IHC and corresponding tumor H&E staining are shown. Scale bar = 200 μm (B) Chemotherapy-treated patient tumors showed higher mRNA expression scores of KDM3A and KDM4A than chemo-naïve tumors. Y-axis depicts Log2 normalized expression scores. The line indicates median value and whiskers the 10th and 90th percentiles. P values are adjusted after multivariate analysis of clinical variables; *P<0.05, ****P<0.0001 (C) Paclitaxel + carboplatin resistant H1299 T18 cell line showed increased mRNA expression of several JmjC KDMs compared to H1299 Parental, by qRT-PCR. Error bars=mean + SEM. Two-way ANOVA, ***P<0.001 (D) Isogenic H1299 resistant cells showed progressive increases in JmjC KDM expression. Error bars=mean + SEM. P values are from one-way ANOVA post-test for linear trend, *P<0.05, **P<0.01, ****P<0.0001. (E) Global changes in histone lysine methylation were measured by mass spectrometry. Y-axis denotes the % of the stated histone peptides (left, H3: 9–17; right, H3.3: 27–40) that showed K9 or K27 methylation respectively. Left panel error bars =mean + SEM, n=3. Right panel error bars=mean + SEM, n=2. P values are from Fisher’s LSD test post two-way ANOVA, *P<0.1, ***P<0.001. (F) H3K27me3 ChIP-Seq enrichment plots for up- and down-regulated genes identified by RNA-Seq (FDR 0.05) in H1299 T18 vs H1299 Parental cells. X-axis represents the genomic regions from 5′ to 3′ and the Y-axis represents read depth. (G) H3K4me3 average distribution plots for differentially expressed genes in H1299 T18 vs H1299 Parental cells (left panel upregulated, right panel downregulated genes). TSS, transcription start site; TES, transcription end site. See also Table S5 and Fig S4.
Figure 4
Figure 4. Chemoresistant cell lines show increased sensitivity to JmjC KDM inhibitors
(A, B) H1299 T18 cells showed hypersensitivity to JIB-04 active ‘E’ isomer (A) as well as GSK-J4 (B), compared to H1299 Parental. Inactive drug isomers (JIB-04 ‘Z’ isomer and GSK-J5) had no effect. Each data point represents mean + SD from 8 replicates per drug dose. (C, D) IC50 plots for H1299 resistant series. Data represents mean + SD. Statistical significance was tested by one-way ANOVA, followed by Dunnett’s multiple comparisons with H1299 Parental, **P<0.01, ***P<0.001. P values listed on graphs are from post-test for linear trend. (E, F) H1355 T16 resistant variant was hypersensitized to JIB-04 active ‘E’ isomer (E) and GSK-J4 (F) but not to inactive isomers, compared to H1355 Parental. Each data-point represents mean + SD from 8 replicates per drug dose. (G) IC50 values show general hypersensitivity of H1299 T18, H1355 T16, HCC4017 T5 and H1693 T8to JIB-04. Data represents mean + SEM. Two-way ANOVA, P<0.01. (H) Log10 IC50 values for standard, targeted and epigenetic drugs for H1299 T18 chemoresistant vs H1299 Parental cells. Epigenetic drugs (blue dots) include inhibitors of KDM, LSD1, HMT, HDAC, HAT, DNMT and BRD. Red dotted line denotes the 10-fold cut-off for cross-resistance and green dotted line is the 10-fold cut-off for sensitization. See also Fig S5–S6, Table S6.
Figure 5
Figure 5. JIB-04 and GSK-J4 cause reversal of deregulated transcriptional programs, regain of H3K4me3-H3K27me3 promoter bivalency and induction of pro-apoptotic genes in chemoresistant cells
(A) GSEA of differentially expressed gene lists from microarray against MSigDB curated gene sets revealed transcriptional programs that were depleted in H1299 T18 resistant vs H1299 Parental cells are enriched by 24 h treatment with JIB-04 (0.2 μM) or GSK-J4 (1 μM). P values signify overlap by hypergeometric tests. Two of the 38 overlapping gene sets are shown. Left: Genes with H3K4me3 and H3K27me3 (Meissner et al, M1941), Right: Genes up-regulated in apoptotic tissues (Martoriati et al, M5681). NES: Normalized Enrichment Score; P values under GSEA plots are nominal p-values. (B) ChIP-Seq analysis confirmed loss of bivalent genes in H1299 T18 vs. Parental cells. Number of bivalent genes (bar graph) and breakdown by lost or gain of marks (pie) are shown. (C) Genes in each of the bivalency lost categories depicted in the pie chart in (B) were probed for their regain status (at least a 1.5-fold increase) in GSK-J4 and JIB-04 treated H1299 T18 cells. (D) Genes from the Martoriati et al apoptotic gene set identified in (A) were confirmed to be up-regulated by GSK-J4 by RNA-seq. Error bars indicate mean + SEM from biological duplicates. Significance was tested using the powerful False Discovery Rate (q) approach of two-stage linear step-up procedure of Benjamini, Krieger and Yekutieli; *q<0.05, **q<0.01, ***q<0.001, ****q<0.0001. (E) ChIP-Seq traces for the pro-apoptotic, up-regulated gene DDIT4, showing increased H3K4me3 (blue highlight) in GSK-J4 vs DMSO treated H1299 T18 cells. (F) ChIP-Seq traces for BNIP3 up-regulated gene, showing broader H3K4me3 enrichment in GSK-J4 treated vs DMSO treated H1299 T18 cells. GSK-J4: 1 μM, 24 h for both (E) and (F). See also Fig S7–S8, Tables S7–S8.
Figure 6
Figure 6. JmjC inhibitor-treated chemoresistant tumors have lower histone demethylase activity and increased response to GSK-J4 and JIB-04 in vivo
(A, B) GSK-J4 treatment significantly reduced final tumor burden of H1299 T18 xenografts (B); response in H1299 Parental xenografts was not significant (A). Y-axis depicts % tumor volumes normalized to average vehicle tumor volume at the end of treatment. Data represent mean + SEM, n=5 mice per group. P values for tumor volume growth are from two-way ANOVA, ns = not significant, ****P<0.0001. Tumor weights (B, right) were compared using two-tailed unpaired t-test, **P=0.007. (C, D) At all doses, JIB-04 caused a greater percent reduction in H1299 T18 tumor volumes compared to H1299 Parental tumors. Data represent mean + SEM, n=6–8 mice per group. Y-axis depicts % tumor volumes normalized to average vehicle tumor volume on Day 14. Exponential growth curves were fitted using non-linear regression. Drug response was compared using two-way ANOVA. For 5 mg/kg vs. vehicle group in H1299 Parental: **P=0.001 and H1299 T18: ****P<0.0001. (E) JIB-04 treatment slowed tumor growth and increased doubling time of treated H1299 T18 tumors by 69%, with minimal effect on H1299 Parental tumors (<25% change). Doubling times were derived from exponential growth curves in (C, D). (F) H3K4/K9/K27 me3 demethylase activity in tumor lysates from GSK-J4 treated mice P values are from Fisher’s LSD test post one-way ANOVA. *P<0.1, **P<0.01, ***P<0.001. (G) JIB-04 treated H1299 T18 xenografts showed significant reduction in H3K4me3, H3K9me3 and H3K27me3 demethylase activity. P values represent two-tailed unpaired t-tests, *P≤0.05. (H) % change in tumor volumes relative to the treatment start volume (~120 mm3) is shown for H1355 Parental (left) and H1355 T16 (right) xenografts. P values are from two-way ANOVA, *P<0.05, **P<0.01, ****P<0.0001. See also Fig S9.
Figure 7
Figure 7. JmjC KDM inhibitors synergize with paclitaxel + carboplatin standard chemotherapy in blocking emergence of drug tolerance from chemo-sensitive NSCLCs in vitro and in vivo
(A, B) Combination of JIB-04 (A) or GSK-J4 (B) with standard paclitaxel + carboplatin chemotherapy synergistically inhibited colony formation from H1299 T18. Error bars represent mean + SD from duplicate assays. P values are from two-tailed unpaired t-tests, *P<0.1, **P<0.01. Response was greater than additive, indicated by positive ΔBliss. (C) Sub-lethal doses of JmjC KDM inhibitor GSK-J4 (but not other epigenetic inhibitors) prevented the emergence of paclitaxel + carboplatin drug-tolerant colonies from chemo-sensitive H1299 Parental. Representative images from replicate assays (n=3) are shown. (D) GSK-J4 also blocked the emergence of paclitaxel + carboplatin drug-tolerant colonies from other chemo-sensitive NSCLC cell lines: H1355, HCC4017 and H1693. (E) H1299 Parental tumor volumes during in vivo combination treatment are shown in the top panel and tumor weights at sacrifice in the bottom graphs. Statistical tests on tumor volumes represent comparison of each treatment group with the Vehicle group by two-way ANOVA; n.s.=not significant, *P<0.05, **P<0.01, ****P<0.0001. ΔBliss for (Pac + Carb + JIB-04) combination = +13.8% and ΔBliss for (Pac + Carb + GSK-J4) = +13.9%, both values indicating synergy. P values for tumor weight comparisons are from two-tailed unpaired t-tests, *P<0.1, **P<0.01, ***P<0.001.

References

    1. American Cancer Society. Cancer Facts & Figures. 2015.
    1. Ben-Porath I, Thomson MW, Carey VJ, Ge R, Bell GW, Regev A, Weinberg RA. An embryonic stem cell-like gene expression signature in poorly differentiated aggressive human tumors. Nat Genet. 2008;40:499–507. - PMC - PubMed
    1. Bradshaw DM, Arceci RJ. Clinical relevance of transmembrane drug efflux as a mechanism of multidrug resistance. Journal of clinical oncology : official journal of the American Society of Clinical Oncology. 1998;16:3674–3690. - PubMed
    1. Busschots S, O’Toole S, O’Leary JJ, Stordal B. Carboplatin and taxol resistance develops more rapidly in functional BRCA1 compared to dysfunctional BRCA1 ovarian cancer cells. Experimental cell research. 2015;336:1–14. - PubMed
    1. d’Amato TA, Landreneau RJ, Ricketts W, Huang W, Parker R, Mechetner E, Yu IR, Luketich JD. Chemotherapy resistance and oncogene expression in non-small cell lung cancer. The Journal of thoracic and cardiovascular surgery. 2007;133:352–363. - PubMed

Publication types

MeSH terms