

Carbon monoxide-releasing molecule-2 suppresses thrombomodulin and endothelial protein C receptor expression of human umbilical vein endothelial cells induced by lipopolysaccharide in vitro
- PMID: 28538400
- PMCID: PMC5457880
- DOI: 10.1097/MD.0000000000006978
Carbon monoxide-releasing molecule-2 suppresses thrombomodulin and endothelial protein C receptor expression of human umbilical vein endothelial cells induced by lipopolysaccharide in vitro
Abstract
Objective: The aim of this study was to observe the counter-effect of carbon monoxide-releasing molecule-2 (CORM-2) on lipopolysaccharide (LPS)-suppressed thrombomodulin (TM) and endothelial protein C receptor (EPCR) expressions from human umbilical vein endothelial cell (HUVEC), and to reveal its mechanisms.
Methods: HUVECs were divided into 5 treatment groups, wherein reagents were added simultaneously. TM and EPCR proteins of the cells and the culture medium levels of soluble TM, soluble EPCR, and matrix metalloproteinase-2 (MMP-2) were detected after administration, whereas mRNA levels of TM and EPCR, as well as nuclear factor kappa-light-chain-enhancer of activated B cells (NF-κB) activity among groups, were also evaluated.
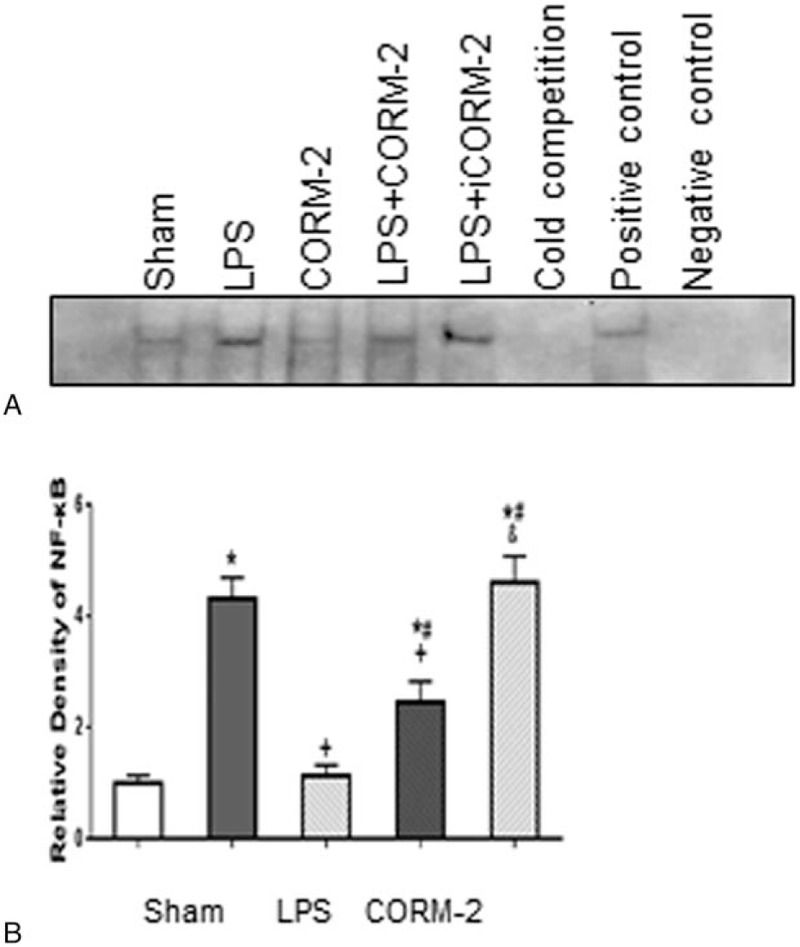
Results: No significant difference was observed in any indicator between CORM-2 and sham groups. Addition of LPS produced drastic increase in MMP-2 expression, NF-κB activity, shedding of TM and EPCR (into the culture medium), as well as remarkable decrease in both mRNA and protein expressions of TM and EPCR, and cell viability. LPS + CORM-2 treatment significantly reduced the increase in MMP-2, NF-κB activity, and TM/EPCR shedding, whereas maintained both mRNA and protein levels of TM and EPCR, and preserved cell viability.
Conclusions: CORM-2 protects HUVEC from LPS-induced injury, by way of suppressing NF-κB activity, which downregulates TM and EPCR mRNAs. It also decreases MMP-2 expression and prevents the shedding of TM and EPCR from the surface of endothelial cells, so as to preserve their protective effect.
Conflict of interest statement
The authors report no conflicts of interest.
Figures


Similar articles
-
Effects of shear stress on protein C activation, EPCR expression and TM expression in endothelial cells.Sheng Wu Yi Xue Gong Cheng Xue Za Zhi. 2009 Apr;26(2):303-9. Sheng Wu Yi Xue Gong Cheng Xue Za Zhi. 2009. PMID: 19499791
-
Puerarin prevents vascular endothelial injury through suppression of NF-κB activation in LPS-challenged human umbilical vein endothelial cells.Biomed Pharmacother. 2018 Aug;104:261-267. doi: 10.1016/j.biopha.2018.05.038. Epub 2018 May 25. Biomed Pharmacother. 2018. PMID: 29775893
-
Effects of TNF-alpha and curcumin on the expression of thrombomodulin and endothelial protein C receptor in human endothelial cells.Thromb Res. 2005;115(5):417-26. doi: 10.1016/j.thromres.2004.10.010. Epub 2004 Nov 14. Thromb Res. 2005. PMID: 15733976
-
Regulation of long-term repopulating hematopoietic stem cells by EPCR/PAR1 signaling.Ann N Y Acad Sci. 2016 Apr;1370(1):65-81. doi: 10.1111/nyas.13013. Epub 2016 Mar 1. Ann N Y Acad Sci. 2016. PMID: 26928241 Free PMC article. Review.
-
Endothelial Protein C Receptor and Its Impact on Rheumatic Disease.J Clin Med. 2024 Mar 31;13(7):2030. doi: 10.3390/jcm13072030. J Clin Med. 2024. PMID: 38610795 Free PMC article. Review.
Cited by
-
Uric acid regulates NLRP3/IL-1β signaling pathway and further induces vascular endothelial cells injury in early CKD through ROS activation and K+ efflux.BMC Nephrol. 2019 Aug 14;20(1):319. doi: 10.1186/s12882-019-1506-8. BMC Nephrol. 2019. PMID: 31412804 Free PMC article.
-
The effect of carbon monoxide releasing molecule-2 (CORM-2) on healing of ischemic colon anastomosis in rats.Turk J Med Sci. 2021 Aug 30;51(4):2222-2231. doi: 10.3906/sag-1902-43. Turk J Med Sci. 2021. PMID: 34051710 Free PMC article.
References
-
- Schouten M, Wiersinga WJ, Levi M, et al. Inflammation and coagulation in sepsis. J Leukoc Biol 2008;83:536–45. - PubMed
-
- Van de Wouwer M, Collen D, Conway EM. Thrombomodulin-protein C-EPCR system: integrated to regulate coagulation and inflammation. Arterioscler Thromb Vasc Biol 2004;24:1374–83. - PubMed
-
- Sohn RH, Deming CB, Johns DC, et al. Regulation of endothelial thrombomodulin expression by inflammatory cytokines is mediated by activation of nuclear factor-kappa B. Blood 2005;105:3910–7. - PubMed
-
- Nakamura T, Ebihara I, Shimada N, et al. Modulation of plasma metalloproteinase-9 concentrations and peripheral blood monocyte mRNA levels in patients with septic shock: effect of fiber-immobilized polymyxin B treatment. Am J Med Sci 1998;316:355–60. - PubMed
MeSH terms
Substances
LinkOut - more resources
Full Text Sources
Other Literature Sources
Miscellaneous
