

Magnetic resonance imaging evaluation of the labrum to predict acetabular development in developmental dysplasia of the hip: A STROBE compliant study
- PMID: 28538419
- PMCID: PMC5457899
- DOI: 10.1097/MD.0000000000007013
Magnetic resonance imaging evaluation of the labrum to predict acetabular development in developmental dysplasia of the hip: A STROBE compliant study
Abstract
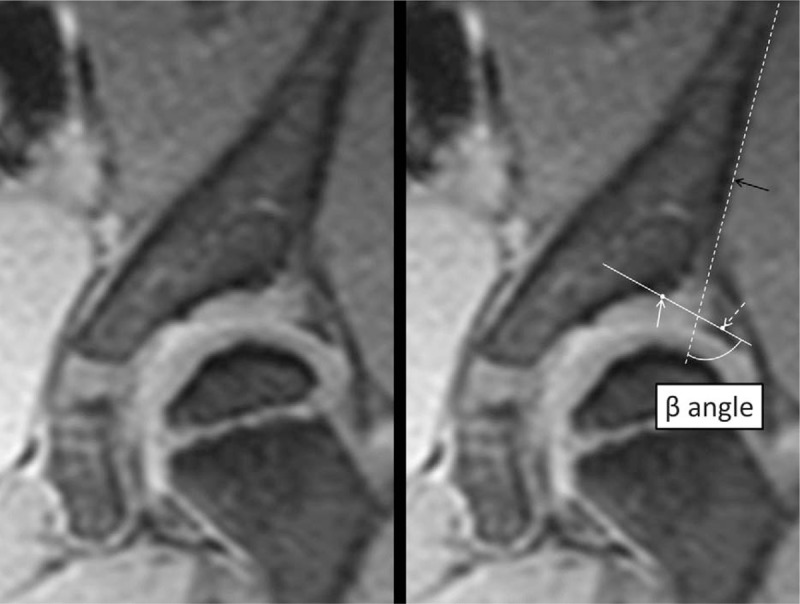
Recently, more attention has been paid to the role of the acetabular labrum. Therefore, we designed a retrospective cohort study of patients with residual hip dysplasia (RHD) who underwent magnetic resonance imaging (MRI). The objective of this study was to investigate an association between the MRI appearance of the labrum before school age and the natural history of RHD.We retrospectively investigated 45 hips of 40 patients who underwent MRI at about 3 and 4 years of age for RHD and were conservatively followed up with until 6 years of age or older. We evaluated the extent of eversion with a new method that measures the β angle (MRI β angle) using landmarks of the Graf method on MRI T2*-weighted images. The outcome measure was the Severin classification at the final follow-up. We compared the radiographic and MRI parameters at approximately 3 and 4 years of age between the good and poor outcome groups. The Student t test or one-way analysis of variance was used to compare the quantitative variables between groups. The Chi-square test was used to perform a ratio comparison.Although there was a significant difference in the center-edge (CE) angle, there was no significant difference in the acetabular index and the ratio of the presence of femoral head necrosis and the break in Shenton line between the good and poor groups. The MRI β angle was significantly greater in the poor outcome group than in the normal and good outcome groups. The cut-off value of the MRI β angle to differentiate the good and poor outcome groups was 65°, and its specificity and sensitivity were 92% and 53%, respectively.There was labral eversion on MRI scans in patients with RHD. Acetabular development before adolescence was poorer with greater labral eversion on MRI scans. The specificity for poor acetabular development was high when the MRI β angle was 65° or more. The MRI β angle has the potential to predict acetabular development.
Conflict of interest statement
The authors have no conflicts of interest to disclose.
Figures


Similar articles
-
Evaluation of the labrum on postoperative magnetic resonance images: a predictor of acetabular development in developmental dysplasia of the hip.Hip Int. 2022 Nov;32(6):800-806. doi: 10.1177/11207000211004917. Epub 2021 Apr 8. Hip Int. 2022. PMID: 33829902
-
Factors Associated With Severity of Intra-articular Lesions in Patients With Severe Hip Dysplasia.Arthroscopy. 2016 Aug;32(8):1581-9. doi: 10.1016/j.arthro.2016.01.060. Epub 2016 Apr 25. Arthroscopy. 2016. PMID: 27134192
-
A Possible New Radiographic Predictor of Progression of Osteoarthritis in Developmental Dysplasia of the Hip: The Center Gap.Clin Orthop Relat Res. 2018 Nov;476(11):2157-2166. doi: 10.1097/CORR.0000000000000458. Clin Orthop Relat Res. 2018. PMID: 30179949 Free PMC article.
-
[Evidence-based current concepts in the radiological diagnosis and follow-up of developmental dysplasia of the hip].Acta Orthop Traumatol Turc. 2007;41 Suppl 1:14-8. Acta Orthop Traumatol Turc. 2007. PMID: 17483618 Review. Turkish.
-
The management of residual acetabular dysplasia: updates and controversies.J Pediatr Orthop B. 2017 Jul;26(4):344-349. doi: 10.1097/BPB.0000000000000358. J Pediatr Orthop B. 2017. PMID: 27379671 Review.
Cited by
-
Hip Morphology on Post-Reduction MRI Predicts Residual Dysplasia 10 Years After Open or Closed Reduction.J Bone Joint Surg Am. 2024 Jan 17;106(2):110-119. doi: 10.2106/JBJS.23.00333. Epub 2023 Nov 22. J Bone Joint Surg Am. 2024. PMID: 37992184 Free PMC article.
-
MRI hip morphology is abnormal in unilateral DDH and increased lateral limbus thickness is associated with residual DDH at minimum 10-year follow-up.J Child Orthop. 2022 Dec 26;17(2):86-96. doi: 10.1177/18632521221144060. eCollection 2023 Apr. J Child Orthop. 2022. PMID: 37034197 Free PMC article.
-
The role of the labrum in early treatment of unstable developmental dysplasia of the hip.EFORT Open Rev. 2019 Jun 3;4(6):296-301. doi: 10.1302/2058-5241.4.180053. eCollection 2019 Jun. EFORT Open Rev. 2019. PMID: 31312518 Free PMC article. Review.
-
Cartilaginous predictors of residual acetabular dysplasia (RAD) in developmental dysplasia of the hip following closed or open reduction: A systematic review and meta-analysis.Front Pediatr. 2023 Mar 29;11:1124123. doi: 10.3389/fped.2023.1124123. eCollection 2023. Front Pediatr. 2023. PMID: 37063659 Free PMC article. Review.
References
-
- Salter RB. The classic. Innominate osteotomy in the treatment of congenital dislocation and subluxation of the hip. J Bone Joint Surg Br 1961;43:518–39. - PubMed
-
- Wiberg G. Studies on dysplastic acetabula and congenital subluxation of the hip joint. Acta Chir Scand 1939;83:1.
-
- Albinana J, Dolan LA, Spratt KF, et al. Acetabular dysplasia after treatment for developmental dysplasia of the hip. Implications for secondary procedures. J Bone Joint Surg Br 2004;86:876–86. - PubMed
-
- Hattori T, Ono Y, Kitakoji T, et al. Soft-tissue interposition after closed reduction in developmental dysplasia of the hip. The long-term effect on acetabular development and avascular necrosis. J Bone Joint Surg Br 1999;81:385–91. - PubMed
-
- Kitoh H, Kitakoji T, Katoh M, et al. Prediction of acetabular development after closed reduction by overhead traction in developmental dysplasia of the hip. J Orthop Sci 2006;11:473–7. - PubMed
Publication types
MeSH terms
LinkOut - more resources
Full Text Sources
Other Literature Sources
Medical
