. 2017 May 24;7(2):3.
doi: 10.3390/jpm7020003.

Accuracy in Wrist-Worn, Sensor-Based Measurements of Heart Rate and Energy Expenditure in a Diverse Cohort

Affiliations

Accuracy in Wrist-Worn, Sensor-Based Measurements of Heart Rate and Energy Expenditure in a Diverse Cohort

Anna Shcherbina et al. J Pers Med. .

Abstract

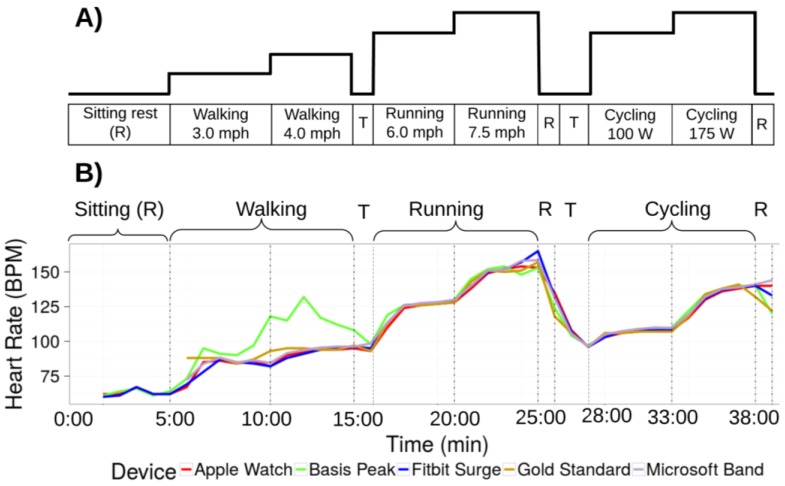
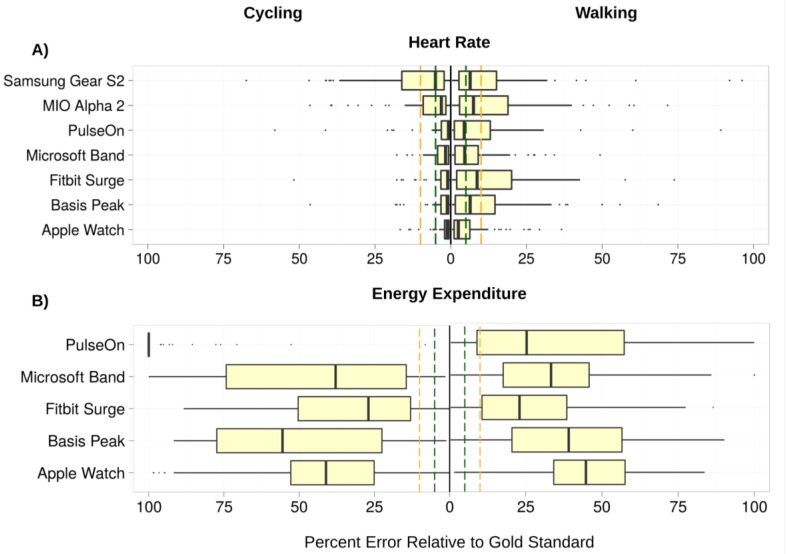
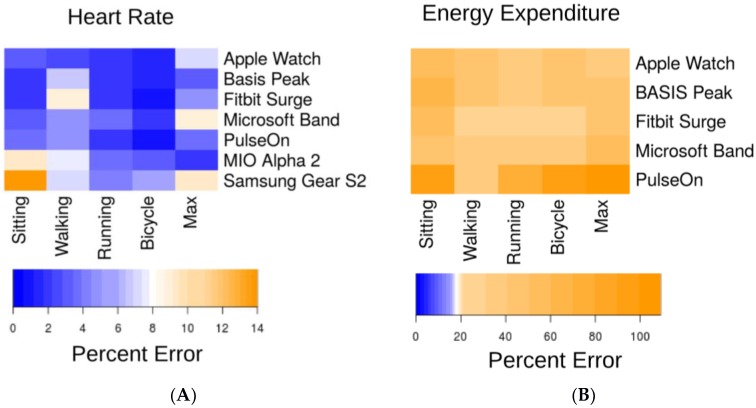
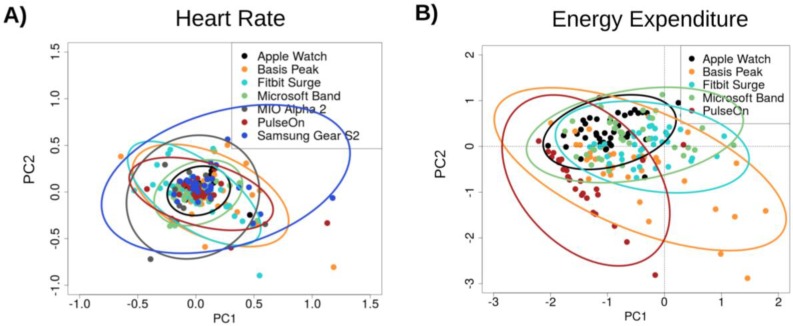
The ability to measure physical activity through wrist-worn devices provides an opportunity for cardiovascular medicine. However, the accuracy of commercial devices is largely unknown. The aim of this work is to assess the accuracy of seven commercially available wrist-worn devices in estimating heart rate (HR) and energy expenditure (EE) and to propose a wearable sensor evaluation framework. We evaluated the Apple Watch, Basis Peak, Fitbit Surge, Microsoft Band, Mio Alpha 2, PulseOn, and Samsung Gear S2. Participants wore devices while being simultaneously assessed with continuous telemetry and indirect calorimetry while sitting, walking, running, and cycling. Sixty volunteers (29 male, 31 female, age 38 ± 11 years) of diverse age, height, weight, skin tone, and fitness level were selected. Error in HR and EE was computed for each subject/device/activity combination. Devices reported the lowest error for cycling and the highest for walking. Device error was higher for males, greater body mass index, darker skin tone, and walking. Six of the devices achieved a median error for HR below 5% during cycling. No device achieved an error in EE below 20 percent. The Apple Watch achieved the lowest overall error in both HR and EE, while the Samsung Gear S2 reported the highest. In conclusion, most wrist-worn devices adequately measure HR in laboratory-based activities, but poorly estimate EE, suggesting caution in the use of EE measurements as part of health improvement programs. We propose reference standards for the validation of consumer health devices (http://precision.stanford.edu/).

Keywords: activity monitors; energy expenditure; fitness trackers; heart rate; mobile health; validation.


Conflict of interest statement

The authors declare no conflict of interest.

Figures

Figure 1
Figure 1
Study protocol. (A) Schematic view of the protocol. Participants transition through two intensities of three modalities of exercise as shown. Walking is on a treadmill. Cycling is on a stationary bike. Activities are interspersed with brief (1 min) periods of rest “R”, and transitions between activities are indicated by “T”; (B) Data from one participant wearing four devices. Data for the error analysis is derived from the last minute of each stage. Overall, error is within an acceptable range with the exception of the walking phase for one device (green line).
Figure 2
Figure 2
Aggregate relative error (RE) in heart rate (HR) and energy expenditure (EE) for the cycling and walking tasks—the two tasks in the protocol with overall lowest and highest median device error, respectively. Error is calculated as abs(Gold Standard−Device)/(Gold Standard). The lower boundary of the boxplots indicates the 25% quantile of data, the middle notch indicates the median data value, and the upper boundary indicates the 75% quantile. Whiskers include all data points that fall within 1.5 interquartile range (IQR) of the 25% and 75% quantile values. Data points that lie further than 1.5 IQR from the upper and lower hinge values are treated as outliers, indicated by black circles. Vertical dashed green lines indicate the 5% error threshold, while the vertical dashed yellow lines indicate the 10% error threshold. Median HR error is below the 5% threshold for all but one device for the cycling task, and below the 10% threshold for all devices on the walking task. EE error rates significantly exceed the 10% threshold for all devices on both the cycling and walking tasks.
Figure 3
Figure 3
Median device error across activities. We defined an acceptable error range as <5% (dark blue). Light blue, white and yellow shading indicates error outside of this range. (A) Median HR beats-per-minute (bpm) error as a percent of the gold standard measurement; (B) Median EE (kcal) error as a percent of the gold standard measurement. Note the scaling of the legend color is identical in both panels. Overall, heart rate error was within the acceptable error range for the majority of task/device combinations, but EE error exceeded the allowed threshold for all tasks and devices.
Figure 4
Figure 4
Principal component analysis of device error in (A) HR and (B) EE. Device errors across all activities (sitting, walking, running, cycling) were aggregated across subjects, excluding any subjects with missing data. The projection of the scaled error values on principal components 1 and 2 (PC2, PC2) are illustrated in the scatter plot, color-coded by device. Ellipses indicate the extent of the first and second principal components that encompass 95 percent of the subject error values for each device. Smaller ellipse area indicates lower variance among device error values, and data points near 0 along the PC1 and PC2 axes indicate low error. The Apple Watch had the most favorable overall error profile while the PulseOn had the least favorable overall error profile.

References

    1. Hollis J.F., Gullion C.M., Stevens V.J., Brantley P.J., Appel L.J., Ard J.D., Laferriere D. Weight Loss During the Intensive Intervention Phase of the Weight-Loss Maintenance Trial. Am. J. Prev. Med. 2008;35:118–126. doi: 10.1016/j.amepre.2008.04.013. - DOI - PMC - PubMed
    1. Zhang Z., Pi Z., Liu B. TROIKA: A general framework for heart rate monitoring using wrist-type photoplethysmographic signals during intensive physical exercise. IEEE Trans. Biomed. Eng. 2015;62:522–531. doi: 10.1109/TBME.2014.2359372. - DOI - PubMed
    1. Brage S., Westgate K., Franks P.W., Stegle O., Wright A., Ekelund U., Wareham N.J. Estimation of Free-Living Energy Expenditure by Heart Rate and Movement Sensing: A Doubly-Labelled Water Study. PLoS ONE. 2015;10:e0137206. doi: 10.1371/journal.pone.0137206. - DOI - PMC - PubMed
    1. Schrack J.A., Zipunnikov V., Goldsmith J., Bandeen-Roche K., Crainiceanu C.M., Ferrucci L. Estimating Energy Expenditure from Heart Rate in Older Adults: A Case for Calibration. PLoS ONE. 2014;9:e93520. doi: 10.1371/journal.pone.0093520. - DOI - PMC - PubMed
    1. Zong C., Jafari R. Robust heart rate estimation using wrist-based PPG signals in the presence of intense physical activities; Proceedings of the 2015 37th Annual International Conference of the IEEE Engineering in Medicine and Biology Society (EMBC); Milan, Italy. 25–29 August 2015; [(accessed on 23 May 2017)]. pp. 8078–8082. Available online: ieeexplore.ieee.org. - PubMed