. 2017 Jun 8;546(7657):248-253.
doi: 10.1038/nature22394. Epub 2017 May 24.

Cryo-EM structure of the activated GLP-1 receptor in complex with a G protein

Affiliations

Cryo-EM structure of the activated GLP-1 receptor in complex with a G protein

Yan Zhang et al. Nature. .

Abstract

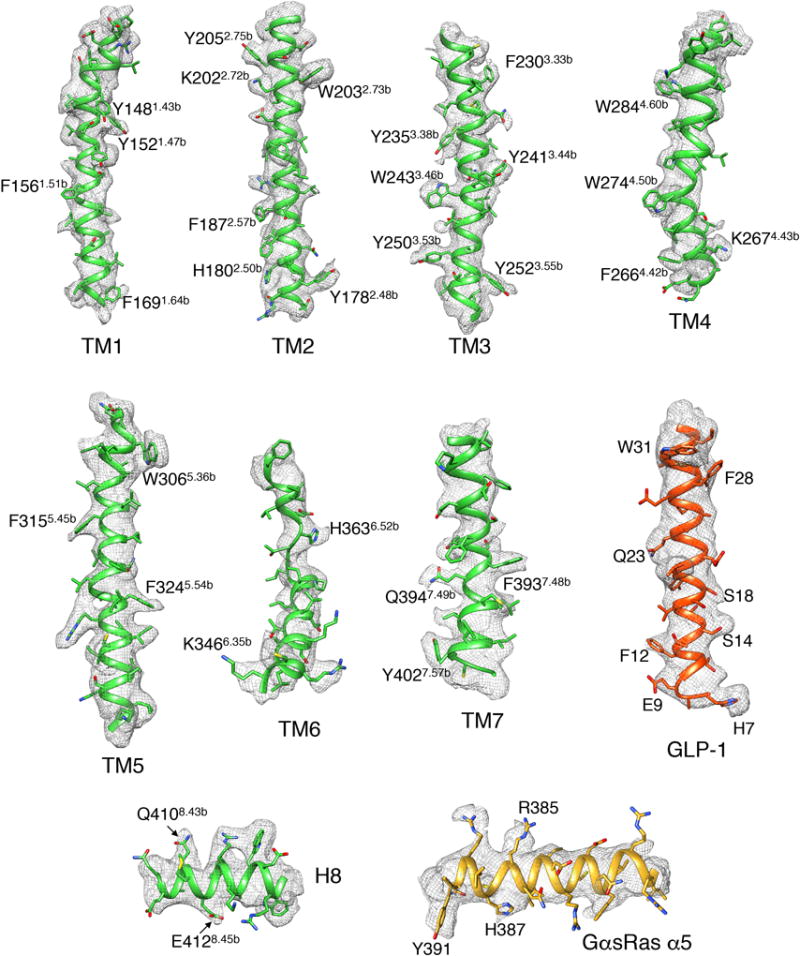
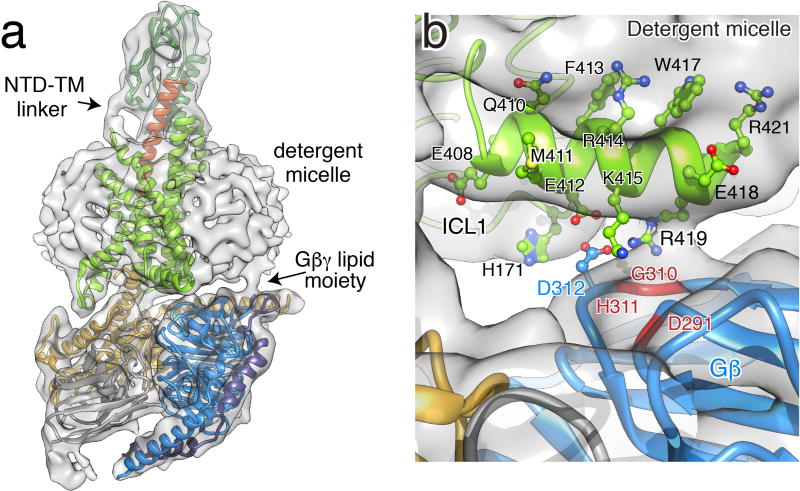
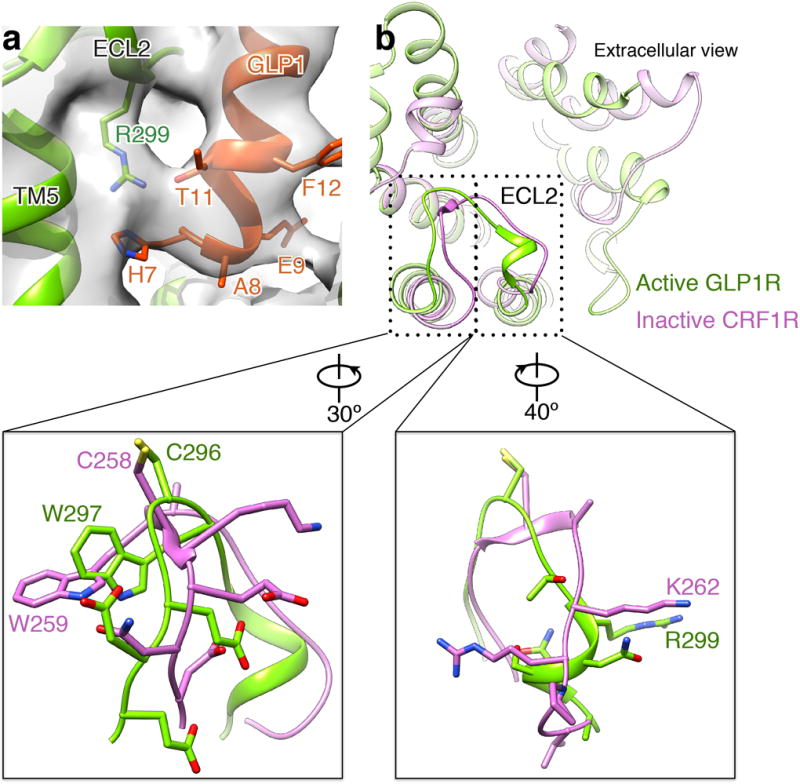
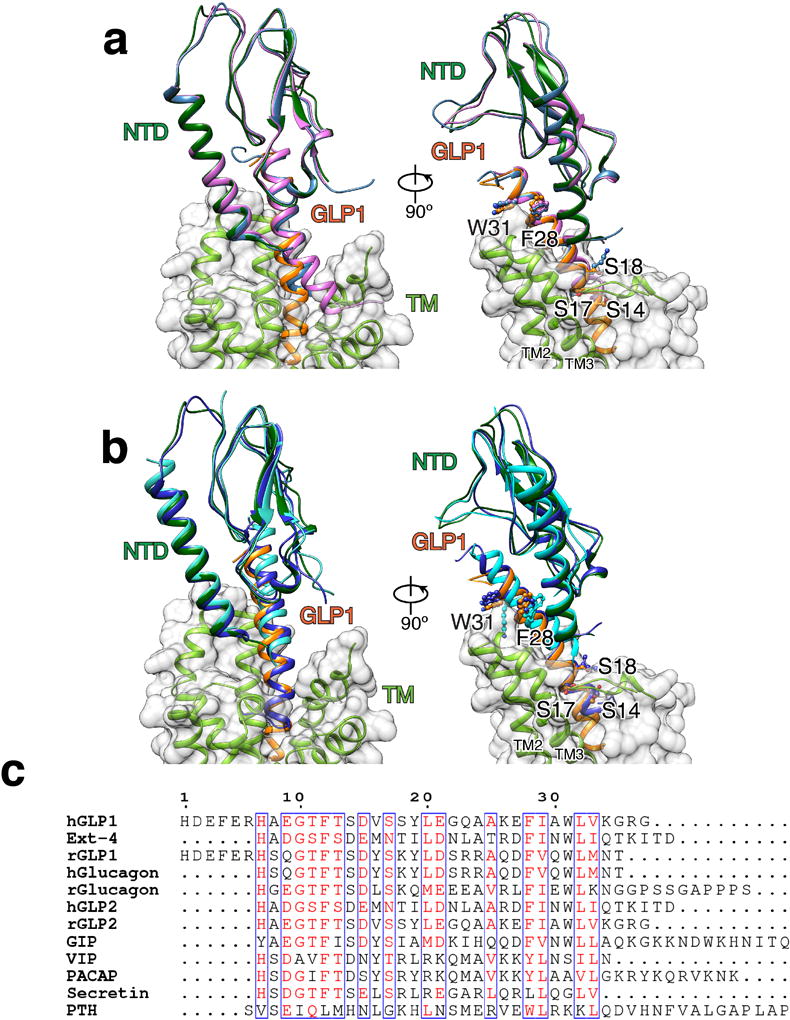
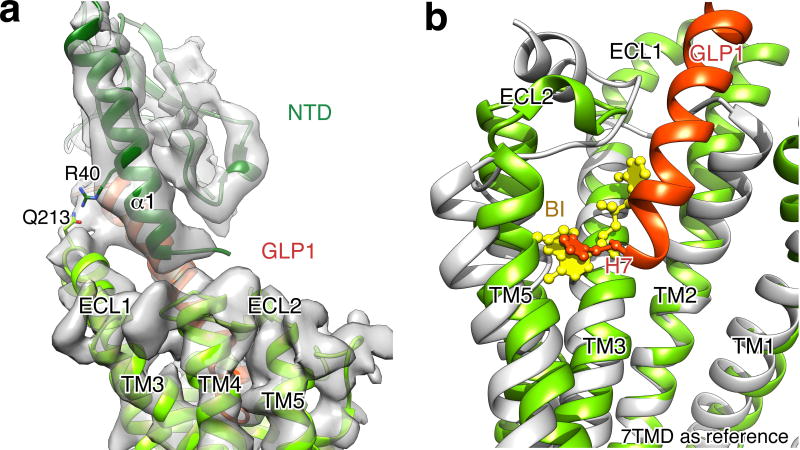
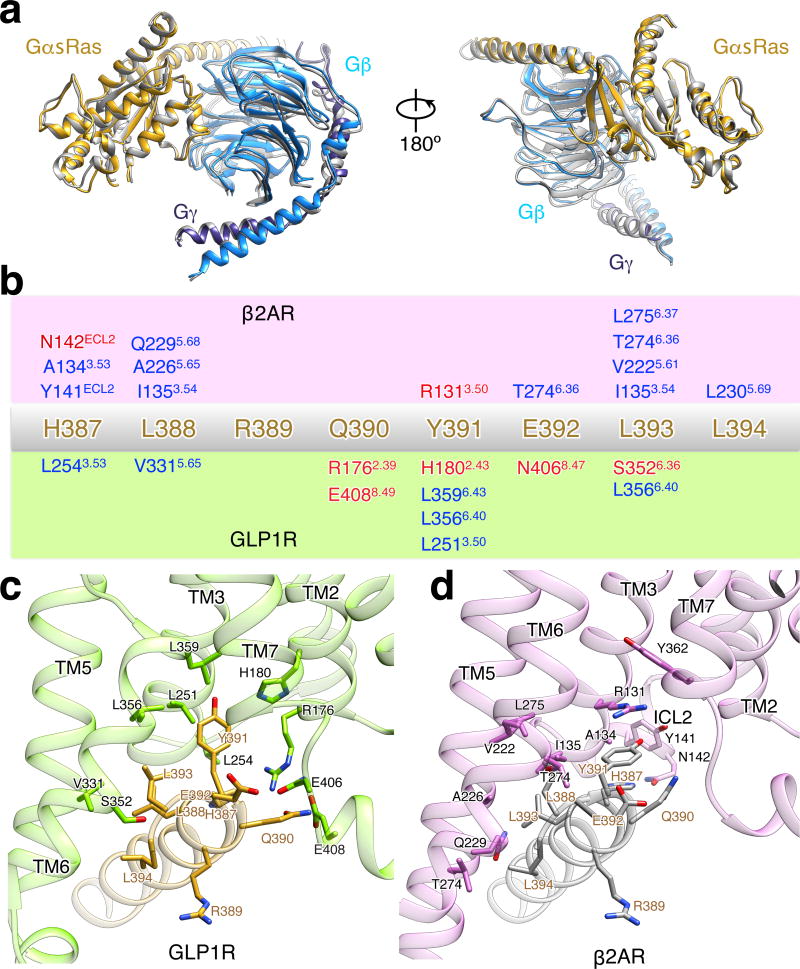
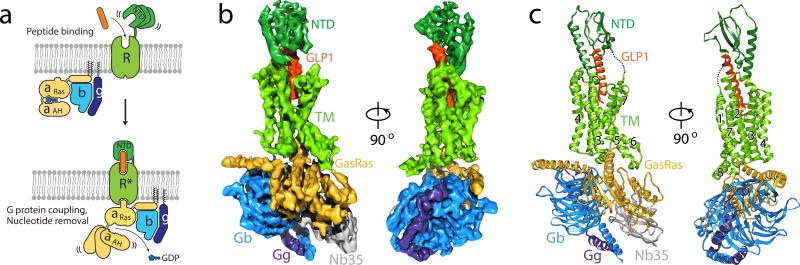
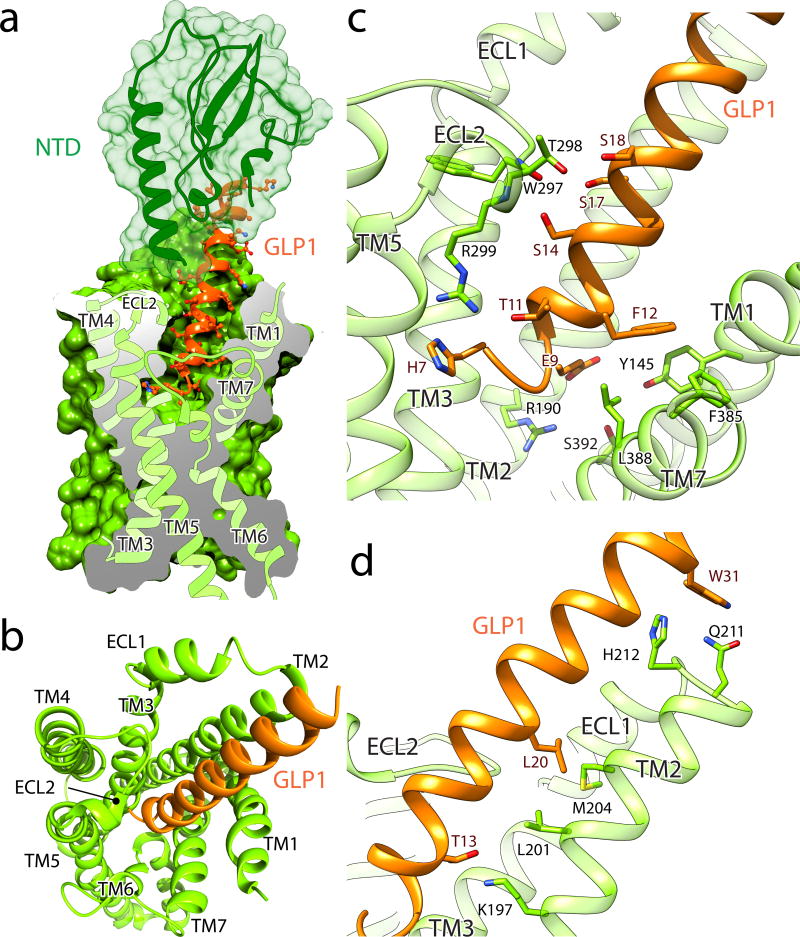
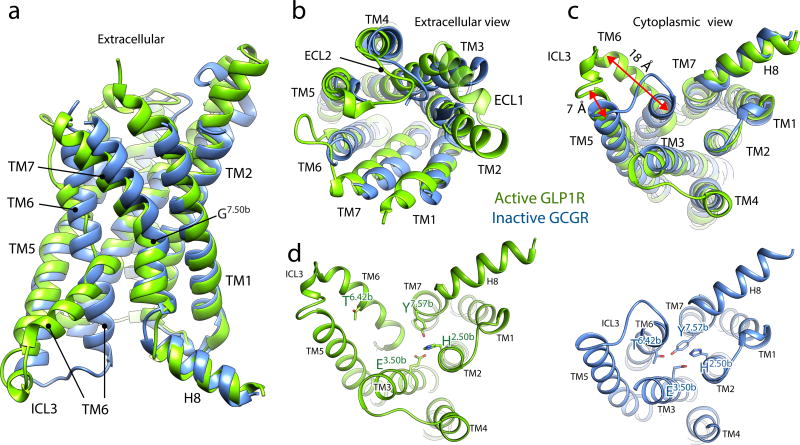
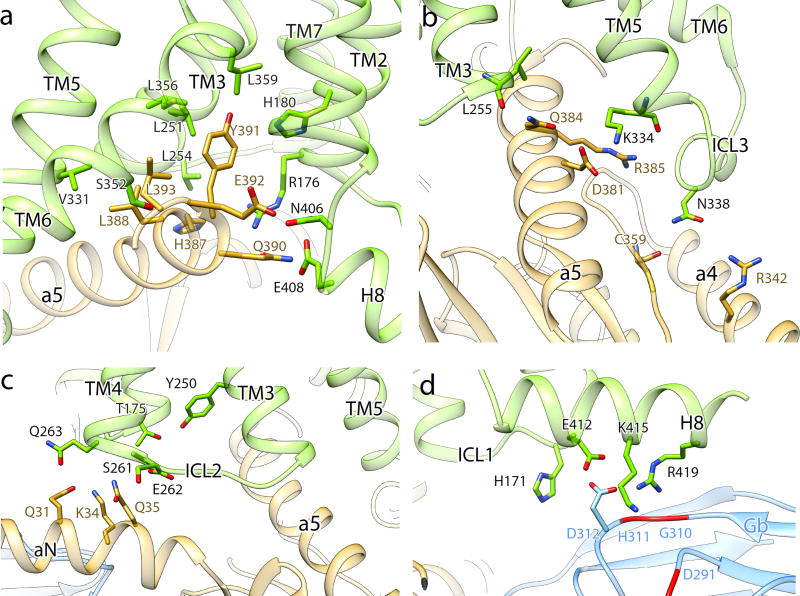
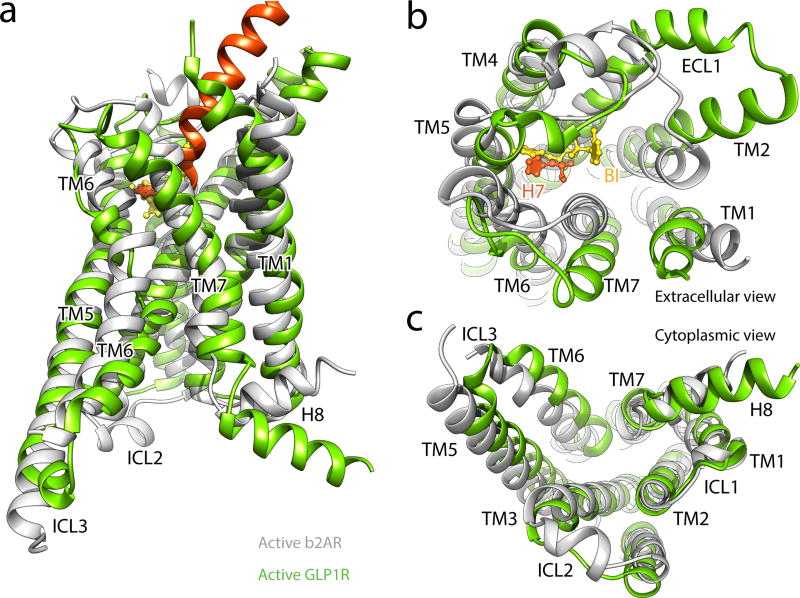
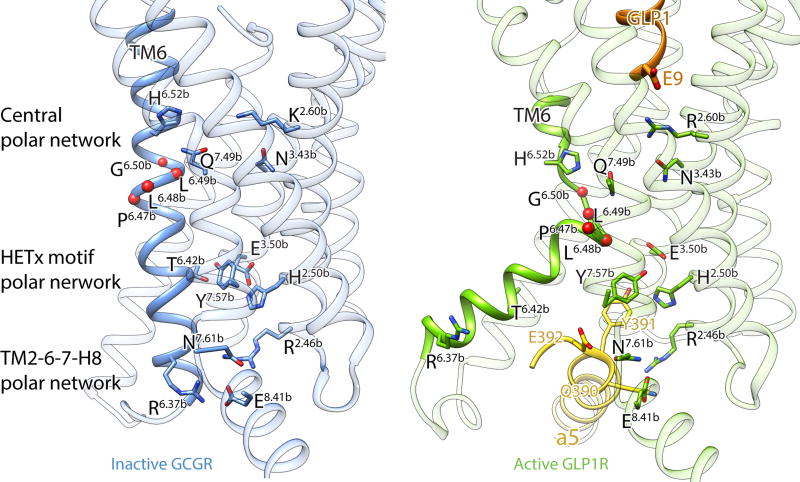
Glucagon-like peptide 1 (GLP-1) is a hormone with essential roles in regulating insulin secretion, carbohydrate metabolism and appetite. GLP-1 effects are mediated through binding to the GLP-1 receptor (GLP-1R), a class B G-protein-coupled receptor (GPCR) that signals primarily through the stimulatory G protein Gs. Class B GPCRs are important therapeutic targets; however, our understanding of their mechanism of action is limited by the lack of structural information on activated and full-length receptors. Here we report the cryo-electron microscopy structure of the peptide-activated GLP-1R-Gs complex at near atomic resolution. The peptide is clasped between the N-terminal domain and the transmembrane core of the receptor, and further stabilized by extracellular loops. Conformational changes in the transmembrane domain result in a sharp kink in the middle of transmembrane helix 6, which pivots its intracellular half outward to accommodate the α5-helix of the Ras-like domain of Gs. These results provide a structural framework for understanding class B GPCR activation through hormone binding.


Figures

Extended Data Figure 1
Extended Data Figure 1. Purification of the hGLP-1:rGLP-1R:Gs complex
Size exclusion chromatography profile and corresponding SDS-PAGE gel of the purified hGLP-1:rGLP-1R:Gs complex.
Extended Data Figure 2
Extended Data Figure 2. Cryo-EM micrograph and 2D class averages of the hGLP-1:rGLP-1R:Gs complex
a, Cryo-EM micrograph of the activated GLP-1R:Gs complex. Examples of sample particle projections are circled (scale bar: 30 nm). b, Representative reference-free two-dimensional averages show distinct secondary structure features for G protein and GLP-1R embedded in MNG detergent micelle. The diameter of the circular windows is 17 nm.
Extended Data Figure 3
Extended Data Figure 3. Single-particle cryo-EM analysis of the hGLP-1:rGLP-1R:Gs complex
Flow chart of cryo-EM data processing of the hGLP-1:rGLP-1R:Gs complex, including particle projection selection, classification and 3D density map reconstruction, related to Figure 1. Details are provided in the Methods section.
Extended Data Figure 4
Extended Data Figure 4. Resolution of cryo-EM map and validation of the hGLP-1:rGLP-1R:Gs structure
a, Resolution estimation of the EM map. “Gold standard” Fourier shell correlation (FSC) curves, showing the overall nominal resolution at 4.1 Å (blue) and 3.9 Å (red) on the stable region including hGLP-1, TM domain and GαsRas α5-helix. b, FSC curves of the final refined model versus the final cryo-EM map (full dataset, black), of the outcome of model refinement with a half map versus the same map (red), and of the outcome of model refinement with a half map versus the other half map (green). c, Final three-dimensional density map colored according to local resolution.
Extended Data Figure 5
Extended Data Figure 5. A near-atomic resolution model of the hGLP-1:rGLP-1R:Gs complex
EM density map and model are shown for all seven TMs and H8 of rGLP-1R, hGLP-1 peptide and GαsRas α5-helix. Bulky resides are indicated for each segment. The C-terminal half of TM6 exhibits relatively poor density, reflecting its intrinsic flexibility.
Extended Data Figure 6
Extended Data Figure 6. Features of cryo-EM map prior to density subtraction
a, GLP-1R:Gs complex structure docked into cryo-EM density map prior to density subtraction. Arrows indicate the density corresponding to the linker between NTD and TM bundle, and Gβγlipid moiety inserting into the detergent micelle. b, Close-up view in this map shows density connecting H8 and Gβ at the position of R419 of H8 and G310-H311 of Gβ. Model is colored as in Figure 1c.
Extended Data Figure 7
Extended Data Figure 7. Conformation of ECL2 in family B GPCRs
a, Close-up view of R299 of ECL2 modeled into the density map at low threshold shows that the Arg side chain reaches into the GLP-1 binding pocket in close proximity to H7 and T11 of the peptide. b, Top-down view of structural overlay of the active GLP-1R TMD and the inactive CRF1R TMD (PDB code: 4K5Y) indicates the conformational similarity of ECL2s in the two structures. Detailed views of boxed regions show that W297 and R299 in the active GLP-1R structure adopt similar orientations compared to the equivalent residues in CRF1R. Model of GLP-1R complex is colored as in Figure 1c. CRF1R is colored orchid.
Extended Data Figure 8
Extended Data Figure 8. Structures of family B GPCR ligands bound to NTDs
a, Structural superposition of the cryo-EM structure of GLP-1R NTD bound to GLP-1 to crystal structures with clinical peptide Exendin-4 (ocean blue) and GLP-1 (orchid), respectively. The model of hGLP-1:rGLP-1R:Gs is colored as in Figure 1. b, Structural superposition of the cryo-EM structure of GLP-1R NTD bound to GLP-1 to crystal structures of GIPR NTD:GIP (blue) and PTH-1R NTD:PTH (cyan). a–b, Residues S14, S17, S18, F28 and W31 of GLP-1 and equivalent residues in the other peptides are shown in ball and stick (right panel only), highlighting that the corresponding side chains adopt similar conformation in all available structures. c, Structure-based alignment of selected family B GPCR peptide ligand sequences.
Extended Data Figure 9
Extended Data Figure 9. Potential NTD-TM interaction, orthosteric agonist binding pocket in GLP-1R and β2AR
a, Close-up view of the model docked into cryo-EM density map (grey) on the region of NTD-TM at low threshold shows the potential hydrogen bond between Q213 of ECL1 and R40 of NTD α1-helix. b, Overlay of GPCR TM bundles in the activated GLP-1R complex and T4L-β2AR:Gs:Nb35 complex shown in light green and grey, respectively. Cut-through view showing that the GLP-1 peptide N-terminal H7 (orange ball and stick) reaches the same level as the orthosteric agonist BI-167107 (yellow).
Extended Data Figure 10
Extended Data Figure 10. Comparison of G protein trimer structures from activated GLP-1R:Gs:Nb35 complex and T4L-β2AR:Gs:Nb35 complex with alignment on GαsRas alone, related to Figure 5
a, Views of superposition of G protein trimer structures from the activated GLP-1R:Gs structure (GαsRas in gold, Gβ in light blue, Gγ in dark blue) and T4L-β2AR:Gs structure (all colored in grey). b, Schematic representation of recognition between C-terminus of α5-helix (H387-L394) and active receptors of β2AR (c) and GLP-1R (d). The sequence of C-terminus of α5-helix (H387-L394) is shown in the middle in gold. Residues involving in the interaction with α5-helix (H387-L394) in the receptor of β2AR (green box) and GLP-1R (orchid box) are shown over and below, respectively. Hydrophobic interactions are shown in blue and polar interactions in red. Ballesteros-Weinstein numbering in superscript is shown.
Figure 1
Figure 1. Cryo-EM structure of the hGLP-1:rGLP-1R:Gs complex
a, Schematic of the activation of a family B GPCR by extracellular peptide agonist via a ‘two–domain’ binding mechanism. b, Views of the GLP-1R:Gs complex cryo-EM density map, colored by subunit (TM in light green, NTD in dark green, GLP-1 peptide in orange, GαsRas in gold, Gβ in light blue, Gγ in dark blue and Nb35 in grey). c, Structure of the activated GLP-1R-Gs complex in the same view and color scheme as shown in b.
Figure 2
Figure 2. The orthosteric peptide binding pocket of GLP-1R
a, Cutaway view showing GLP-1 (ribbon and atom in ball and stick, orange) penetration into a pocket formed by TMs 1, 2, 5, 7, ECL1 and 2 (ribbon and surface, light green) while its C-terminal part is recognized by the NTD (ribbon in transparent surface, dark green). b, View from the extracellular side of the orthosteric peptide binding pocket in the receptor bundle with omitted NTD. c–d, Close-up views of the interaction between the receptor and its endogenous agonist GLP-1.
Figure 3
Figure 3. Comparison of active-state GLP-1R with inactive GCGR
Side (a), extracellular (b) and cytoplasmic (c) views of the activated GLP-1R TM bundle (light green) in superposition to the inactive glucagon receptor bound to allosteric antagonist (not shown; PDB code: 5EE7, blue). Significant conformational changes are observed on the cytoplasmic face of TM5 and TM6. TM6 moves outwards by 18 Å as measured at the α-carbon of Lys346, while TM5 moves a smaller distance by 7 Å when measured at the α-carbon of Lys334. A notable difference on the extracellular side is TM2 extended by three helical turns stabilized by peptide ligand binding. The disordered extracellular loops (ECLs) in the inactive GCGR structure are stabilized and structurally ordered in the activated GLP-1R structure. d, Comparison of HETx motif networking (in stick, Wootten numbering in superscript) between inactive GCGR and active GLP-1R shows that the outwards movement of TM6 removes T6.42b from the polar network.
Figure 4
Figure 4. GLP-1R interactions with Gs
a–b, The GαsRas α5-helix docks into a cavity on the intracellular side of the receptor TM bundle formed by the opening of TM helices 5 and 6. a, Gs interactions with the transmembrane core include polar and non-polar contacts. The recognition of Y391 of the α5-helix involves both a small hydrophobic pocket formed by L251, L356 and L359, and potential hydrogen bonding with H180 of the conserved polar network, equivalent to the E/DRY motif in family A GPCRs. b, Q384 and R385 of the α5-helix form a polar interaction network with the cytoplasmic ends of TM3 and TM5, respectively. N338 of ICL3 is in close proximity to R342 of α4-helix and C359 of β4-strand. c, Y250 of TM3 and T175 of TM2 form a hydrogen bond constraining the conformation of ICL1 and ICL2 with respect to each other. E262 and Q263 at the intracellular tip of TM4 and S261 of ICL2 form polar interactions with the stretch Q31-Q35 of αN-helix. d, H171 of ICL1 participates in the electrostatic interaction network between E412, K415 and R419 of H8 with D312 and D291 of Gβ (see also Figure S6b).
Figure 5
Figure 5. Comparison between activated family A and B receptor conformations
Side (a), extracellular (b), and cytoplasmic (c) views of the activated GLP-1R TM bundle (TM in light green, endogenous agonist peptide GLP-1 in orange) superpositioned with the active β2AR (grey) bound to allosteric antagonist BI-167107 (yellow) (PDB code: 3SN6), related to Figure S9.
Figure 6
Figure 6. Polar network rearrangements upon GLP-1R activation
Comparison of polar network arrangements in the inactive-state GCGR (PDB code: 5EE7; the coordinates for residue R2.46b were obtained from the crystal structure of apo-state GCGR) and active-state GLP-1R. GLP-1 binding results in the cytoplasmic half of TM6 outward movement with simultaneous rearrangements of the central polar network. The rearrangement of TM6 breaks apart polar interactions of the conserved HETx and TM2-6-7-H8 networks, releasing residues for interactions with the GαsRas α5-helix. Peptide ligand GLP-1, TM6 and GαsRas α5-helix are shown in ribbon and colored as previously. Polar network residues are shown in stick with Wootten numbering in superscript. The exposed backbone carbonyl oxygens of Pro6.47b-Leu-Leu-Gly6.50p are shown as red spheres.

Comment in

References

    1. Drucker DJ. The Cardiovascular Biology of Glucagon-like Peptide-1. Cell Metab. 2016;24:15–30. - PubMed
    1. Cho YM, Merchant CE, Kieffer TJ. Targeting the glucagon receptor family for diabetes and obesity therapy. Pharmacol. Ther. 2012;135:247–278. - PubMed
    1. Lagerstrom MC, Schioth HB. Structural diversity of G protein-coupled receptors and significance for drug discovery. Nat. Rev. Drug Discov. 2008;7:339–357. - PubMed
    1. Runge S, Thogersen H, Madsen K, Lau J, Rudolph R. Crystal structure of the ligand-bound glucagon-like peptide-1 receptor extracellular domain. J. Biol. Chem. 2008;283:11340–11347. - PubMed
    1. Underwood CR, et al. Crystal structure of glucagon-like peptide-1 in complex with the extracellular domain of the glucagon-like peptide-1 receptor. J. Biol. Chem. 2010;285:723–730. - PMC - PubMed

Publication types

MeSH terms

Substances