

doi: 10.1038/nature22342.
Epub 2017 May 24.
Blocking FSH induces thermogenic adipose tissue and reduces body fat
Affiliations
- PMID: 28538730
- PMCID: PMC5651981
- DOI: 10.1038/nature22342
Item in Clipboard
Blocking FSH induces thermogenic adipose tissue and reduces body fat
Nature.
.
Abstract
Menopause is associated with bone loss and enhanced visceral adiposity. A polyclonal antibody that targets the β-subunit of the pituitary hormone follicle-stimulating hormone (Fsh) increases bone mass in mice. Here, we report that this antibody sharply reduces adipose tissue in wild-type mice, phenocopying genetic haploinsufficiency for the Fsh receptor gene Fshr. The antibody also causes profound beiging, increases cellular mitochondrial density, activates brown adipose tissue and enhances thermogenesis. These actions result from the specific binding of the antibody to the β-subunit of Fsh to block its action. Our studies uncover opportunities for simultaneously treating obesity and osteoporosis.
Figures
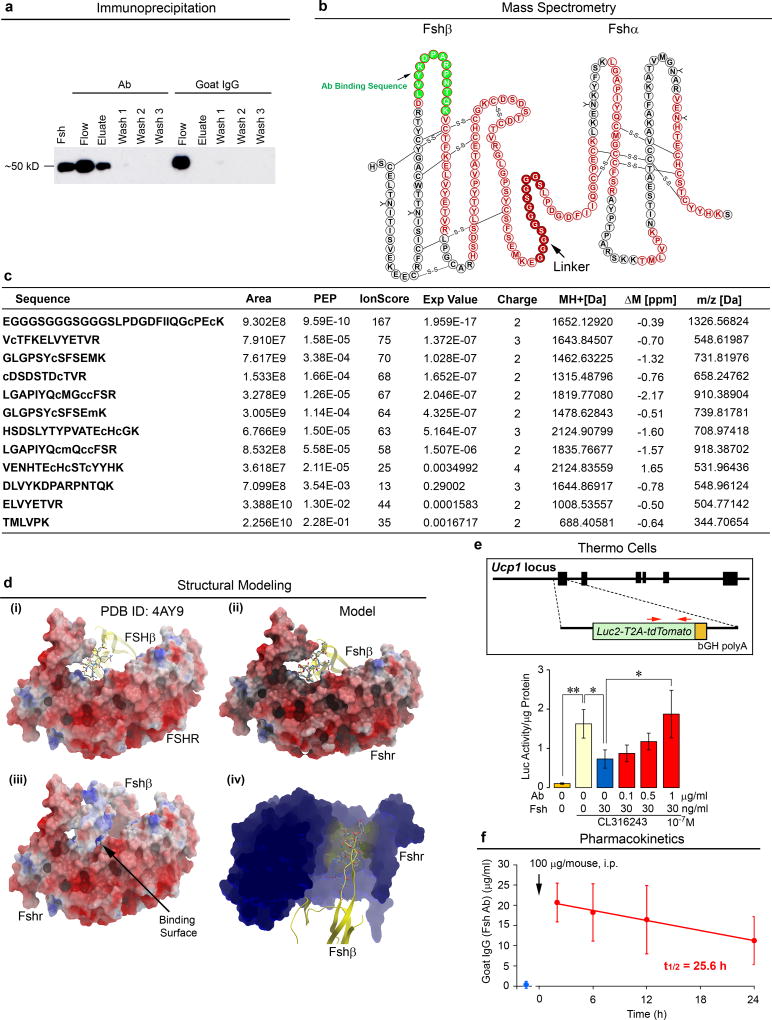
Recombinant mouse Fsh (Fshα-Fshβ chimera, 2 µg) was passed through resin (Pierce Co-Immunoprecipitation Kit, 26149, Thermo Scientific) with immobilized polyclonal Fsh Ab or goat IgG. Elution (Eluate), flow-through (Flow), and consecutive wash fractions (Wash) were collected and immunoblotted, as shown, with a mouse monoclonal Fsh Ab (Hf2) (a). The sequence of the Fshα-Fshβ chimera is shown (b). Peptides from the trypsinized eluate matched by mass spectrometry are marked in red, with the linker peptide shown in red solid circles. Ab was raised against LVYKDPARPNT QK (green-filled circles) (b). (c) Eluted fraction was trypsinized and analyzed by liquid chromatography tandem mass spectrometry (LC-MS/MS). Data were extracted and queried against a protein database containing the Fshα-Fshβ chimera sequence using Proteome Discoverer 1.4 (Thermo Scientific) and MASCOT 2.5.1 (Matrix Science). Oxidated methionine and carbamidomethylated cysteine residues are shown in small letters (m and c, respectively) (Methods for details). Crystal structure of the human FSH-FSHR complex (PDB id: 4AY9; FSHα not shown for clarity) indicates that the loop from the FSHβ subunit (yellow), containing the sequence LVYKDPARPKI QK (highlighted as sticks), tucks into a small groove generated by the FSHR (d–i). Computational modelling of Fsh bearing the peptide sequence LVYKDPARPNT QK shows an identical binding mode (d-ii). Positively charged residues (blue) of the peptide surface complement the negatively charged residues (red) of the Fshr binding site to generate strong electrostatic interactions at the binding surface (arrow) (d-iii). Given the small size of the groove (d-iv), binding of Ab to the peptide sequence will completely shield Fshβ from entering the Fshr binding pocket. That the Ab blocked Fsh action was confirmed experimentally using dedifferentiated brown adipocytes (Thermo cells), immortalized from the ThermoMouse (Jackson Labs). The latter has a Luc2-T2A–tdTomato transgene inserted at the initiation codon of the Ucp1 gene (e). Thermo cells retain BAT capacity and report Ucp1 activation using Luc2 as reporter. The effect of Fsh (30 ng/mL) and Fsh Ab (concentrations as noted) on Ucp1 expression was tested without fetal bovine serum (no endogenous Fsh) with the Arb3 agonist CL-316,243 (10−7 M). Notably, 1 µg/mL Fsh Ab completely abolished the inhibitory effect of near-circulating levels of Fsh on Ucp1 expression (e) (also see Fig. 3c). Mean ± SD; *P≤0.05, **P≤0.01; in triplicate. Fsh Ab measured as goat IgG in mouse serum (ELISA) following single injection of Ab (100 µg, i.p.) yielded serum goat IgG (Ab) concentrations that were 10–20-fold higher than those required to inhibit Fsh action in vitro (t1/2 = 25.6 hours) n=3/group (f). Two-tailed Student’s T-test, Mean ± SEM.
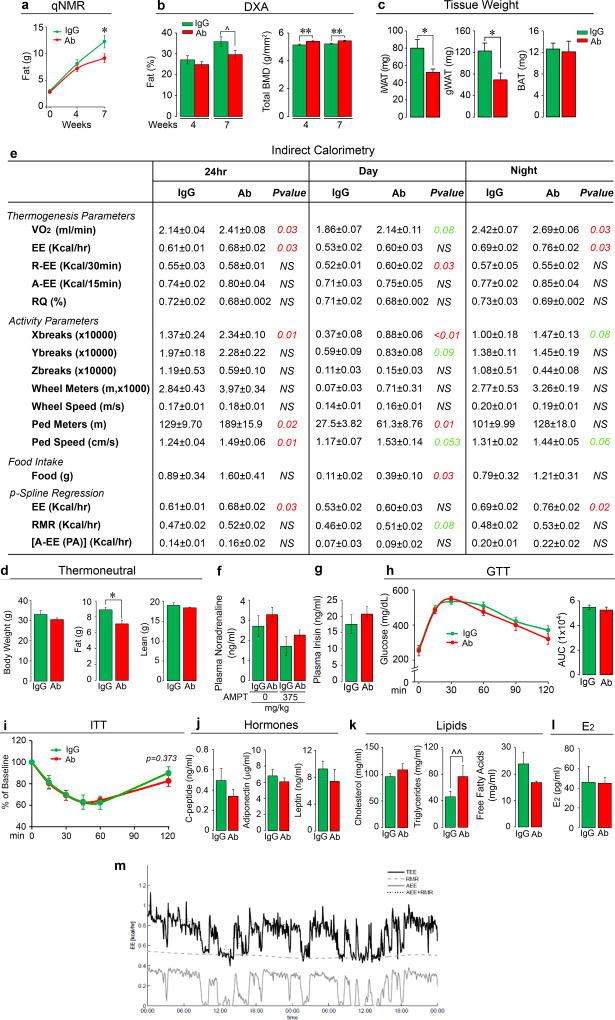
Results in Fig. 1 were confirmed independently by C.J.R.’s laboratory using quantitative NMR (qNMR) (n=12/group) (a), dual energy X-ray absorptiometry (DXA) (n=12 or 11/group) (b), and tissue weight measurements for inguinal (iWAT) and gonadal (gWAT) and brown adipose tissue (BAT) (n=9 or 10/group) (c). Fsh Ab effects on body fat under thermoneutral (30°C) conditions (d). 3-month-old male mice were housed at 30°C, fed on high-fat diet, and injected with Ab or IgG (200 µg/mouse/day, i.p.) for 3 weeks for measurements of body weight and fat and lean mass (qNMR) (n=3 or 4/group). Indirect calorimetry (e) (metabolic cages) showing 24-hour, day and night parameters of thermogenesis, namely O2 consumption (VO2), energy expenditure (EE), resting EE (R-EE), active EE (A-EE), and respiratory quotient (RQ), as well as physical activity parameters, including X-, Y- and Z-breaks, running distance (Wheel Meters), running speed (Wheel Speed), walking distance (Ped Meters) and walking speed (Ped Speed), and food intake (e). The data was independently analyzed by J.B.v.K. using penalized Spline (p-Spline) regression, with EE, resting metabolic rate (RMR) and physical activity-related EE [A-EE (PA)] shown (see Methods for details) (n=4/group). (f) Plasma noradrenaline levels (HPLC, courtesy Ralph Jacobs, Yale School of Medicine) measured in samples from groups of 3-month-old female mice treated with Ab or goat IgG (200 µg/mouse/day, i.p.) for 7 weeks, following which half the animals within the respective groups were sacrificed, and the other half were treated with the tyrosine hydroxylase inhibitor alpha-methyl-p-tyrosine (AMPT, 250 mg/kg, injection repeated after 2 hours with 125 mg/kg, i.p.) (n=7 or 8/group). Blood was drawn 2 hours following the last AMPT injection. (g) Plasma irisin levels (ELISA kit, Phoenix, EK-067-29) were measured following treatment of 3-month-old mice with Ab or goat IgG (200 µg/mouse/day, i.p., 5 and 7/group for IgG and Ab, respectively). We also measured serum meteorin-like (metrnl) (ELISA kit, R&D, DY7867) – all samples were below assay detection. Glucose tolerance testing (GTT) (n=12/group) (h) or insulin tolerance testing (ITT) (3 and 4/group for IgG and Ab, respectively) (i) showed no significant difference between mice receiving Fsh Ab or IgG (AUC: area under curve). Effect of Fsh Ab or IgG on plasma C-peptide (n=3 or 4/group), adiponectin (n=5/group) or leptin levels (n=5/group) (j); on total cholesterol, triglycerides or free fatty acids (n=5/group) (k); and estradiol (E2) (n=5 or 4/group) (l). Two-Tailed Student’s T-Test; *P≤0.05, **P≤0.01, ^P=0.0588, ^^P=0.065, or as shown; mean ± SEM. (m) Decomposition of TEE with p-Spline regression (e). Continuous time estimates of the RMR and AEE (PA) (shown as AEE) are shown for a typical calorimetry and activity dataset. The p-Spline regression model estimates the RMR from the correlation in time between the activity and energy expenditure data by minimizing the difference between the actual and predicted energy expenditure (AEE + RMR). By using a spline function instead of a constant intercept in the regression model, natural time variations that occur in the RMR can be determined and accurate estimates of the average RMR and AEE are obtained (for details, see Methods).
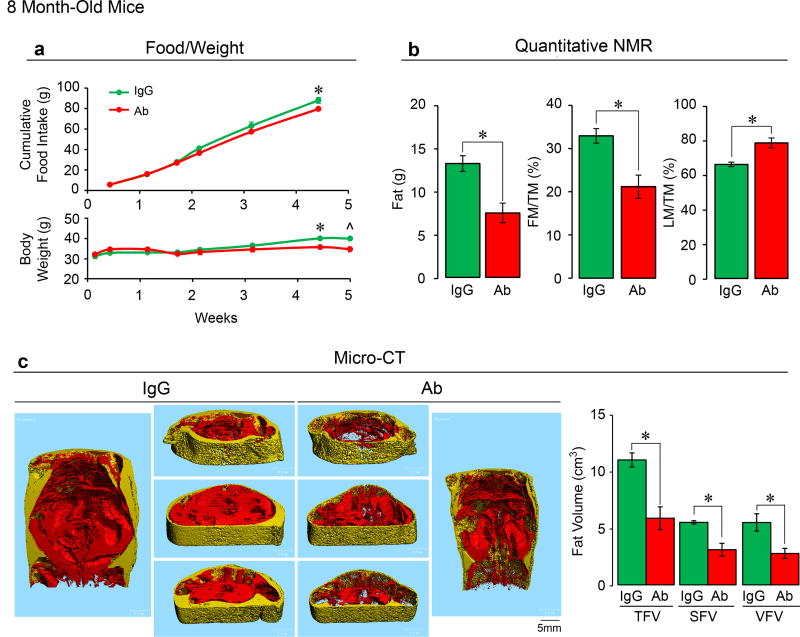
Effect of Fsh antibody (Ab) or goat IgG (200 µg/day/mouse, i.p.) injected daily into 8-month-old C57BL/6 male mice (Charles Rovers) pair-fed on high-fat diet (n=2 or 3 mice/group) (HFD, see Methods). Shown are food intake and body weight (a); fat mass, fat mass/TM (FM/TM) and lean mass/TM (LM/TM) (b); and total (TFV), subcutaneous (SFV) and visceral (VFV) fat volume (coronal and transverse sections; visceral, red; subcutaneous, yellow) (c). Two-Tailed Student’s T-Test; *P≤0.05; ^P=0.06, mean ± SEM.
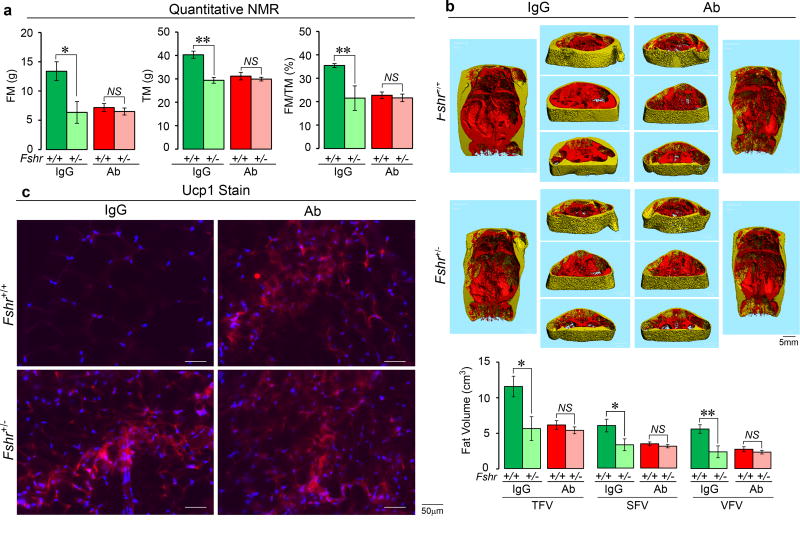
Effect of Fsh antibody (Ab) or goat IgG (200 µg/day/mouse, i.p.) in male wild-type (Fshr+/+) or Fshr-haploinsufficient (Fshr+/−) mice that were pair-fed on high-fat diet (HFD, see Methods) (n=3 or 5 mice/group). Shown are total mass (TM), fat mass (FM), and FM/TM (quantitative NMR) (a), as well as total (TFV), subcutaneous (SFV) and visceral (VFV) fat volume (micro-CT, coronal and transverse sections; visceral, red; subcutaneous, yellow) (b). Ucp1 immunostaining of subcutaneous WAT sections showed smaller and densely staining beige-like cells in Fshr+/− mice and in Fsh Ab-treated wild type mice. Two-Tailed Student’s T-Test; *P≤0.05, **P≤0.01; mean ± SEM.
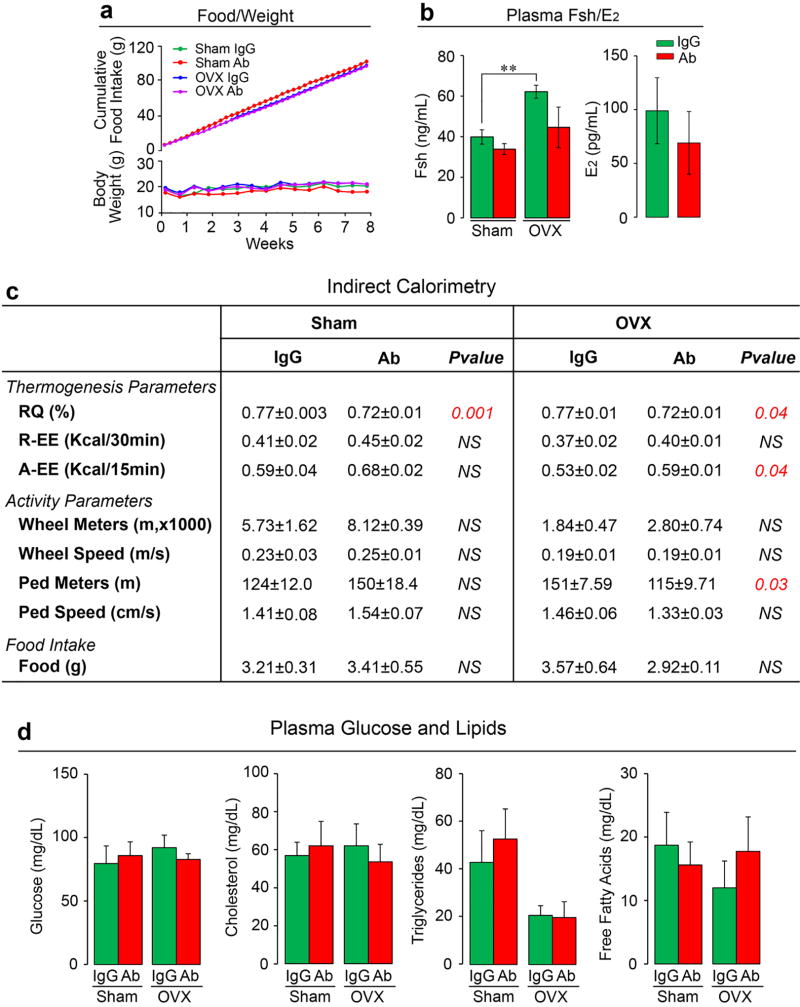
Ovariectomized or sham-operated mice on normal chow injected with Fsh antibody (Ab) or goat IgG (200 or 400 µg/mouse/day to sham-operated and ovariectomized mice, respectively) (see Methods and Fig. 2). Shown are food intake and body weight (a) (n=5/group); plasma Fsh and estrogen (E2) levels (plasma E2 mostly undetectable after ovariectomy) (n=4 or 5/group) (b). Indirect calorimetry (metabolic cages) showing 24-hour respiratory quotient (RQ), resting EE (R-EE), active EE (A-EE), running distance (Wheel Meters), running speed (Wheel Speed), walking distance (Ped Meters), walking speed (Ped Speed) and food intake (n=4/group) (c). Absent effects of Fsh Ab or IgG on plasma glucose, total cholesterol, triglycerides or free fatty acids (n=4 or 5 mice/group) (d). Two-Tailed Student’s T-Test; **P≤0.01, or as shown.
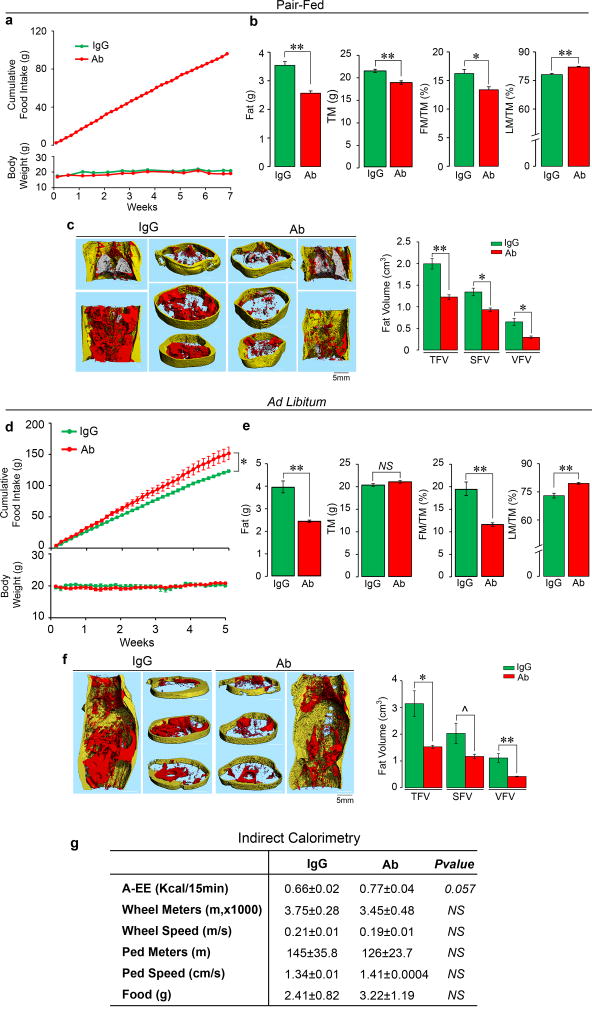
Three-month-old C56BL/6J female mice were either pair-fed (a–c) or fed ad libitum (d–f) with normal chow and injected with Fsh Ab or IgG (100 µg/mouse/day) for 7 and 5 weeks, respectively. For pair-feeding, the amount of chow consumed ad libitum by the IgG group was given to the Ab-treated group. For ad libitum feeding, the Ab-treated group was allowed ad libitum access to food and the same amount of chow was given to IgG group, with the left-over chow measured to determine food intake of the IgG group (see Methods). A significant increase in food intake by Ab-treated mice was noted in the ad libitum feeding protocol (d). Nonetheless, as with mice on a high-fat diet, in either feeding protocol (c.f. Fig. 1 and Extended Data Fig. 2), Ab caused a significant decrease in total mass (TM), fat mass (FM) and FM/TM and increase in lean mass/TM (LM/TM) on quantitative NMR (b) in mice that were pair fed. Body weight (a) was also reduced (see Excel Spreadsheet for P-values). However, while Ab-treated mice consumed significantly more chow compared to IgG-injected mice, they showed decrements in FM and FM/TM, but did not show a reduction in TM (e) or body weight (d) (also refer to Excel Spreadsheet for P-values). Micro-CT showed profound decreases in thoracoabdominal fat, visualized in representative coronal and transverse sections (red, visceral fat; yellow, subcutaneous fat), and upon quantitation of total (TFV), subcutaneous (SFV) and visceral fat volumes (VFV) (c, f) in both groups (n=4 or 5/group for a-f). Indirect calorimetry (metabolic cages) showing active EE (A-EE), running distance (Wheel Meters), running speed (Wheel Speed), walking distance (Ped Meters), walking speed (Ped Speed) and food intake (n=4/group) (g). Two-Tailed Student’s T-Test; *P≤0.05, **P≤0.01, ^P=0.069, or as shown.
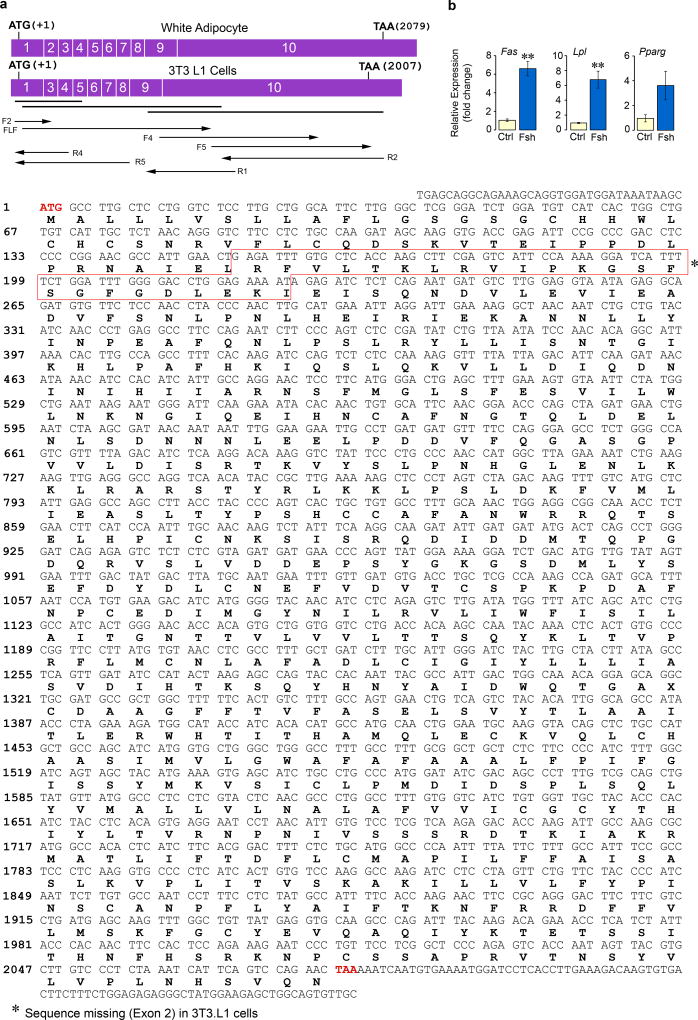
Total RNA was extracted from adipocytes derived from mesenchymal stem cells (MSC-ad) that were isolated from mouse ear lobes or 3T3.L1 cells (a) and cultured in differentiation medium (MDI, containing IBMX, dexamethasone, and insulin). Total RNA was reverse transcribed and PCR performed using overlapping primer sets (bold lines) to amplify three large cDNA fragments. Overlapping regions covered by primers for Sanger sequencing are shown by arrows. The sequence of the Fshr in MSC-ad cells was identical to murine ovarian Fshr (GenBank ID: NM_013523.3) (a). However, the 3T3.L1 Fshr lacked exon 2 and displayed three amino acid variations (H158Y, F190L and K243E), but was fully functional in terms of its ability to reduce cAMP levels and Ucp1 expression in response to Fsh (c.f. Figs. 3b and 3c). (b) Fsh also triggered an upregulation of the lipogenic genes Fas and Lpl with a marginal increase in Pparg (**P≤0.01, fold-change; qPCR, three biologic replicates, in triplicate). The presence of a signaling-efficient Fshr in adipocytes is consistent with FSHR gene expression in human adipose tissue in GTex and GeneCard databases (http://www.gtexportal.org/home/gene/FSHR ; http://www.genecards.org/cgi-bin/carddisp.pl?gene=FSHR&keywords=fshr ). We likewise find in the mouse that Fshr expression in WAT is lower than that in the ovary: 1.00±0.47 vs 13.8±1.31 (P<0.01, fold-change, n=3 or 4 mice/group, qPCR, in triplicate). Two-tailed Student’s t-Test, Mean ± SEM shown.
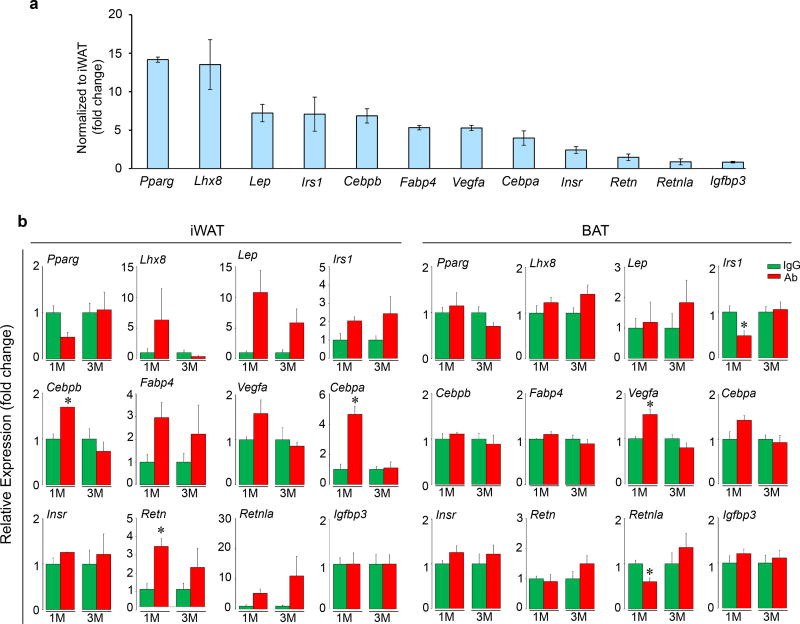
Three-month-old C57BL/6J mice pair-fed on high-fat diet were injected daily for 8 weeks with Fsh antibody (Ab) or goat IgG (200 µg/mouse/day, i.p.). Shown is the relative expression of genes (names noted) in BAT versus WAT (a) (normalized to housekeeping genes and inguinal WAT, iWAT). Consistent with adipocyte beiging was enhanced brown gene expression (qPCR) in iWAT and BAT at 1 and/or 3 months (M) (normalized to housekeeping genes and to IgG) (b). Two-tailed Student’s t-Test; mean ± SEM; *P≤0.05 (qPCR, n=3 or 6 biological replicates, measured in triplicate). Please also refer to Fig. 4d.
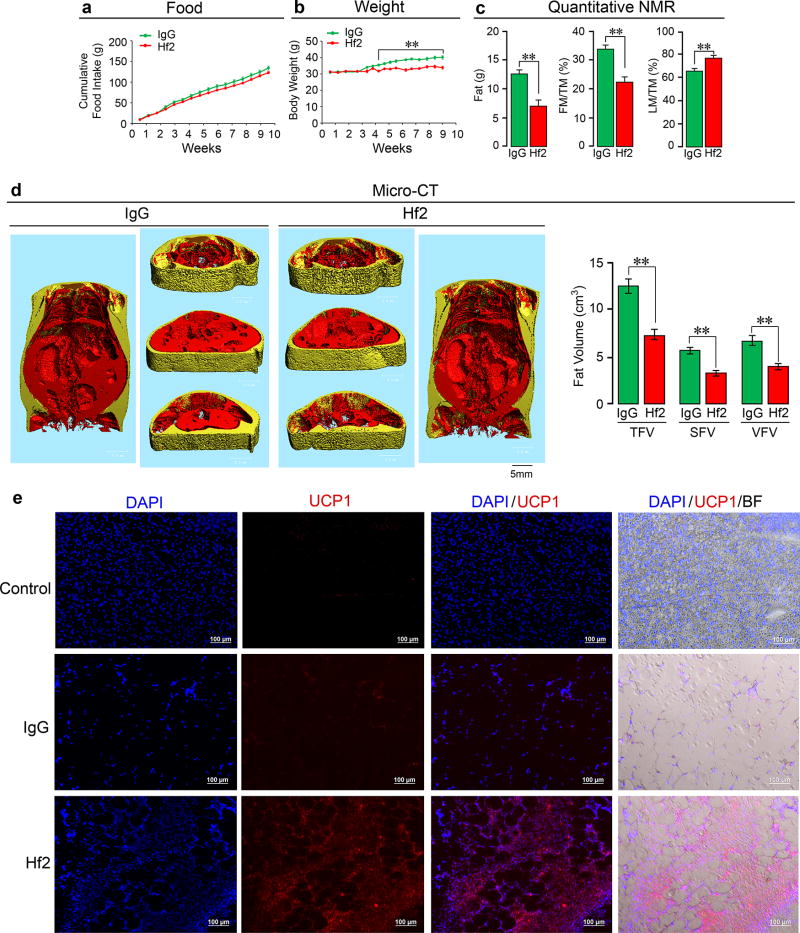
The monoclonal antibody Hf2 was raised against the 13-amino-acid-long human FSHβ sequence (LVYKDPARPKI QK), which corresponds to the mouse Fshβ sequence (LVYKDPARPNT QK) against which the polyclonal Ab was raised (please refer to Extended Data Fig. 1). Hf2 specifically binds human Fshβ in an ELISA. We have also sequenced Hf2 (data available on request). Shown is the effect of a ~9-week exposure to Hf2 or mouse IgG (200 µg/day/mouse, i.p.), injected daily into 6-month-old C57BL/6J mice pair-fed on high-fat diet (see Methods). Food intake (a), body weight (b), fat mass, fat mass/total mass (FM/TM) and lean mass/TM (LM/TM) (quantitative NMR) (c), and total (TFV), subcutaneous (SFV) and visceral (VFV) fat volume (micro-CT, coronal and transverse sections; visceral, red; subcutaneous, yellow) (d) are shown (n=5/group for a–d). Fluorescence and bright field micrographs showing Ucp1 immunostaining in frozen sections of visceral WAT (vWAT) (e). DAPI: nuclear staining. Negative control: irrelevant IgG in place of first antibody. There is a dramatic increase in Ucp1 immunostaining with Ab in vWAT, together with cell condensation, reminiscent of beiging. Statistics: Two-tailed Student’s t-Test, **P≤0.01; mean ± SEM. For body weight changes, please see Excel Spreadsheet. The proof-of-concept study shows that a profound anti-obesity action can result from targeting FSHβ with a monoclonal Ab, a prelude to translational efforts towards the future use of a humanized Hf2 or its equivalent in people.
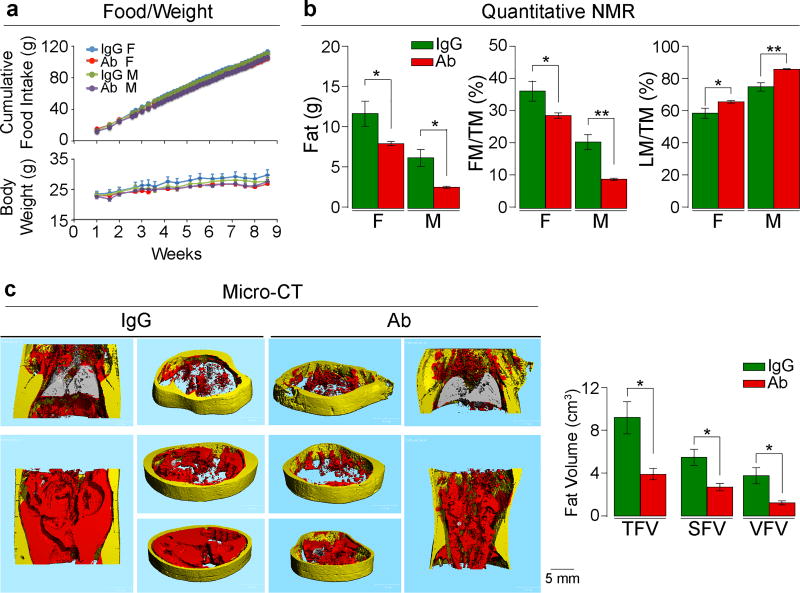
Fsh antibody (Ab) or goat IgG (200 µg/day/mouse, i.p.) injected for 8 weeks into 3-month-old female (F) and male (M) C57BL/6J mice pair-fed on high-fat diet. Shown are food intake and body weight (a); fat mass, fat mass/total mass (FM/TM) and lean mass/TM (LM/TM) by quantitative NMR (n=4 or 5 mice/group) (b); and total (TFV), subcutaneous (SFV) and visceral (VFV) fat volume by micro-CT (representative coronal and transverse sections from the same experiment; visceral, red; subcutaneous, yellow) (n=5 mice/group) (c). Two-tailed Student’s T-test; *P≤0.05, **P≤0.01; mean ± SEM.
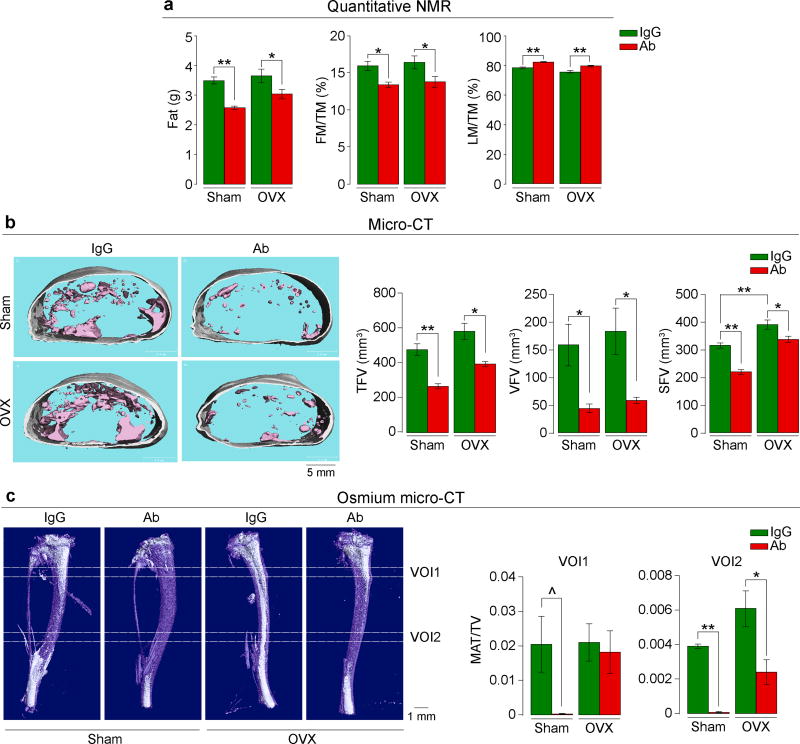
Ovariectomized or sham-operated mice on normal chow injected with Fsh antibody (Ab) or goat IgG (200–400 µg/day) for 8 weeks. Shown are fat mass, fat mass/total mass (FM/TM) and lean mass/TM (LM/TM) (n=5 or 9 mice/group, pooled) (a). Total (TFV), visceral (VFV) and subcutaneous (SFV) fat volume in mice fed ad libitum (transverse sections; pink, visceral; white, subcutaneous) (n=5 mice/group) (b). Bone marrow adipose tissue (white) quantitated as MAT/total volume (TV) at two voxels of interest (VOI1 and VOI2) (n=3 mice/group) (c). Images in (b) and (c) are from the respective experiments. Two-tailed Student’s T-test; ^P=0.067, *P≤0.05, **P≤0.01; mean ± SEM.
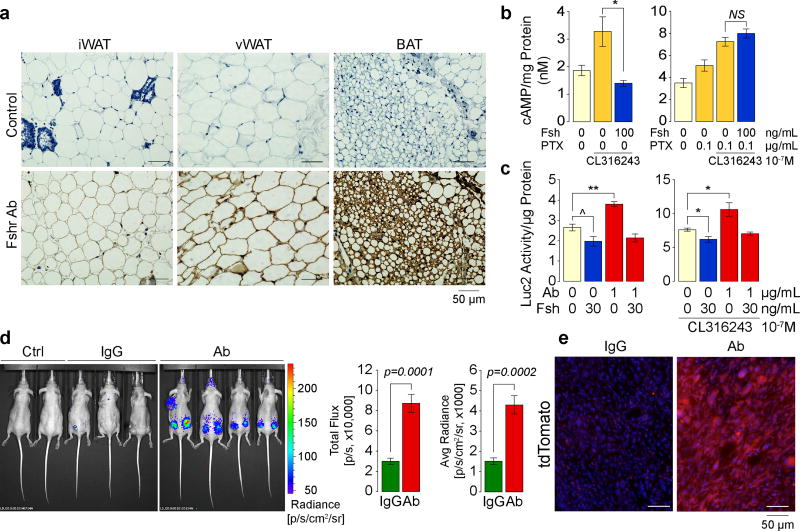
Immunostaining with an anti-Fshr antibody of inguinal (iWAT) and visceral WAT (vWAT) and BAT sections (see Methods) (representative from 4 mice/group) (a). Cyclic AMP levels in differentiated 3T3.L1 cells (3 biologic samples, in duplicate) (b). Luc2 activity in Thermo cells cultured in 10% (v/v) FBS (containing Fsh) (three biological replicates) (c). Luc2 radiance in nu/nu mice (normal chow) injected with Ab or IgG (200 µg/day, i.p., 8 weeks) after implantation of 1.5×10⁶ Thermo cells into both flanks (two mice were also transplanted in upper trunk) (3 and 4 mice/group) (d). Ctrl: two non-transgenic mice injected with D-Luciferin. (e) tdTomato fluorescence in frozen sections of cell-implanted areas from the experiment in (d). Two-tailed Student’s T-test, *P≤0.05, **P≤0.01, ^P=0.0756; mean ± SEM.
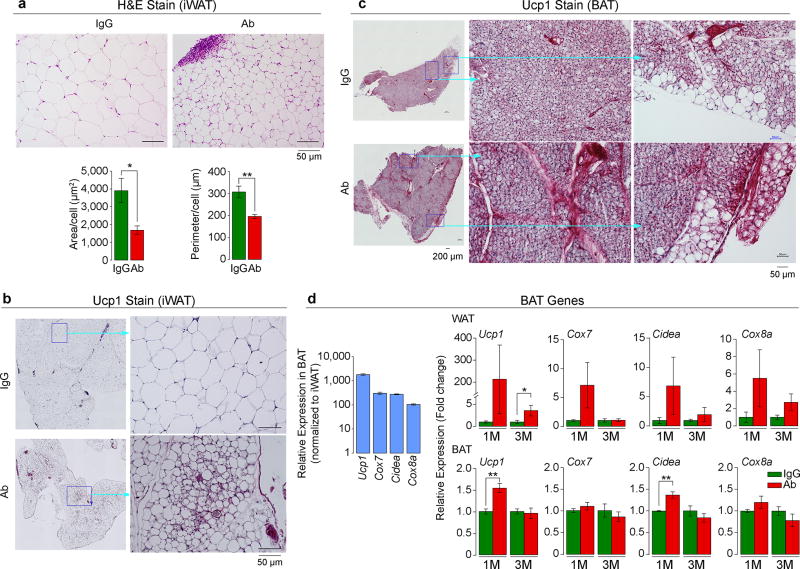
Cell size and perimeter in hematoxylin/eosin-stained sections of inguinal white adipose tissue (iWAT) (a), as well as Ucp1 immunostaining of iWAT (b) and BAT (c) following injection of Fsh antibody (Ab) or goat IgG (200 µg/mouse, i.p., 8 weeks) to 3 month-old C57BL/6J mice pair-fed on high-fat diet (n=4 or 5 mice/group). (d) Relative expression of genes in BAT and WAT at 1 and/or 3 months of Ab or IgG treatment (M) (normalized to housekeeping genes and to IgG) (3 or 6 biologic replicates, in triplicate, by qPCR). Two-tailed Student’s T-test; mean ± SEM; *P≤0.05, **P≤0.01.
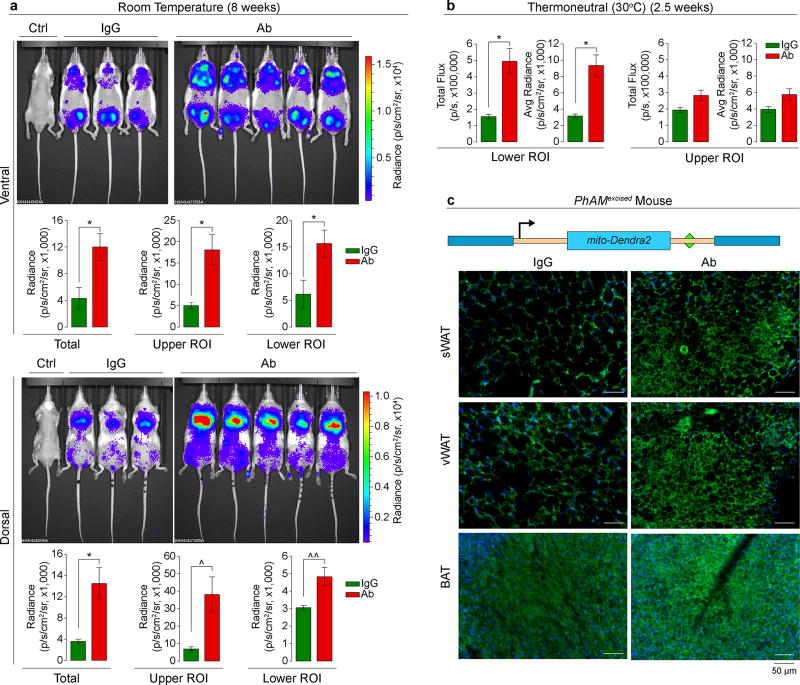
Three-month-old male ThermoMice pair-fed on high-fat diet and treated with Fsh antibody (Ab) or goat IgG (200 µg/mouse) for 8 weeks at room temperature (n as shown) (a) or 2.5 weeks at thermoneutral (30°C) conditions (n=3 or 4 mice/group) (b). ROI, region of interest. Ctrl, non-transgenic mice injected with D-Luciferin. Two-tailed Student’s T-test; *P≤0.05, ^P=0.060, ^^P=0.051; mean ± SEM. Construct used to generate the PhAMexcised mouse (mito: Cox8 mitochondria-localizing signal). Fluorescence captured in subcutaneous WAT (sWAT), visceral WAT (vWAT) and BAT after 2 weeks of Ab or IgG injection (c). Representative images from experiment using 3 mice/group.
Comment in
-
Adipose tissue: FSH antibody prevents obesity and loss of bone.Nat Rev Endocrinol. 2017 Jul;13(7):375. doi: 10.1038/nrendo.2017.70. Epub 2017 Jun 2. Nat Rev Endocrinol. 2017. PMID: 28574059 No abstract available.
-
Endocrinology: Reducing fat and building bone.Nat Rev Drug Discov. 2017 Jul;16(7):454-455. doi: 10.1038/nrd.2017.121. Epub 2017 Jun 16. Nat Rev Drug Discov. 2017. PMID: 28620172 No abstract available.
-
Burning Fat and Building Bone by FSH Blockade.Cell Metab. 2017 Aug 1;26(2):285-287. doi: 10.1016/j.cmet.2017.07.018. Cell Metab. 2017. PMID: 28768167 Free PMC article.
References
Publication types
MeSH terms
Substances
Grants and funding
- R01 AA023416/AA/NIAAA NIH HHS/United States
- P20 GM103465/GM/NIGMS NIH HHS/United States
- AR067066/NH/NIH HHS/United States
- R01 DK113627/DK/NIDDK NIH HHS/United States
- AR065932/NH/NIH HHS/United States
- R01 AG023176/AG/NIA NIH HHS/United States
- P30 GM103392/GM/NIGMS NIH HHS/United States
- R01 AR067066/AR/NIAMS NIH HHS/United States
- P30 GM106391/GM/NIGMS NIH HHS/United States
- AG40132/NH/NIH HHS/United States
- R24 DK092759/DK/NIDDK NIH HHS/United States
- R01 AG040132/AG/NIA NIH HHS/United States
- R01 AR065932/AR/NIAMS NIH HHS/United States
- DK113627/NH/NIH HHS/United States
- R01 DK080459/DK/NIDDK NIH HHS/United States
- R24 DK092759-06/NH/NIH HHS/United States
- P01 AG029531/AG/NIA NIH HHS/United States
- P30 DK026687/DK/NIDDK NIH HHS/United States
- R56 DK083658/DK/NIDDK NIH HHS/United States
- AG23176/NH/NIH HHS/United States
LinkOut - more resources
Full Text Sources
Other Literature Sources
Molecular Biology Databases
