. 2017 Jun 1;546(7656):101-106.
doi: 10.1038/nature22343. Epub 2017 May 22.

A neural circuit architecture for angular integration in Drosophila

Affiliations

A neural circuit architecture for angular integration in Drosophila

Jonathan Green et al. Nature. .

Abstract

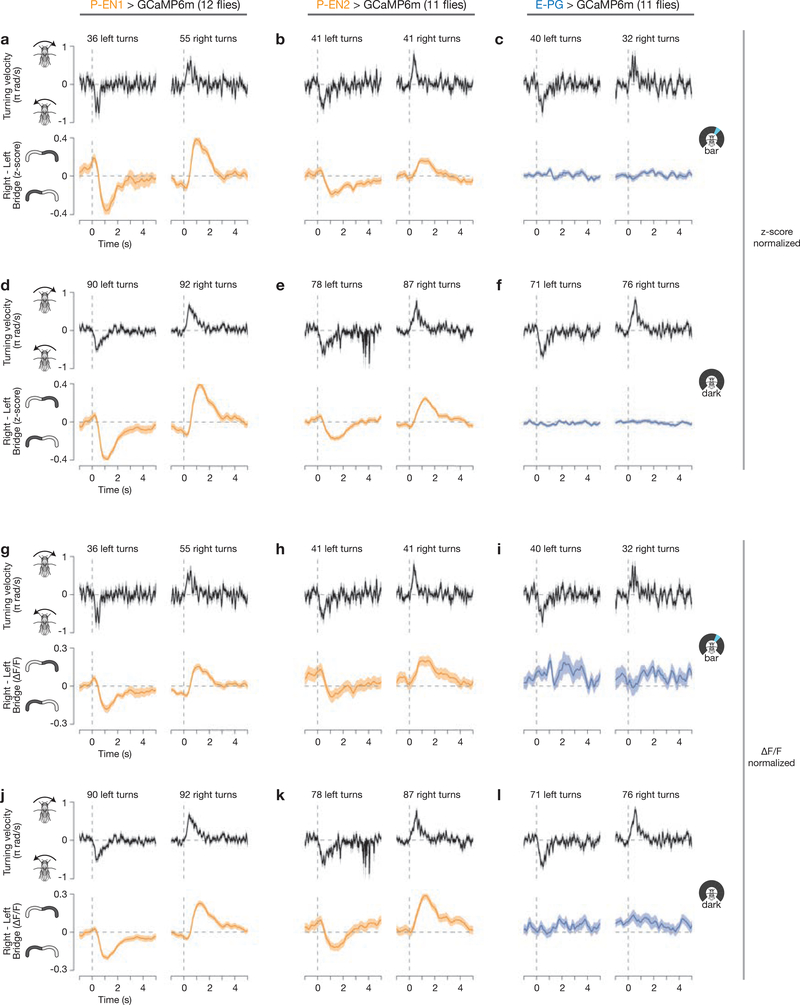
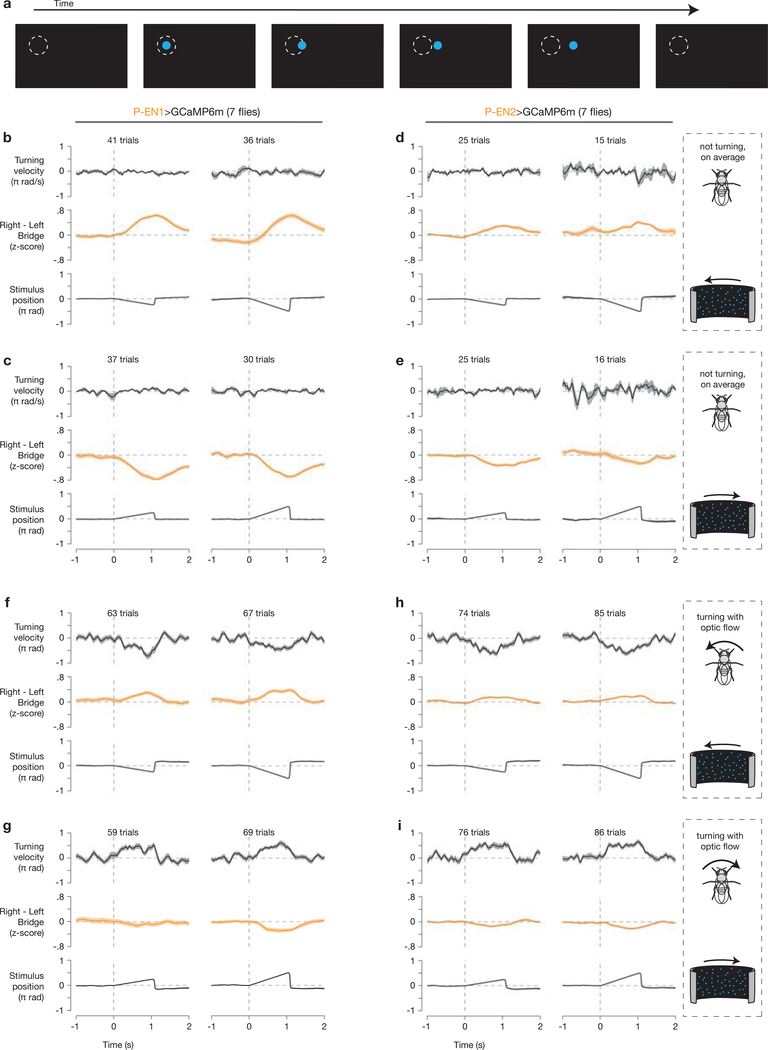
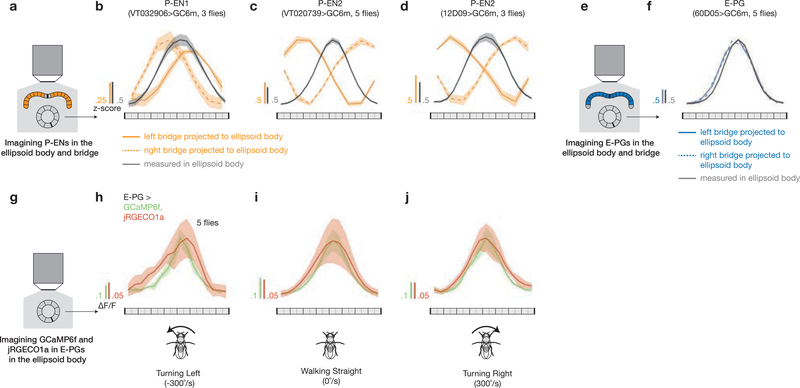
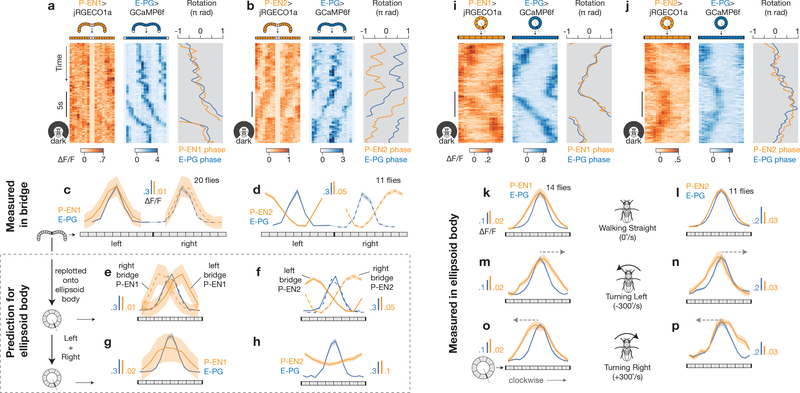
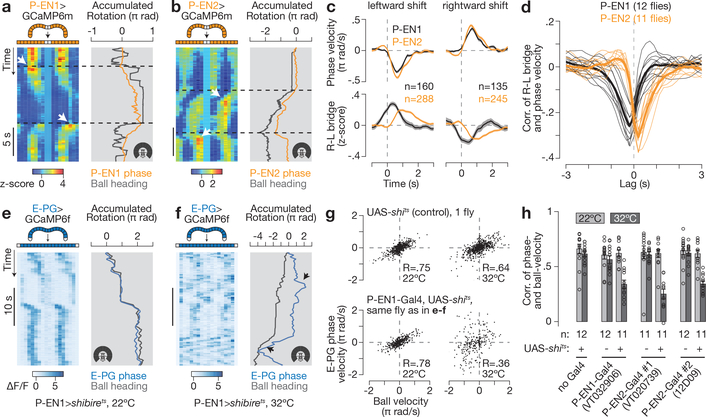
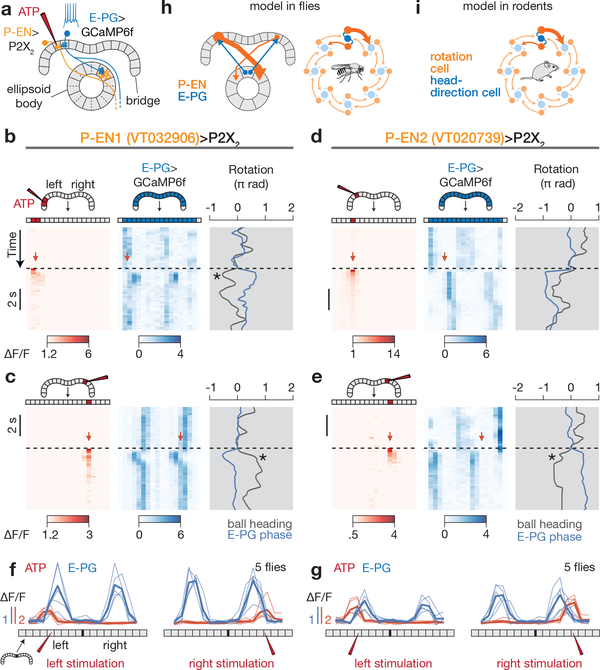
Many animals keep track of their angular heading over time while navigating through their environment. However, a neural-circuit architecture for computing heading has not been experimentally defined in any species. Here we describe a set of clockwise- and anticlockwise-shifting neurons in the Drosophila central complex whose wiring and physiology provide a means to rotate an angular heading estimate based on the fly's angular velocity. We show that each class of shifting neurons exists in two subtypes, with spatiotemporal activity profiles that suggest different roles for each subtype at the start and end of tethered-walking turns. Shifting neurons are required for the heading system to properly track the fly's heading in the dark, and stimulation of these neurons induces predictable shifts in the heading signal. The central features of this biological circuit are analogous to those of computational models proposed for head-direction cells in rodents and may shed light on how neural systems, in general, perform integration.


Figures

Extended Data Figure 1 |
Extended Data Figure 1 |. Processing of protocerebral bridge signals from E-PG, P-EN1 and P-EN2 neurons in the presence of a closed-loop bar.
a, Each z slice, averaged over an entire E-PG>GCaMP6m recording, with glomeruli outlined. b, Processing of the EPG>GCaMP6m signal to generate the plot in Fig. 1g. From left to right: raw mean signal in each glomerulus over time, z-score normalization for each glomerulus independently, ΔF/F normalization for each glomerulus independently, power spectrum of the ΔF/F signal computed for each time point (row) independently. The E-PG phase extracted from the Fourier component with a period of eight glomeruli of the ΔF/F bridge signal is overlaid on each GCaMP plot in black. c, E-PG phase (blue) shifted with a constant offset to best match the bar position (dark grey). d, e, Same as a, b but for P-EN1 neurons originally plotted in Fig. 1h. That P-EN cells do not innervate the middle two glomeruli of the bridge slightly complicates the power spectrum analysis. Specifically, black arrows highlight transient peaks in the power spectrum at approximately 16 glomeruli, which are artefacts of the P-EN GCaMP peaks crossing the centre of the bridge. f, From left to right: P-EN1 ΔF/F signal with the middle two glomeruli filled in by averaging signals located one period (8 glomeruli) away, power spectrum of the ‘filled in’ ΔF/F bridge signal (note absence of artefactual peaks at 16 glomeruli), P-EN phase extracted from the Fourier component with a period of 8 glomeruli of the ‘filled in’ ΔF/F bridge signal (orange), shifted with a constant offset to best match the bar position (dark grey). gi, Same as df but for P-EN2 neurons originally plotted in Fig. 1i. In all plots showing bar position over time, the gap in the arena where the bar is not displayed is shown in grey. jl, Periodicity of the bridge signal at peak power in the power spectrum for each cell type. Each circle represents one fly. The mean and s.d. are shown. mo, Offsets that minimize the distance between GCaMP phase and bar position for all 50-s trials for each cell type. Only data for which the bar was visible were included in computing the offsets. In o, fly 10 had only three bar trials. See Methods for details. a.u., arbitrary units; DFT, discrete Fourier transform.
Extended Data Figure 2 |
Extended Data Figure 2 |. Processing of protocerebral bridge signals from E-PG, P-EN1 and P-EN2 neurons in the dark.
a, Processing of the E-PG>GCaMP6m signal to generate the plot in Fig. 2g. Bridge signals are plotted over time as in Extended Data Fig. 1b, but in the dark. b, Phase from the ΔF/F signal and ball position. Because the phase and ball position drift over time in the dark, we did not align the two signals by finding the best offset over the entire trial; rather, we nulled the offset between the GCaMP phase and ball heading at time zero, letting the signals drift naturally over time. For display purposes, we applied a constant gain to the ball position signal, which we determined from the slope of a linear regression between the GCaMP phase and ball velocity. c, d, P-EN1 signals (originally plotted in Fig. 4a) over time as in Extended Data Fig. 1e, f, but in the dark. e, f, Same as c, d, but for P-EN2 signals (originally plotted in Fig. 4b). The ball position gains are 0.75 for E-PG (b), 1.0 for P-EN1 (d) and 0.89 for P-EN2 (f). For P-EN1, the slope of the linear regression between phase and ball velocity was poorly estimated (see Supplementary Discussion) and thus we hand-picked the gain (1.0) in this case. That these gains are not all equal does not mean that each cell type has its own gain (see Supplementary Discussion). Note the different timescale compared to Extended Data Fig. 1. Also note that the time window was expanded in a, b, compared to Fig. 2g, to be the same length as in cf. gi, Periodicity of the bridge signal at peak power in the power spectrum for each cell type. Each circle represents one fly. The mean and s.d. are shown.
Extended Data Figure 3 |
Extended Data Figure 3 |. Example visual tuning curves in E-PG, P-EN1 and P-EN2 neurons across glomeruli in the protocerebral bridge.
a–c, Tuning curves of GCaMP activity as a function of bar position for each glomerulus in a sample fly for E-PGs (a), P-EN1s (b) and P-EN2s (c). Data associated with bar positions in the 90° gap in the back of the arena (not visible) are not shown. The mean and s.d. across time points for each 22.5° bar position bin are shown.
Extended Data Figure 4 |
Extended Data Figure 4 |. P-EN neuroanatomy: explanation for the numbering scheme, sytGFP localization, and multicolour single cell labelling.
a, Numbering used in the literature for the protocerebral bridge and ellipsoid body. b, Rearrangement of the left and right bridges and a linearized ellipsoid body that highlights the pattern of anatomical projections for E-PGs and P-ENs. Arrows indicate the expected direction of signalling (dendrite to axon) for each cell, (also see e, f). The dashed line in a shows where the ellipsoid body is opened to display it linearly. Tile 1 is repeated as a visual aid, as the ellipsoid body is circular. c, d, Same as a, b but using a modified numbering scheme. In d, the numbers are constant along each column (with the exception that glomerulus 9 from either side of the bridge matches up with ellipsoid body tile 1), highlighting the fact that E-PGs project within the same column, whereas left-bridge P-ENs project to the right (+1, or clockwise) and right-bridge P-ENs project to the left (–1, or counterclockwise). e, f, Sample images of synaptotagmin-GFP (sytGFP, labelling putative axonal terminals) and tdTomato (labelling the entire cell) expressed in P-EN1 (e) and P-EN2 (f) neurons. These data are consistent with P-ENs having extensive presynaptic terminals in the ellipsoid body but few in the protocerebral bridge. Gl, Sample multicolour flip-out images for P-EN neurons driven by VT032906–Gal4 (P-EN1, g, h), VT020739–Gal4 (P-EN2, i, j), and 12D09–Gal4 (P-EN2, k, l). The multicolour flip-out method allows one to visualize single randomly selected cells from a Gal4 driver line (which might label a dense thicket of cells) in their entirety, like a multicoloured Golgi stain. The neuropil is shown in grey. Single neurons are coloured. Glomerulus numbers, including L for left and R for right, are shown in the bridge. After tracing each neuron from the bridge to the ellipsoid body, we labelled the terminals in the ellipsoid body with the bridge glomerulus from which they originated, using our revised numbering scheme (c, d). VT032906–Gal4 stains a neuron type that passes near the bridge, but does not innervate the bridge, ellipsoid body or noduli (for example, the green neuron in g). VT020739–Gal4 stains a neuron type that innervates the noduli, but not the ellipsoid body or bridge (for example, the blue neurons innervating the noduli from the sides in j). Virtually all neurons labelled in the bridge and ellipsoid body were consistent with P-ENs (see Supplementary Information Table 1). 12D09–Gal4 very rarely revealed flip-outs of protocerebral bridge local neurons, not shown here (see Supplementary Information Table 1). eb, ellipsoid body; no, noduli; pb, protocerebral bridge.
Extended Data Figure 5 |
Extended Data Figure 5 |. P-EN1 and P-EN2 bridge asymmetry during turns in closed-loop bar and dark conditions, computed with z-score and ΔF/F normalization.
Ac, Right–left bridge activity (bottom) and the fly’s turning velocity (top), averaged over multiple turns, for P-EN1s (a), P-EN2s (b) and E-PGs (c), as in Fig. 2h–j, in closed-loop bar conditions. The right–left GCaMP signal is computed from z-score normalized data. df, Same as ac but in constant darkness. gl, Same as af, except that the right-left GCaMP signal is computed from ΔF/F normalized data. The mean and s.e.m. across turns are shown. Only data for which the bar was visible on the front 270° of the LED arena were included for closed-loop bar plots. See Methods for details.
Extended Data Figure 6 |
Extended Data Figure 6 |. P-EN1 and P-EN2 asymmetries are driven in part by optic flow.
a, Sample trajectory of one of hundreds of dots used to create our optic flow stimulus. Each dot appeared at a random location, travelled 4 azimuthal pixels (7.5°), and then disappeared. The dashed circle is drawn as a point of reference, and was not presented on the screen. b, c, Right–left P-EN1 bridge activity during open-loop optic flow to the left (b) and to the right (c) at 45°/s (left column) and 90°/s (right column) during trials in which the fly did not, on average, turn ( ± 10°/s) in response to the optic flow stimulus. d, e, Same as b, c but for P-EN2 neurons. fi, Same as be, except that trials were included only if the fly turned with the direction of optic flow (>10°/s in the direction of optic flow). The mean and s.e.m. across trials are shown. For display, the stimulus position was nulled at time zero to highlight the movement of the stimulus. In trials in which flies turned with the direction of optic flow, the direction of visual motion experienced on their retinas was opposite to that expected from their own turning behavior, that is, the visual optic flow inputs (presented in open loop) indicated an angular velocity with the opposite sign to that indicated by proprioceptive/efference-copy inputs. That we observe a weaker asymmetry in f-i compared to b-e argues that optic flow and proprioceptive/efference-copy inputs (probably alongside vestibular inputs) are somehow combined to generate the P-EN bridge asymmetry.
Extended Data Figure 7 |
Extended Data Figure 7 |. Co-labelling of P-EN1 and P-EN2 driver lines.
Ac, Maximum z-projection of a brain with 12D09-driven neurons expressing GFP and VT032906-driven neurons expressing tdTomato. a, GFP (12D09) signal. b, tdTomato (VT032906) signal. c, Composite of a and b. Physiological experiments suggest that VT032906 primarily labels P-EN1 neurons, whereas 12D09 primarily labels P-EN2 neurons (Fig. 3, Extended Data Fig. 8b, d). As expected, most P-EN neurons are primarily labelled by one of the two drivers, but some neurons are labelled by both (examples denoted with asterisks). Df, Same as ac but with VT020739-driven neurons expressing tdTomato. Physiological experiments suggest that both 12D09 and VT020739 primarily label P-EN2 neurons (Fig. 3, Extended Data Fig. 8c, d). As expected, almost all labelled P-EN neurons are labelled by both P-EN2 drivers. P-ENs often showed fluorescent signals whose strength varied across glomeruli, which could reflect varying innervation densities across the bridge. They could also reflect incomplete targeting of P-ENs by our driver lines.
Extended Data Figure 8 |
Extended Data Figure 8 |. Simultaneous imaging of the protocerebral bridge and ellipsoid body for each cell type separately and dual-colour imaging of GCaMP6f and jRGECO1a in E-PGs in the ellipsoid body.
a, We imaged the bridge and ellipsoid body in the same fly, at the same time, using a tall z-stack that encompassed both structures, to determine the relationship between the signals measured in each structure. b, Phase-nulled P-EN1 signals measured in the bridge (orange) and ellipsoid body (grey). The signals measured in the bridge were replotted onto the ellipsoid body using the P-EN projection pattern. c, d, Same as b but for P-EN2 signals from VT020739-Gal4 (c) and 12D09-Gal4 (d). e, As in a but for imaging E-PGs, with the bridge in blue. f, Same as b for E-PGs, with the left and right bridge in blue. In bd and f, the mean and s.e.m. across flies are shown (in f, the s.e.m. for the bridge curves (blue) are omitted for clarity). Both the bridge and ellipsoid body signals were nulled using the ellipsoid body phase. Note that the positions of the left- and right-bridge peaks are inverted between P-EN1 and P-EN2. These results are consistent with the dual-imaging experiments in Fig. 3, and support the idea that the results in Fig. 3 were not due to crosstalk between the red and green channels. g, Schematic illustrating imaging from the ellipsoid body. hj, Phase-nulled ellipsoid body signals of GCaMP6f and jRGECO1a co-expressed in E-PGs, computed for when the fly turned left (h, –300°/s), walked straight (i, 0°/s) or turned right (j, +300°/s), 300 ms before the calcium signal, as in Fig. 3k-p. The mean and s.e.m. across flies are shown. We observed no consistent, strong asymmetries in the jRGECO1a and GCaMP6f signals during left or right turns when both indicators were expressed in E-PGs. These data argue that the asymmetries we observed in dual imaging of P-ENs and E-PGs in the ellipsoid body (Fig. 3m–p) were not an artefact of indicator kinetics. Data are averaged over bar and dark conditions.
Extended Data Figure 9 |
Extended Data Figure 9 |. Analysis of ellipsoid body asymmetry in P-EN1s and P-EN2s relative to E-PGs in the ellipsoid body.
a, Mean E-PG and P-EN1 activity in the ellipsoid body triggered on when the fly was turning to the left (–300°/s, upper panel) or right (+300°/s, lower panel), as in Fig. 3m–p, but over time. The P-EN1 and E-PG signals were phase-nulled using the E-PG phase. b, Same as a but for P-EN2 activity. c, d, When analysing the two-colour imaging experiments in Fig. 3i–p, we calculated the cross correlation between the ellipsoid body asymmetry in P-EN1 (c) or P-EN2 (d) and the E-PG phase velocity in the ellipsoid body. A positive correlation indicates an increased P-EN signal in the direction in which the E-PG peak is moving. A positive lag indicates that the P-EN asymmetry comes after the change in the E-PG phase. Thus, the P-EN1 peak tends to lead the E-PG peak whereas the P-EN2 peak tends to lag behind the E-PG peak. Note that we also observed a smaller, negative, late peak in the signal driven by the P-EN1 Gal4 and a smaller positive, early peak in the signal driven by the P-EN2 Gal4, suggesting that each Gal4 line contains some number of both P-EN1 and P-EN2 cells, but with more of one than the other. e, f, Same as c, d, except that the P-EN ellipsoid body asymmetry is correlated with the fly’s turning velocity. A positive lag indicates that the P-EN asymmetry comes after the fly turns. Arrows indicate the lag where the mean correlation was greatest. In cf, thin lines represent single flies and thick lines represent the mean across flies. Data are averaged over bar and dark conditions.
Extended Data Figure 10 |
Extended Data Figure 10 |. The effects of blocking P-EN synaptic transmission on the ability of E-PGs to track a landmark, and controls for the P2X2 experiments.
a, b, E-PG activity in the bridge from the same fly as in Fig. 4e, f (P-EN1>shibirets), except with a closed-loop bar, at 22 °C (a) and 32 °C (b). c, Correlations between phase and bar velocity, for three P-EN-Gal4 lines driving shibirets, with parental controls. Each circle represents one fly. The mean and s.e.m. across flies are shown. d, Same as c, but plotting circular correlations between phase and bar position. Only data in which the bar was visible in the front 270° of the arena were used for calculating correlations. Trials during which the bar was visible for less than 10 s were excluded, with some flies having no trials passing this criterion. The total number of flies (without excluding flies that did not pass the above criterion) for each genotype is shown. The mean and s.e.m. across included flies are shown. Only VT020739–Gal4 seems to affect the ability of the E-PG signal to track a visual landmark, suggesting that perhaps this effect is due to non-P-EN neurons targeted by this line, for example visual lobe neurons, or that this effect requires stronger Gal4 expression in P-ENs in this line. e, The change in the phase-nulled E-PG>GCaMP6f and ATP (Alexa594) signals during an ATP pulse, with P-EN1s expressing P2X2. We subtracted the average E-PG signal at –0.3 to 0.0 s from the average at 0.7 to 1.0 s with respect to the time of the pressure pulse, highlighting the effect of the stimulation. We subtracted the average Alexa594 (ATP) signal at –0.3 to 0.0 s from the average immediately (1 frame) after stimulation. The irregular dips in the E-PG signal are due to the fact that the E-PG phase was not uniformly distributed immediately before stimulation. Both signals were phase-nulled using the position of the pipette. f, Same as e, but without ATP in the same flies. g, h, Same as e, f, but with P-EN2s expressing P2X2. i, j, Same as e, f but with no Gal4 as a control for the specificity of P2X2 expression. In ej, thin lines represent single flies, and thick lines represent the means across flies.
Figure 1 |
Figure 1 |. The activity of three cell types in the protocerebral bridge tracks the fly’s heading.
a, Protocerebral bridge and ellipsoid body in the fly brain. b, Example E-PG and P-EN neurons. Each cell type tiles the bridge and ellipsoid body. c, Imaging neural activity in a fly walking on a ball with an LED arena. df, Z-projected bridge volumes of GCaMP6m over time for each cell type. Scale bars, 20 μm. gi, Left, bridge activity as the fly walks with a bar in closed-loop; right, phase of the bridge activity and bar position. The 90° gap in the back of the arena is highlighted in grey. jl, Correlations between phase position and ball position and phase velocity and ball velocity. Each circle represents one fly. The mean and s.d. across flies are shown. P-ENs are in orange and E-PGs in blue throughout.
Figure 2 |
Figure 2 |. P-EN neurons in the left and right bridge are asymmetrically active when the fly turns, consistent with an anatomically inspired model for neural integration.
ad, How an asymmetry in left and right P-EN neurons could rotate the E-PG phase (see text). eg, Bridge activity and accumulated phase in constant darkness for each cell type. Arrows highlight right- left asymmetries when the fly turns. hj, Right-left bridge activity (bottom) triggered on the onset of left or right turns (top). The mean and s.e.m. across turns are shown. km, Right–left bridge activity versus turning velocity. Thin lines represent single flies. Thick lines represent the mean across flies. hm, Averaged over bar and dark conditions.
Figure 3 |
Figure 3 |. The P-EN1 activity peak leads, and the P-EN2 peak trails, a rotating E-PG peak in the ellipsoid body, as predicted by their activity in the bridge.
a, b, Co-imaging of E-PGs (GCaMP6f) with P-EN1s (jRGECOla) (a) or P-EN2s (jRGECOla) (b) in the bridge in constant darkness. c, d, Phase-nulled signals in the bridge, averaged over time. e, f, Bridge data from c, d replotted onto the ellipsoid body using each cell type’s anatomical projection pattern. g, h, Sum of the left- and right-bridge curves in e, f (scales adjusted). i, j, Co-imaging of E-PGs with P-EN1s or P-EN2s in the ellipsoid body. kp, Phase-nulled signals in the ellipsoid body averaged over time when the fly was walking straight (k, l), turning left (m, n) or turning right (o, p). Arrows indicate the velocity of the peaks. The P-EN ellipsoid body asymmetries were significantly different during turning and walking straight (P < 0.02), and during turning left and right (P < 0.01) (Wilcoxon rank-sum test). The mean and s.e.m. across flies are shown. ch, kp, Averaged over bar and dark conditions.
Figure 4 |
Figure 4 |. P-EN1 and P-EN2 bridge asymmetries respectively lead and lag phase shifts in time, and impairing P-ENs impairs E-PG phase updating in the dark.
a, b, Bridge activity during phase shifts in constant darkness for P-EN1 (a) and P-EN2 (b). White arrows highlight right–left asymmetries. c, Right–left bridge activity (bottom) triggered on phase changes (top). The mean and s.e.m. across phase shifts are shown. d, Correlation between right–left bridge activity and phase velocity versus time lag between the two signals. Thin lines represent single flies. Thick lines represent the mean across flies. c, d, Traces are averaged over bar and dark conditions. e, f, E-PG activity in the bridge with P-EN1 cells expressing shibirets at 22 °C (e) or 32 °C (f). Arrows highlight atypical deviations in the E-PG phase from the ball’s heading at 32 °C. g, E-PG phase velocity versus ball velocity in a control fly and a P-EN 1>shibirets fly (same as in e, f) in constant darkness. R, Pearson correlation coefficient. h, Phase vs. ball velocity correlations for three P-EN-Gal4 lines. Each circle represents one fly. The mean and s.e.m. across flies are shown. The cold-to-hot changes in correlation are significantly different between P-EN>shibirets and control groups (P < 0.01) (Wilcoxon rank-sum test). Note the different rotation scales in a, b and e, f.
Figure 5 |
Figure 5 |. P-EN neurons medially excite E-PG neurons in the bridge, consistent with a model of neural integration.
a, Stimulating P2X2-expressing P-ENs in the bridge with ATP is expected to excite E-PGs in the medial neighboring glomerulus. b, Left, ATP (Alexa594) signal in the bridge; right, E-PG bridge activity while stimulating P-EN1 neurons in the left bridge. c, Same as b, except for stimulating P-EN1s in the right bridge. d, e, Same as b, c but for stimulating P-EN2 neurons. Asterisks highlight events when the fly turned following stimulation in a direction that would tend to return the E-PG phase to its pre-stimulus position. f, g, Phasenulled E-PG activity and ATP (Alexa594) signal after P-EN1 (f) or P-EN2 (g) stimulation. Thin lines represent the mean response in each fly. Thick lines represent the mean across flies. h, Summary model. P-EN and E-PG interactions projected onto a single ring. Only ellipsoid body tiles are represented for clarity. i, Model proposed in ref. 15 for rat head direction cells.

References

    1. O’Keefe J & Nadel L The Hippocampus as a Cognitive Map (Clarendon, 1978).
    1. Tolman EC, Ritchie BF & Kalish D Studies in spatial learning: orientation and the short-cut. J. Exp. Psychol. Gen 36, 13–24 (1946). - PubMed
    1. Etienne AS & Jeffery KJ Path integration in mammals. Hippocampus 14, 180–192 (2004). - PubMed
    1. Mittelstaedt ML & Mittelstaedt H Homing by path integration in a mammal. Naturwissenschaften 67, 566–567 (1980).
    1. Collett TS & Collett M Path integration in insects. Curr. Opin. Neurobiol 10, 757–762 (2000). - PubMed

References for Methods

    1. Nern A, Pfeiffer BD & Rubin GM Optimized tools for multicolor stochastic labeling reveal diverse stereotyped cell arrangements in the fly visual system. Proc. Natl Acad. Sci. USA 112, E2967–E2976 (2015). - PMC - PubMed
    1. Schindelin J et al. Fiji: an open-source platform for biological-image analysis. Nat. Methods 9, 676–682 (2012). - PMC - PubMed
    1. Fisher NI & Lee AJ A correlation coefficient for circular data. Biometrika 70, 327–332 (1983).

Publication types

LinkOut - more resources