. 2017 Jun 1;546(7656):168-172.
doi: 10.1038/nature22359. Epub 2017 May 24.

CPS1 maintains pyrimidine pools and DNA synthesis in KRAS/LKB1-mutant lung cancer cells

Affiliations

CPS1 maintains pyrimidine pools and DNA synthesis in KRAS/LKB1-mutant lung cancer cells

Jiyeon Kim et al. Nature. .

Erratum in

Abstract

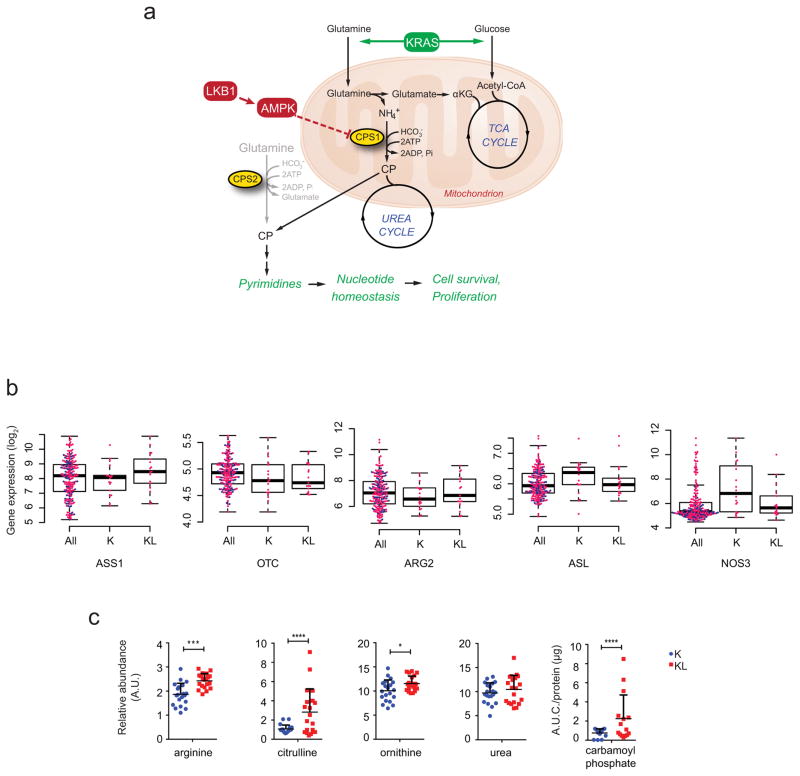
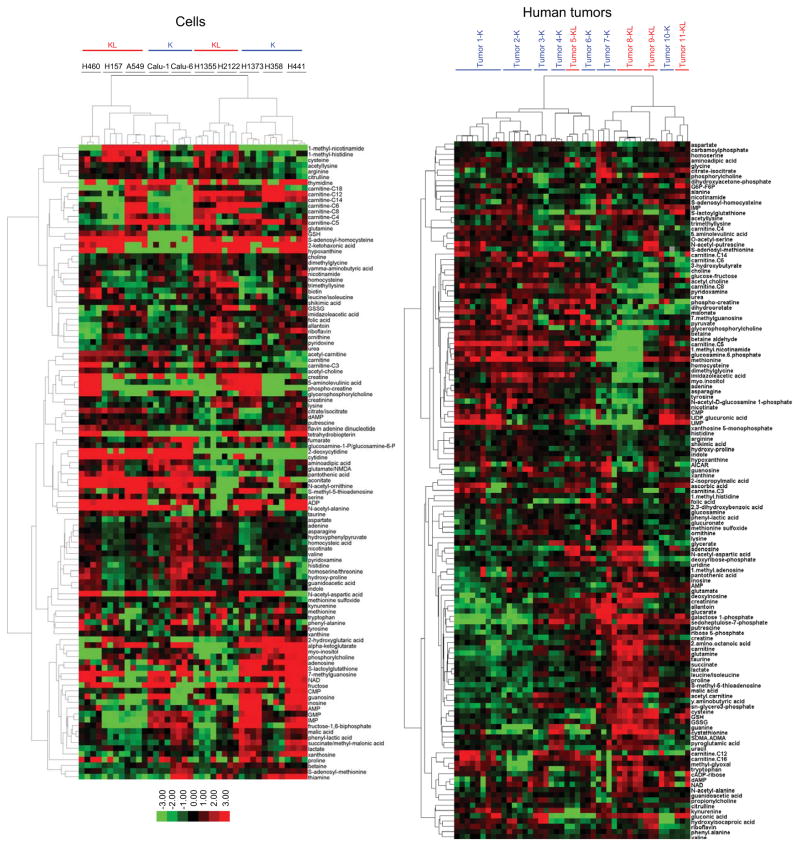
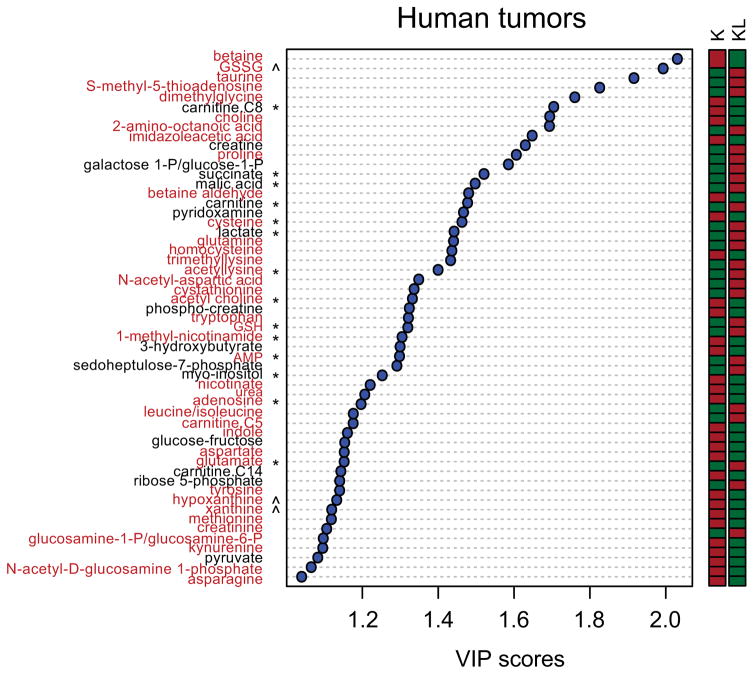
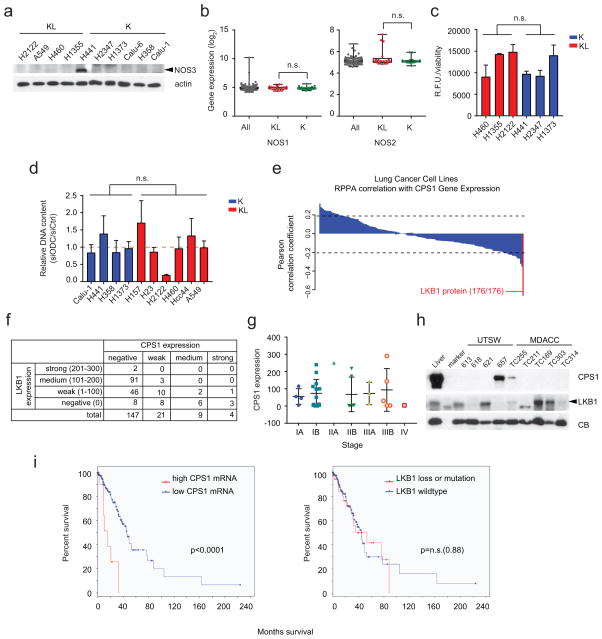
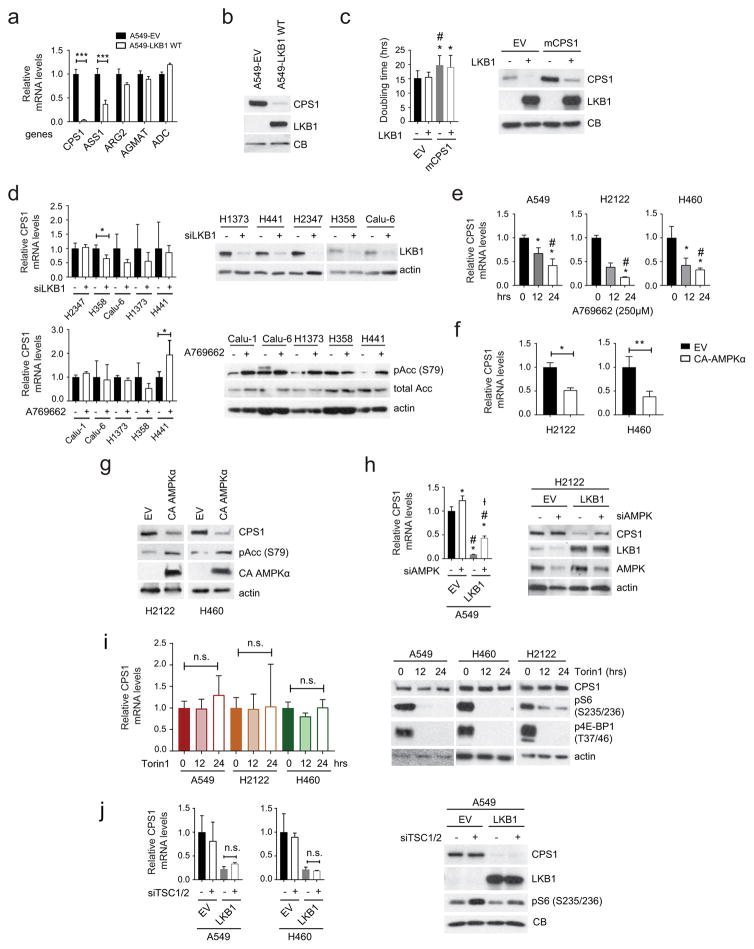
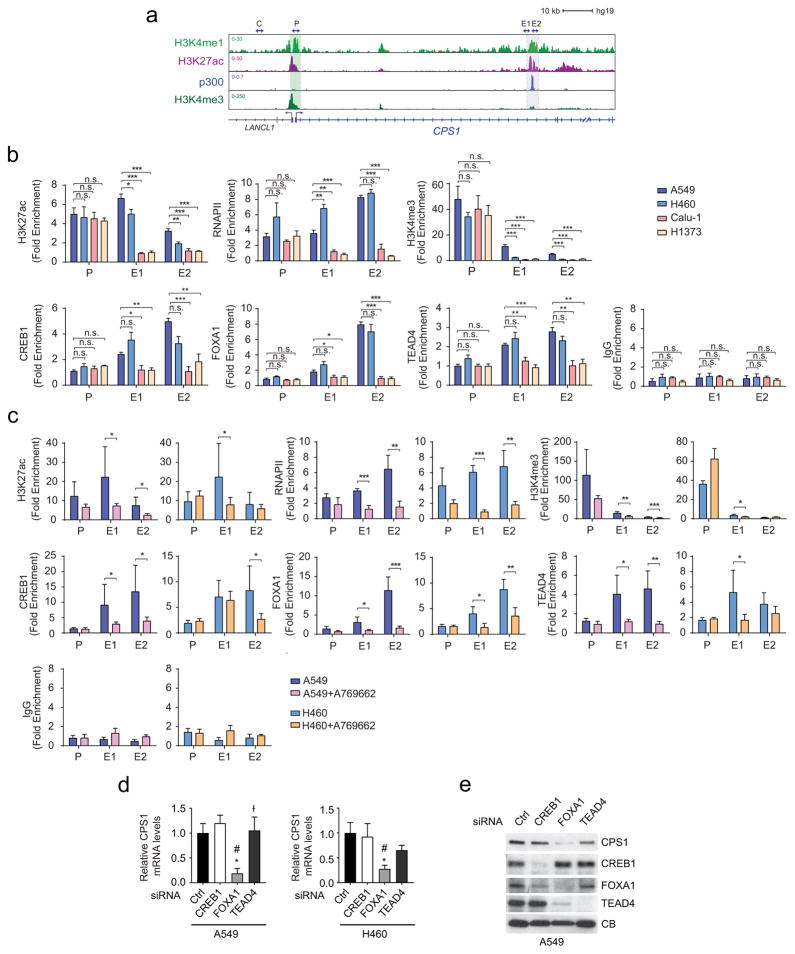
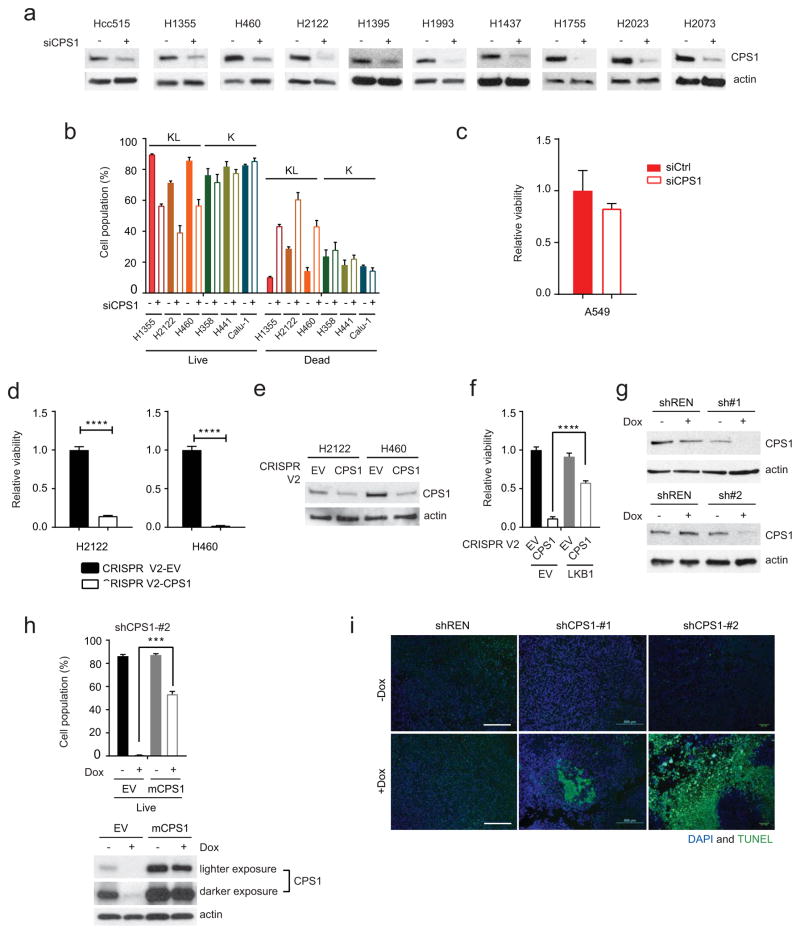
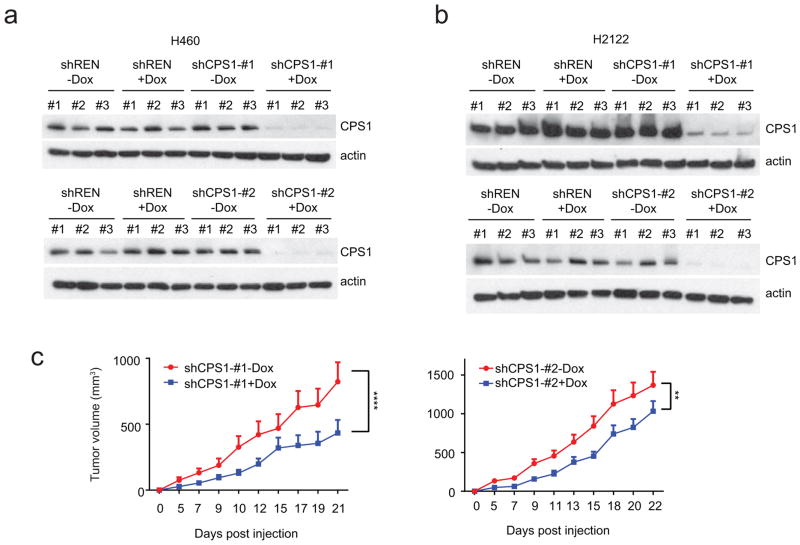
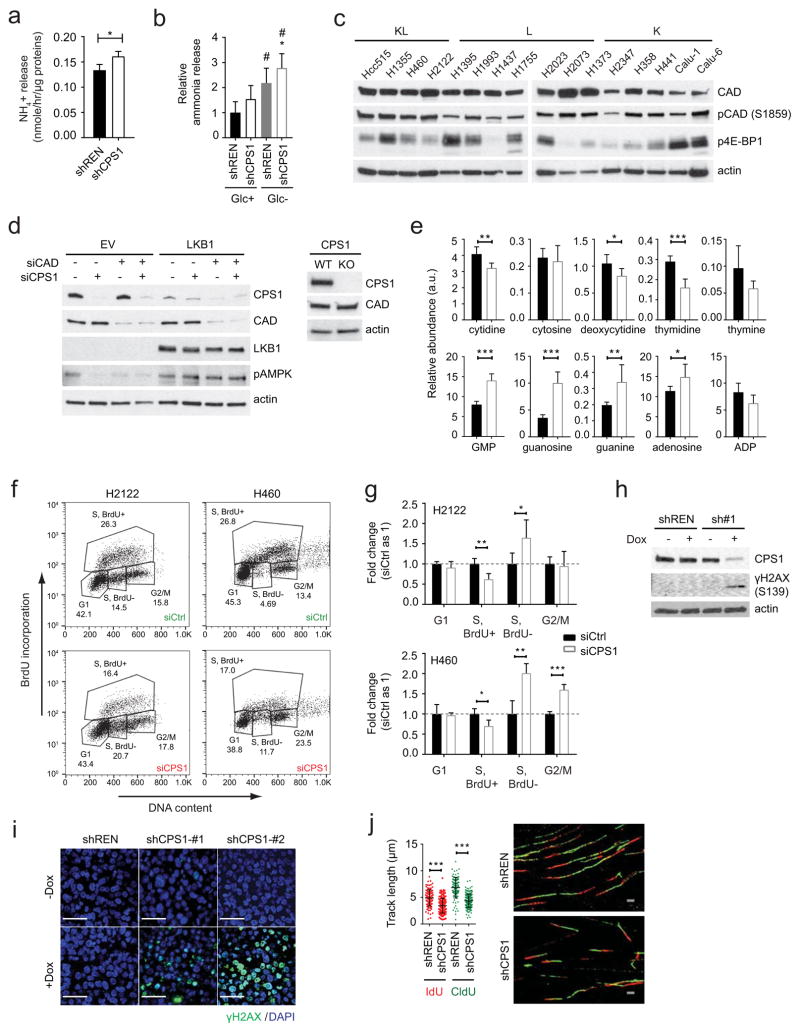
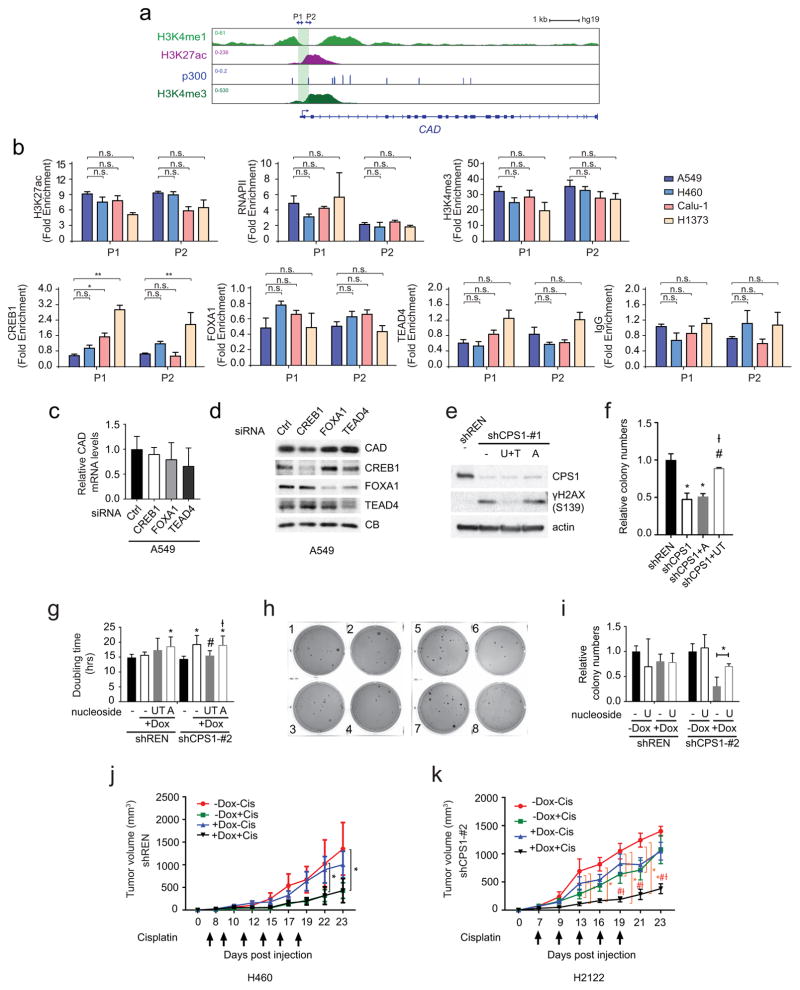
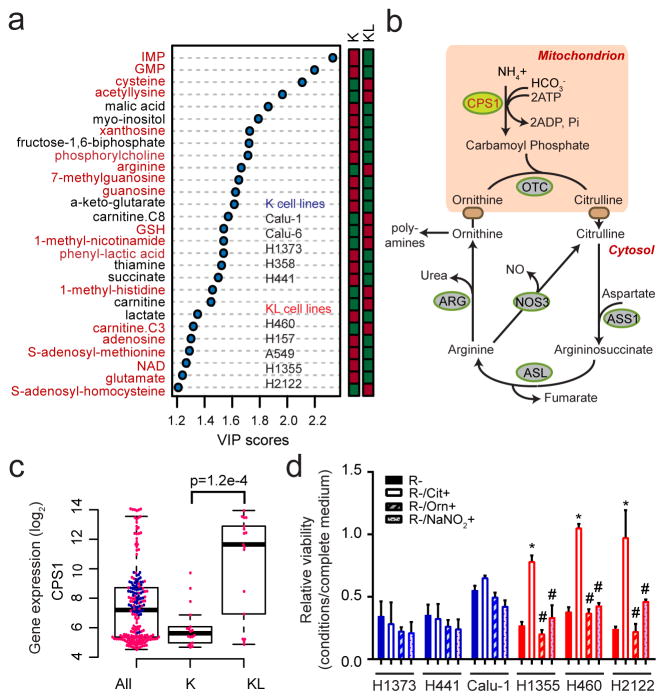
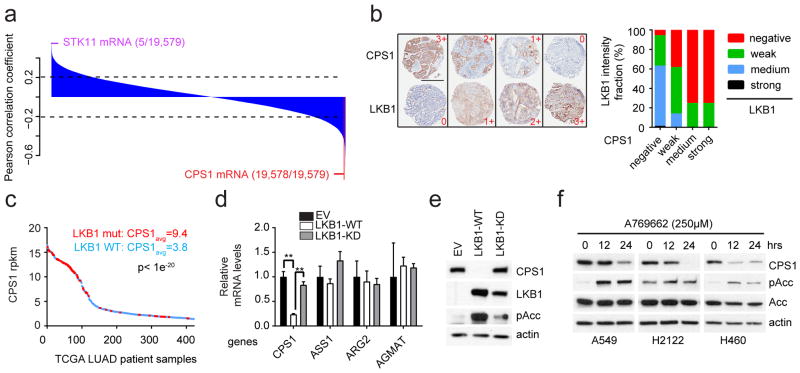
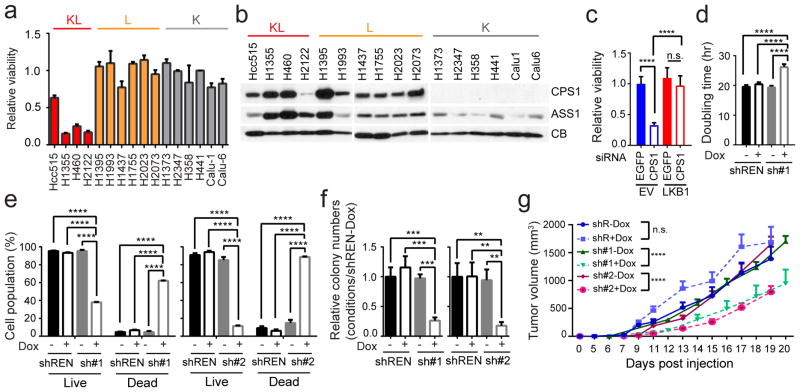
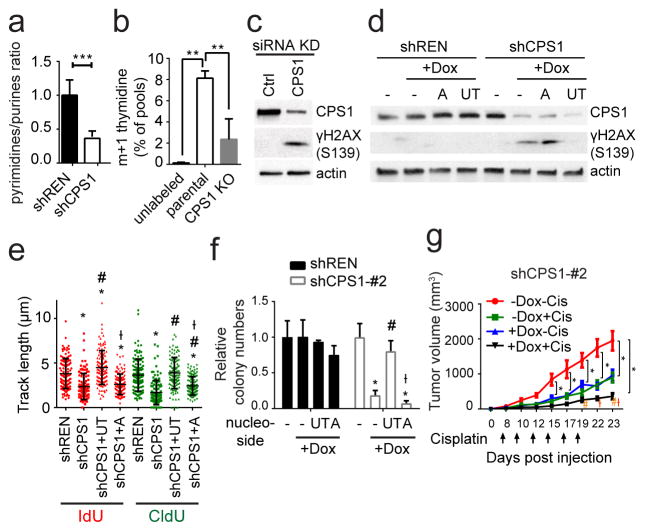
Metabolic reprogramming by oncogenic signals promotes cancer initiation and progression. The oncogene KRAS and tumour suppressor STK11, which encodes the kinase LKB1, regulate metabolism and are frequently mutated in non-small-cell lung cancer (NSCLC). Concurrent occurrence of oncogenic KRAS and loss of LKB1 (KL) in cells specifies aggressive oncological behaviour. Here we show that human KL cells and tumours share metabolomic signatures of perturbed nitrogen handling. KL cells express the urea cycle enzyme carbamoyl phosphate synthetase-1 (CPS1), which produces carbamoyl phosphate in the mitochondria from ammonia and bicarbonate, initiating nitrogen disposal. Transcription of CPS1 is suppressed by LKB1 through AMPK, and CPS1 expression correlates inversely with LKB1 in human NSCLC. Silencing CPS1 in KL cells induces cell death and reduces tumour growth. Notably, cell death results from pyrimidine depletion rather than ammonia toxicity, as CPS1 enables an unconventional pathway of nitrogen flow from ammonia into pyrimidines. CPS1 loss reduces the pyrimidine to purine ratio, compromises S-phase progression and induces DNA-polymerase stalling and DNA damage. Exogenous pyrimidines reverse DNA damage and rescue growth. The data indicate that the KL oncological genotype imposes a metabolic vulnerability related to a dependence on a cross-compartmental pathway of pyrimidine metabolism in an aggressive subset of NSCLC.


Figures

Extended Data Fig. 1
Extended Data Fig. 1. Altered urea cycle metabolism in KL cells
a, Illustration of the urea and TCA cycle. Metabolic alterations mediated by concurrent mutations of KRAS and LKB1 render cells dependent on CPS1 for pyrimidine synthesis. Generally, mitochondrial and cytosolic CP are thought to follow distinct metabolic routes in the urea cycle and pyrimidine biosynthesis, respectively. In KL cells, however, CPS1 supports nucleotide homeostasis by providing an alternative supply of CP for de novo pyrimidine synthesis. Dependence on CPS1 is exacerbated by mutant KRAS, perhaps because of the effects of this oncogene on the metabolism of glutamine and other nutrients in the mitochondria. b, Distribution of mRNA abundance of urea cycle-related enzymes in 203 cell lines. Statistical significance was assessed using two-tailed Student’s t-test. Abundance data are in Supplementary Information Table 6. c, Abundance of urea cycle intermediates in the same cell lines used in Fig. 1a. Individual data points are shown with mean values and SD for three (CP) or four (all others) independent cultures. Statistical significance for citrulline and carbamoyl phosphate was assessed using Wilcoxon signed rank test. Other data were assessed using two-tailed Student’s t-tests. *p<0.05; ***p<0.005; **** p<0.0001.
Extended Data Figure 2
Extended Data Figure 2. Metabolomic profiling of KL and K cancer cells and human NSCLC
Left, Relative abundance of metabolites extracted from five KL (H157, A549, H460, H2122, H1355) and five K cell lines (Calu-1, Calu-6, H1373, H358, H441). Peak areas of each metabolite were normalized by total ion count (TIC) and the heat map displays the average value for each metabolite; n=4 independent cultures for each cell line. The color reflects a log2 scale. Right, Relative abundance of metabolites extracted from four KL human tumors (Tumors 5, 8, 9 and 11-KL) and seven K human tumors (Tumors 1, 2, 3, 4, 6, 7 and 10-K). Peak areas of each metabolite were normalized by total ion count (TIC) followed by mean normalization and the heat map displays the average value for each metabolite; n=3 independent fragments for each tumor except Tumor 2-K (n=6), Tumor 8-KL (n=6) and Tumor 1-K (n=9). The color reflects a log2 scale.
Extended Data Fig. 3
Extended Data Fig. 3. Metabolites differentiating between KL and K human NSCLC
Metabolites differentiating K from KL human tumors have variable importance in the projection (VIP) scores >1.0. Metabolites related to nitrogen metabolism are highlighted in red. The relative abundance of each metabolite is shown in the color bar, where red indicates elevated and green indicates reduced abundance. * indicates metabolites that also discriminated between K and KL cell lines in Fig. 1a and Supplemental Data Table 2, and ^ indicates metabolites closely related to those discriminating between K and KL cell lines in Fig. 1a (e.g. hypoxanthine and xanthine in the tumors are related to xanthosine in the cell lines).
Extended Data Fig. 4
Extended Data Fig. 4. Nitrogen-related metabolic pathways in K and KL cells, and anticorrelation between CPS1 and LKB1
a, Abundance of NOS3 protein in a panel of K and KL cell lines. b, Distribution of mRNA abundance for NOS1 and NOS2 among 203 cell lines. Complete data sets including quantitative mRNA abundance of these genes are available in Supplementary Information Table 6. c, NOS activity in K and KL cells. Free nitric oxide (NO) was monitored in three cell lines of each genotype. Data are the average and SD of three independent cultures. d, Effect of silencing ornithine decarboxylase (ODC), an enzyme involved in polyamine synthesis from ornithine, in K and KL cells. Cell growth was measured by DNA content using a Perkin Elmer Victor X3 plate reader. Data are the average and SD of six independent cultures. e, Pearson correlation coefficients between CPS1 mRNA and 176 proteins in 94 lung cancer cell lines. Rank of LKB1 protein is indicated. Dashed lines demarcate correlation coefficients at nominal p=0.05. f, Scoring of LKB1 and CPS1 expression in TMA samples. In this analysis, tumors were considered positive if any CPS1 or LKB1 staining was detected (i.e. H-score greater than or equal to 1, as described in Methods); otherwise staining was considered negative. g, CPS1 protein expression in TMA tumor samples of different clinical stages. h, Abundance of CPS1 and LKB1 protein in patient-derived NSCLC xenografts (PDXes). All PDXes had oncogenic KRAS mutations. i, Kaplan-Meier plot associating CPS1 expression with reduced survival. In the TCGA lung adenocarcinoma cohort (TCGA LUAD provisional, n=230), LKB1 mutation or loss was observed in 19% of patient tumors (n=43). For CPS1, a z-score threshold of 2.0 was used to identify tumors with high levels of expression; this included 5.2% (n=12) tumors. There was no difference in overall survival in patients with LKB1 alterations (deletion or mutation) versus those without an LKB1 alteration (p=0.88). In contrast, patients whose tumors had high levels of CPS1 mRNA had much shorter periods of overall survival compared to other patients (15.2 vs. 45.3 months, p<0.0001). The western blot and NOS activity assay were performed twice, and ODC silencing experiment was repeated three times or more. Statistical significance was assessed using two-tailed Student’s t-test. n.s., not significant.
Extended Data Fig. 5
Extended Data Fig. 5. LKB1 suppresses CPS1 expression via AMPK
a, Expression of urea cycle and related enzymes in control A549 cells (empty vector, EV) and cells expressing wild-type (WT) LKB1. Data are the average and SD of three independent cultures. Statistical significance was assessed using two-tailed Student’s t-tests. ***p<0.005. b, Abundance of CPS1 and LKB1 protein in A549 cells transfected with an empty vector (EV) or wild type LKB1 (LKB1 WT). CB was used as a loading control. c, Left, Effect of expressing wild-type LKB1 or murine CPS1 (mCPS1), alone or together, on H460 cell proliferation. EV is empty vector control. Data are the average and SD of six or more independent cultures. Right, Abundance of CPS1 and LKB1 protein in H460 cells stably expressing empty vector (EV) or mCPS1. d, Top, Effects of LKB1 silencing on CPS1 mRNA expression in cells with oncogenic KRAS and wild-type LKB1 (K cells). Data are the average and SD of three or more independent cultures. Western blot shows the abundance of LKB1 protein in cells transfected with control siRNA or siRNA targeting LKB1 (siLKB1). Bottom, Effects of the AMPK activator A769662 on CPS1 mRNA expression in K cells. Data are the average and SD of three or more independent cultures. Western blot shows the abundance of total and phosphorylated Acetyl-CoA carboxylase (pAcc, S79) in cells treated with DMSO or A769662 (250μM). e, Effects of A769662-mediated AMPK activation on CPS1 mRNA expression in KL cells. Data are the average and SD of three or more independent cultures. f, Effects of constitutively active AMPK on CPS1 mRNA expression in H2122 and H460 cells. Data are the average and SD of three or more independent cultures. g, Abundance of CPS1, pAcc and constitutively active AMPKα in H2122 and H460 cells transfected with an empty vector (EV) or CA AMPKα. Actin was used as a loading control. h, Left, Effects of AMPK silencing on CPS1 mRNA expression in A549 cells without (EV) or expressing wild type LKB1. Data are the average and SD of three independent cultures. Right, Abundance of CPS1, LKB1, AMPK proteins in A549 cells transfected with control siRNA or siRNA targeting AMPK (siAMPK). Actin was used as a loading control. i, Left, Effects of the mTOR inhibitor Torin 1 on CPS1 mRNA expression in KL cells. Data are the average and SD of four or more independent cultures. Right, Abundance of CPS1, phosphorylated S6-ribosomal protein (pS6) and phosphorylated 4E-BP1 (p4E-BP1) in KL cells. Actin was used as a loading control. j, Left, Effects of TSC1 and 2 silencing on CPS1 mRNA expression in A549 and H460 cells. Data are the average and SD of three independent cultures. Right, Abundance of CPS1, LKB1, and phospho-S6 in A549 cells. CB was used as a loading control. In a,d,f,j, statistical significance was assessed using two-tailed Student’s t-tests. n.s. not significant, *p<0.05, **p<0.01, ***p<0.005. In c,e,h,i, statistical significance was assessed using one-way ANOVA followed by Tukey’s multiple comparisons test. Panel c:*, p<0.05 comparing to EV-EV;#, p<0.05 comparing to EV-LKB1. Panel e:*, p<0.05 comparing to no treatment;#, p<0.05 comparing to 12 hr A769662 treatment. Panel h;*, p<0.05 comparing to EV-control siRNA;#, p<0.05 comparing to EV-siAMPK;Ɨ, p<0.05 comparing to LKB1-control siRNA. All experiments were repeated three times or more.
Extended Data Fig. 6
Extended Data Fig. 6. LKB1 regulates CPS1 transcription via AMPK-mediated effects
a, Chromatin signatures at the CPS1 locus in A549 cells. Promoter and enhancer sequences are shaded. Arrowheads indicate amplicons for control (C), promoter (P) and enhancer (E1, E2) regions for ChIP-qPCR in b and c. b, Chromatin occupancy of H3K27ac, RNAPII, H3K4me3, CREB1, FOXA1, TEAD4 and IgG (negative control) in KL (A459, H460) and in K (Calu-1, H1373) cells. Data are the average and SD of two independent cultures, each with two technical replicates (total n=4). c, Chromatin occupancy of H3K27ac, RNAPII, H3K4me3, CREB1, FOXA1, TEAD4 and IgG in A549 and H460 cells treated with DMSO or 250μM A769662. Data are the average and SD of three independent cultures, each with two technical replicates (total n=6). d, Effects of CREB1, FOXA1, and TEAD4 silencing on CPS1 mRNA expression in A549 and H460 cells. Data are the average and SD of three or more replicates. e, Abundance of CPS1, CREB1, FOXA1, and TEAD4 in A549 cells. CB was used as a loading control. In b and c, statistical significance was assessed using two-tailed Student’s t-test. *p < 0.05, **p < 0.01, ***p< 0.001, n.s. not significant. In d, statistical significance was assessed using one-way ANOVA followed by Tukey’s multiple comparisons test. *, p<0.05 comparing to control siRNA; #, p<0.05 comparing to siCREB1; Ɨ, p<0.05 comparing to siFOXA1. ChIP-qPCR in b was performed twice. All other experiments were repeated three times or more.
Extended Data Fig. 7
Extended Data Fig. 7. CPS1 addiction in a subset of NSCLC cell lines
a, Abundance of CPS1 protein in cell lines transfected with a control esiRNA or esiRNA directed against CPS1. b, Effect of CPS1 silencing on cell death in K and KL cells. Data are the average and SD of three independent cultures. c, Effect of CPS1 silencing on A549 cell viability. Data are the average and SD of six independent cultures. d, Effect of lentiCRISPR/Cas9-mediated knockout of CPS1 on viability in H2122 and H460 cells. Cell TiterGlo assays were performed on pools of CPS1 KO cells without first isolating clones. Data are the average and SD of six independent cultures. e, Abundance of CPS1 protein in H2122 and H460 control cells (EV) and a pool of cells infected with lentiviral CRISPR V2-CPS1 (CPS1). Actin was used as a loading control. f, Effect of knocking out CPS1 on H460-EV and H460-LKB1-WT cells (n=6). g, Abundance of CPS1 in H460 cells expressing shCPS1-#1 (top) and shCPS1-#2 (bottom) with or without Dox induction. shREN is a Dox-inducible control shRNA, and actin was used as a loading control. h, Top, Effects of murine CPS1 (mCPS1) expression on viability in H460 cells expressing shCPS1-#2. Data are the average and SD of three independent cultures. Bottom, Abundance of CPS1 protein in H460 cells expressing mCPS1 with or without shCPS1 induction. Actin was used as a loading control. i, TUNEL staining of tumor tissues. 4’,6-diamidino-2-phenylindole (DAPI) was used to stain DNA. Scale bar, 500 μm. In d, statistical significance was assessed using two-tailed Student’s t-test. ****p<0.0001. In f and h, statistical significance was assessed using one-way ANOVA followed by Tukey’s multiple comparisons test. ***p< 0.001. Tissue TUNEL staining was performed once. Viability assay (f) was performed twice. All other experiments were repeated three times or more.
Extended Data Fig. 8
Extended Data Fig. 8. CPS1 expression and xenograft growth
a and b, Abundance of CPS1 protein in H460 (a) and H2122 (b) xenografts expressing shCPS1-#1 (top) and shCPS1-#2 (bottom) with or without Dox induction. shREN is a Dox-inducible control shRNA, and actin is a loading control. c, Effect of Dox-induction of shCPS1-#1 (left) and shCPS1-#2 (right) on H2122 xenograft growth. Nude mice were injected subcutaneously with H2122 shCPS1 (#1, #2) cells, and Dox (200 mg/kg) was introduced 1 day later. Each group (n=8) is presented as mean tumor volume and SEM. Statistical significance was assessed using two-way ANOVA. **p < 0.01, ****p<0.0001. Experiments were performed once (n=8 mice).
Extended Data Fig. 9
Extended Data Fig. 9. CPS1 silencing results in pyrimidine depletion and DNA damage
a, Ammonia release from H460 cells expressing shREN or shCPS1-#1 (n=3). b, Ammonia release from H460 cells expressing shREN or shCPS1-#2 in the presence and absence of glucose. Glucose deprivation provides a positive control for enhanced ammonia release in cancer cells (see “Metabolic Assays” In Methods section). Data are the average and SD of three independent cultures, each with three technical replicates (total n=9). c, Abundance of total CAD, phosphorylated CAD (pCAD) and phosphorylated 4E-BP1 (4E-BP1) in K, L, and KL cells. Actin was used as a loading control. d, Left, CPS1, CAD, LKB1 and phosphorylated AMPK (pAMPK) abundance in H460 cells without (EV) or with LKB1 expression. Cells were transfected with siRNA targeting CAD or CPS1. Actin was used as a loading control. Right, Abundance of CPS1 and CAD protein in WT or CPS1-knockout H460 cells. Actin was used as a loading control. e, Relative abundance of pyrimidines and purines during expression of shREN (closed bars) or shCPS1#1 (open bars) (n=6). f, Effects of CPS1 silencing on bromodeoxyuridine (BrdU) incorporation (n≥3). DNA content and BrdU incorporation were assessed by flow cytometry following dual staining with BrdU and PI. g, Effect of CPS1 silencing on cell cycle distribution (n=4). h, Abundance of CPS1 protein and γH2AX in H460-shREN and -shCPS1#1 cells with or without Dox induction. i, γH2AX in H460 xenografts. DAPI was used to stain DNA. Scale bar, 40 μm. j, Effects of CPS1 silencing on DNA track length measured by iododeoxyuridine (IdU) and chlorodeoxyuridine (CldU) incorporation. At least 104 tracks were measured for each condition. Scale bar 2 μm. In b, statistical significance was assessed using one-way ANOVA followed by Tukey’s multiple comparisons test. *, p<0.05 comparing to shREN+Glc; #, p<0.05 comparing to shCPS1+Glc. In a, e, g and j, statistical significance was assessed using two-tailed Student’s t-test. *p < 0.05, **p < 0.01, ***p< 0.001. Tissue staining was performed once. Nucleotide measurements and DNA fiber assays were performed twice. All other experiments were repeated three times or more.
Extended Data Fig. 10
Extended Data Fig. 10. Regulation of CAD transcription is distinct from that of CPS1, and pyrimidine nucleosides rescue DNA damage and proliferation of CPS1 silenced cells
a, Chromatin signatures at the CAD locus in A549 cells. Promoter sequences are shaded. Arrowheads indicate amplicons for promoter (P1, P2) regions for ChIP-qPCR in b. b, Chromatin occupancy of H3K27ac, RNAPII, FOXA1, H3K4me3, CREB1, TEAD4 and IgG (negative control) in KL (A459, H460) and in K (Calu-1, H1373) cells. Data are the average and SD of two independent cultures, each with two technical replicates (total n=4). c, Effects of CREB1, FOXA1 and TEAD4 silencing on CAD mRNA expression in A549 cells. Data are the average and SD of three independent cultures, each with two technical replicates (total n=6). d, Effects of CREB1, FOXA1 and TEAD4 silencing on CAD protein abundance in A549 cells. CB was used as a loading control. e, Effect of supplementing culture medium with uridine and thymidine (UT) or adenosine (A) (100 μM final concentration) on γH2AX abundance in Dox-induced H460 cells expressing shREN or shCPS1-#1. f, Effect of supplementing culture medium with UT or A on anchorage independent colony formation of H460 cells expressing shCPS1-#1 (n=3). Time point is 20 days after Dox induction. g, Effects of nucleoside supplementation on proliferation of H460 cells expressing shCPS1-#2. Data are the average and SD of three independent cultures, each with three technical replicates (total n=9). h, Colonies from Fig. 4f. 1–4: shREN, 5–8: shCPS1-#2, 1,5: no treatment, 2,6: Dox treatment, 3,7: Dox+ UT, 4,8: Dox+A. i, Effect of supplementing with uridine alone on anchorage independent colony formation of H460 cells expressing shCPS1-#2. Data are the average and SD of three independent cultures. j, Growth of subcutaneous H460 shREN-derived xenografts in presence and absence of Dox, with or without cisplatin. Mean tumor volume and SEM are shown for each group (n=4) k, Growth of subcutaneous H2122-derived xenografts in nude mice in the presence and absence of Dox (200 mg/kg) introduced 1 day after implantation with or without cisplatin treatment (IP injection at 2mg/kg for 5–6 doses). Mean tumor volume and SEM are shown for each group (n=4). In b and i, statistical significance was assessed using two-tailed Student’s t-test. *p<0.05, **p < 0.01, n.s. not significant. In f and g, statistical significance was assessed using one-way ANOVA followed by Tukey’s multiple comparisons test. In j and k, statistical significance was assessed using two-way ANOVA followed by Tukey’s multiple comparisons test. Panel f: *, p<0.05 comparing to shREN; #, p<0.05 comparing to shCPS1; Ɨ, p<0.05 comparing to shCPS1+A. Panel g; first four bars: *, p<0.05 comparing to shREN without Dox. second four bars: *, p<0.05 comparing to shCPS1 without Dox; #, p<0.05 comparing to shCPS1 with Dox; Ɨ, p<0.05 comparing to shCPS1 with Dox+UT. Panel j and k: *, p<0.05 comparing to -Dox-Cis; #, p<0.05 comparing to -Dox+Cis; Ɨ, p<0.05 comparing to +Dox-Cis. Xenograft experiments were performed once, ChIP-qPCR was performed twice and all other experiments were performed three times or more.
Figure 1
Figure 1. Altered urea cycle metabolism in KL cells
a, Metabolites differentiating between five K and five KL cell lines (VIP>1.0, metabolites with VIP>1.2 are shown). Metabolites from nitrogen-related pathways are in red. Relative metabolite abundance is indicated in the bar, with red representing metabolite accumulation. b, Schematic of the urea cycle. c, Distribution of CPS1 mRNA abundance in 203 cell lines. d, Sensitivity to arginine deprivation with or without metabolite supplementation. R: arginine, Cit: citrulline, Orn: ornithine, NaNO2: sodium nitrite. Data are the average and SD of three independent cultures. Statistical significance was assessed using two-tailed Student’s t-test (c); one-way ANOVA with Tukey’s multiple comparisons (d). In panel d, *, p<0.05 comparing to R-; #, p<0.05 comparing to R-/Cit+. Metabolomics was performed once, and viability was measured twice.
Figure 2
Figure 2. LKB1 negatively regulates CPS1 transcription
a, Pearson correlations between LKB1 protein and 19,579 transcripts in 94 cell lines. Dashed lines demarcate p=0.05. b, Left, Representative TMA staining for CPS1 and LKB1, indicating negative (0), weak (1+), medium (2+) and strong (3+) staining. Scale bar, 600 μm. Right, LKB1 expression in each CPS1 expression group (total n=180). c, CPS1 mRNA abundance in human lung adenocarcinoma (n=483). LKB1-mutants are red. d, Urea cycle-related enzyme expression in control H460 cells (empty vector, EV, n=3) and cells expressing wildtype (WT, n=3) or kinase-dead (KD, K78I-mutant, n=3) LKB1. e, CPS1, LKB1 and phosphorylated Acetyl-CoA carboxylase (pAcc, S79) abundance upon LKB1 re-expression. f, CPS1, total and phospho-Acc in A549, H2122 and H460 cells treated with the AMPK activator A769662. Statistical significance was assessed using two-tailed Student’s t-test (c); one-way ANOVA followed by Tukey’s multiple comparisons test (d). **p<0.01. TMA was performed once and all other experiments were repeated three times or more.
Figure 3
Figure 3. KL cells and tumors require CPS1
a, Effect of CPS1 silencing on KL, L and K cells (H1373 (n=4); H1437, H1755, H2023, H2073, H358 (n=6); other cell lines (n=3)). b, Abundance of CPS1 and another urea cycle enzyme, ASS1 in cells from Fig. 3a. CB, cyclophilin B (loading control). c, Effect of silencing CPS1 on H460-EV and H460-LKB1-WT cells (n=11). d, Effects of a doxycycline (Dox)-induced CPS1 shRNA (sh#1) on cell proliferation (n=3). shREN is a Dox-inducible control shRNA. e, Live and dead cell percentages 8 days after induction of CPS1-targeting (sh#1, sh#2) or control (shREN) shRNAs (n=3). f, Growth of anchorage-independent colonies 22 days after Dox induction (n=3). g, Growth of subcutaneous H460-derived xenografts in nude mice in presence and absence of Dox (200 mg/kg) introduced 1 day after implantation. Mean tumor volume and SEM are shown for each group (n=10 tumors except for shCPS#2-Dox, where n=8). Data in a, c-f are the average and SD of three or more independent cultures. In c-f, statistical significance was assessed using one-way ANOVA followed by Tukey’s multiple comparisons test. In g, to calculate significance on repeated measurements over time, two-way ANOVA was used. The mouse xenograft experiment was performed twice for shCPS1-#1 (n=5/experiment, total n=10) and once for shCPS1-#2 and shREN (n=10). All other experiments were repeated three times or more. **p<0.01; ***p<0.005; **** p<0.0001.
Figure 4
Figure 4. CPS1 silencing results in pyrimidine depletion, replication fork stalling and DNA damage
a, Pyrimidine:purine ratio from data in Extended Data Fig. 9e. b, 15N labeling in thymidine in control or CPS1-deficient (CRISPR/Cas9 KO) H460 cells cultured with 15NH4Cl (n=3). c, Abundance of CPS1 and phosphorylated histone H2AX (γH2AX) in H460 cells transfected with control or CPS1-targeting siRNA. d, Effect of supplementing uridine and thymidine (UT) or adenosine (A) on γH2AX abundance in CPS1-silenced H460 cells. e, Effect of UT or A supplementation on DNA fiber lengths in CPS1-silenced cells. At least 112 tracks were measured for each condition. f, Effect of UT or A supplementation on anchorage-independent growth (n=3). g, Growth of H460 shCPS1#2 xenografts in presence and absence of Dox with or without cisplatin. Mean tumor volume and SEM are shown for each group (n=8). For experiments in cell lines, data are average and SD of three independent cultures. Significance was assessed using two-tailed Student’s t-tests (a); one-way ANOVA with Tukey’s multiple comparisons (b,e,f); two-way ANOVA with Tukey’s multiple comparisons test (g). Panel e: *, p<0.05 comparing to shREN; #, p<0.05 comparing to shCPS1; Ɨ, p<0.05 comparing to shCPS1+UT. Panel f: *, p<0.05 comparing to no treatment; #, p<0.05 comparing to +Dox with no nucleoside supplementation, Ɨ; p<0.05 comparing to Dox+UT. Panel g: *, p<0.05 comparing to -Dox-Cis; #, p<0.05 comparing to -Dox+Cis; Ɨ, p<0.05 comparing to +Dox-Cis. All other panels:**p<0.01; ***p<0.005. Nucleotide measurements and DNA fiber assays were performed twice. All other experiments were repeated three times or more.

References

    1. Calles A, et al. Immunohistochemical Loss of LKB1 Is a Biomarker for More Aggressive Biology in KRAS-Mutant Lung Adenocarcinoma. Clinical cancer research : an official journal of the American Association for Cancer Research. 2015;21:2851–2860. doi: 10.1158/1078-0432.ccr-14-3112. - DOI - PubMed
    1. Ji H, et al. LKB1 modulates lung cancer differentiation and metastasis. Nature. 2007;448:807–810. doi: 10.1038/nature06030. - DOI - PubMed
    1. Liu Y, et al. Metabolic and functional genomic studies identify deoxythymidylate kinase as a target in LKB1-mutant lung cancer. Cancer discovery. 2013;3:870–879. doi: 10.1158/2159-8290.cd-13-0015. - DOI - PMC - PubMed
    1. Kim HS, et al. Systematic identification of molecular subtype-selective vulnerabilities in non-small-cell lung cancer. Cell. 2013;155:552–566. doi: 10.1016/j.cell.2013.09.041. - DOI - PMC - PubMed
    1. Liu H, Dong H, Robertson K, Liu C. DNA methylation suppresses expression of the urea cycle enzyme carbamoyl phosphate synthetase 1 (CPS1) in human hepatocellular carcinoma. The American journal of pathology. 2011;178:652–661. doi: 10.1016/j.ajpath.2010.10.023. - DOI - PMC - PubMed

Publication types

MeSH terms