. 2017 Jun 1;546(7656):158-161.
doi: 10.1038/nature22352. Epub 2017 May 24.

Lymphatic endothelial S1P promotes mitochondrial function and survival in naive T cells

Affiliations

Lymphatic endothelial S1P promotes mitochondrial function and survival in naive T cells

Alejandra Mendoza et al. Nature. .

Abstract

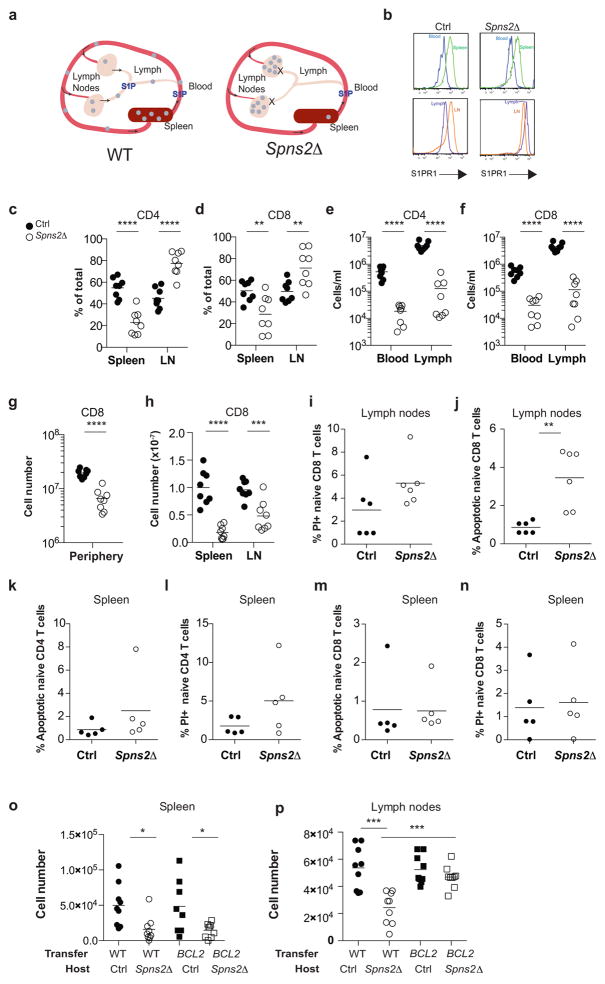
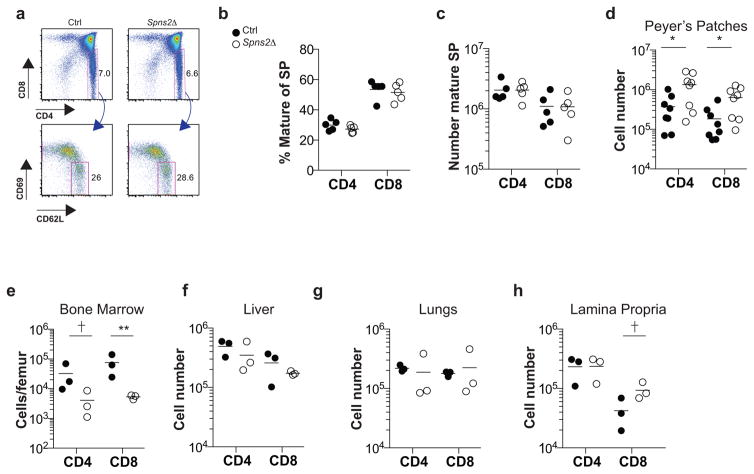
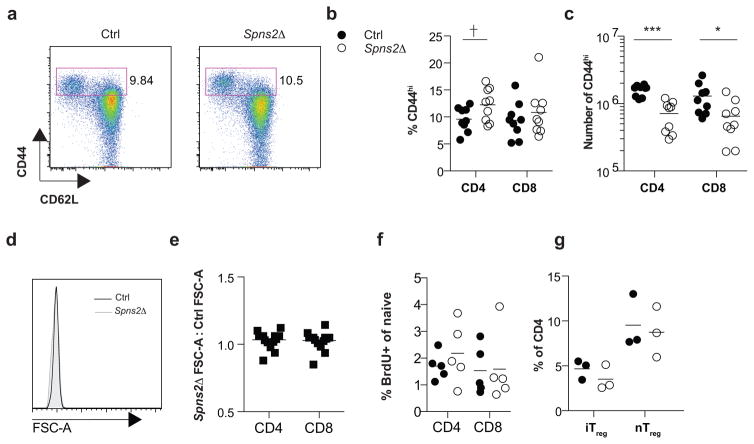
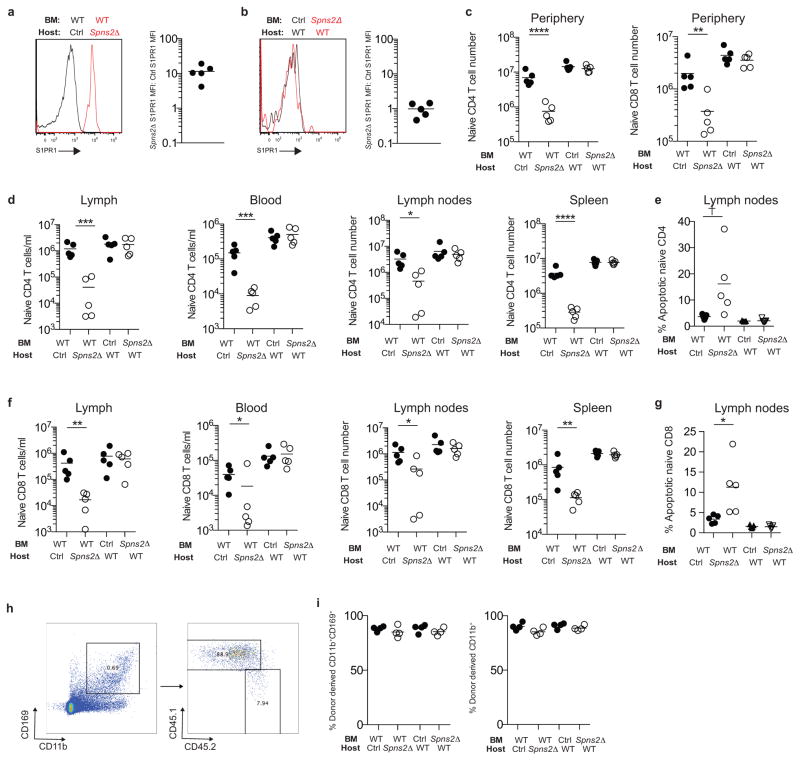
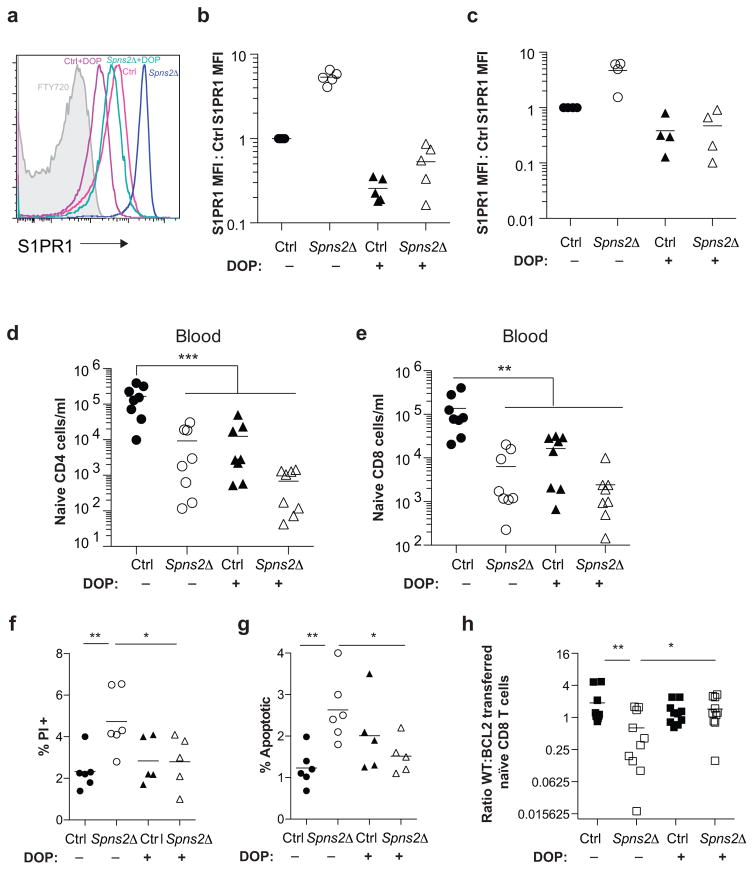
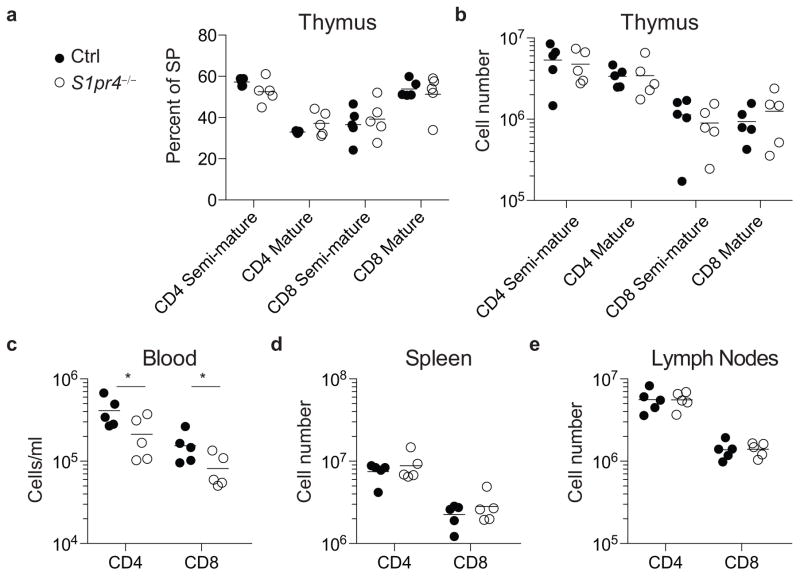
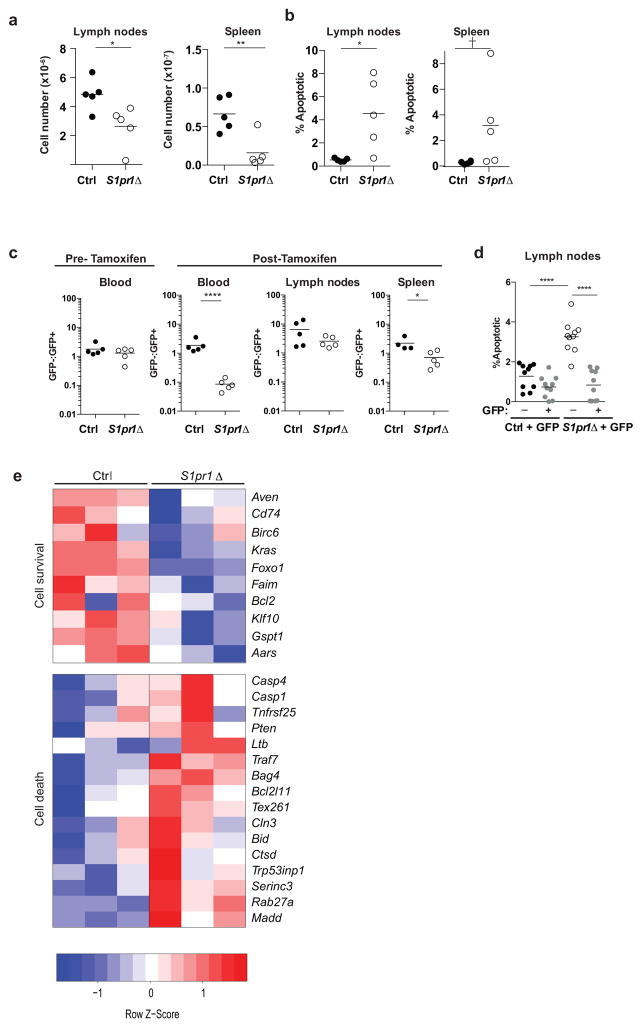
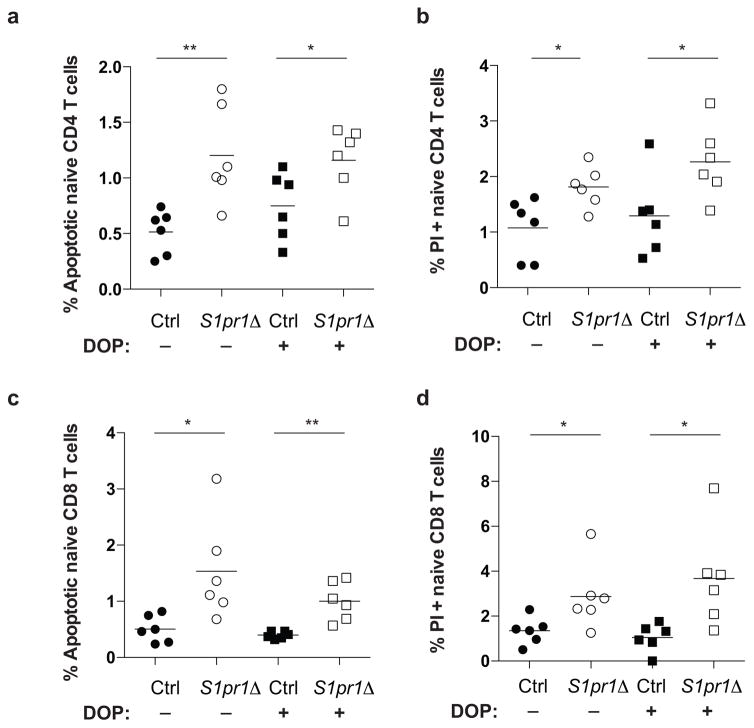
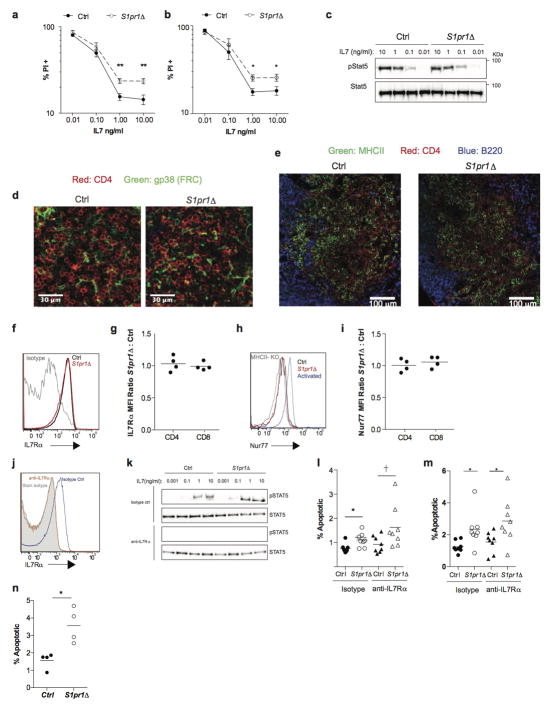
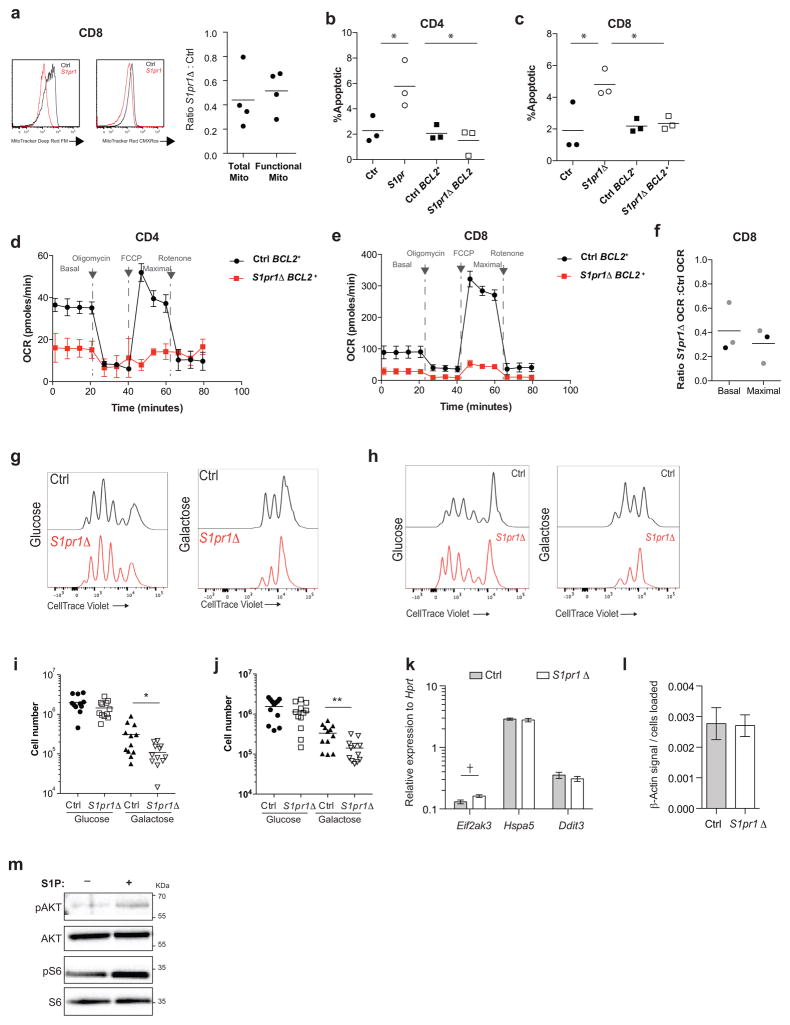
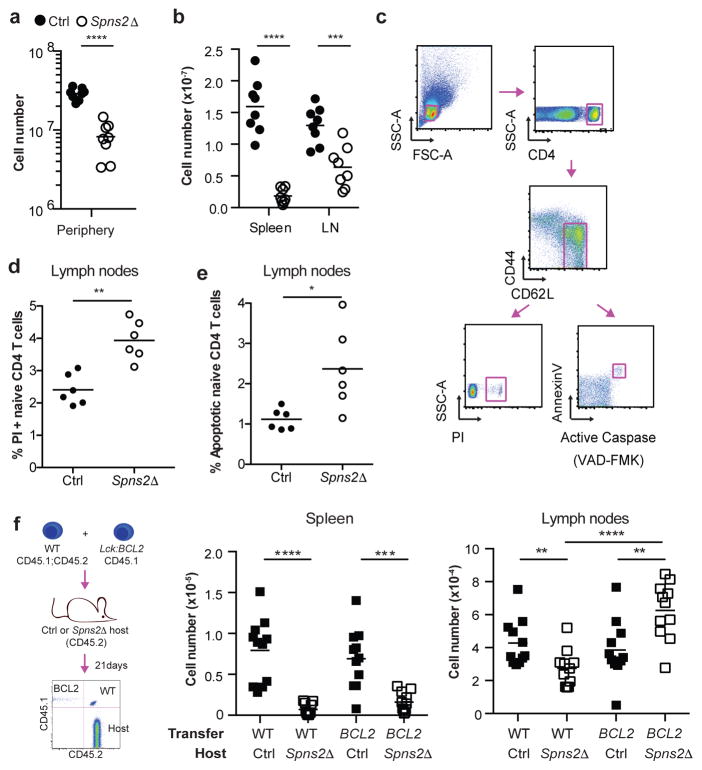
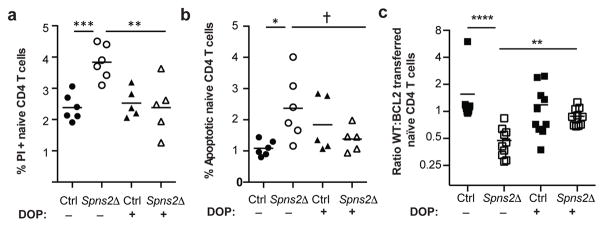
Effective adaptive immune responses require a large repertoire of naive T cells that migrate throughout the body, rapidly identifying almost any foreign peptide. Because the production of T cells declines with age, naive T cells must be long-lived. However, it remains unclear how naive T cells survive for years while constantly travelling. The chemoattractant sphingosine 1-phosphate (S1P) guides T cell circulation among secondary lymphoid organs, including spleen, lymph nodes and Peyer's patches, where T cells search for antigens. The concentration of S1P is higher in circulatory fluids than in lymphoid organs, and the S1P1 receptor (S1P1R) directs the exit of T cells from the spleen into blood, and from lymph nodes and Peyer's patches into lymph. Here we show that S1P is essential not only for the circulation of naive T cells, but also for their survival. Using transgenic mouse models, we demonstrate that lymphatic endothelial cells support the survival of T cells by secreting S1P via the transporter SPNS2, that this S1P signals through S1P1R on T cells, and that the requirement for S1P1R is independent of the established role of the receptor in guiding exit from lymph nodes. S1P signalling maintains the mitochondrial content of naive T cells, providing cells with the energy to continue their constant migration. The S1P signalling pathway is being targeted therapeutically to inhibit autoreactive T cell trafficking, and these findings suggest that it may be possible simultaneously to target autoreactive or malignant cell survival.


Conflict of interest statement

Competing Financial Interests

The authors declare no competing financial interests.

Figures

Extended Data Figure 1
Extended Data Figure 1. SPNS2 is required in lymphatic endothelial cells for peripheral T cell circulation
(a) Diagram of distribution of naïve T cells in the periphery of Spns2Δ mice and controls. Spns2Δ mice have normal plasma S1P and egress from the spleen into blood proceeds as usual, but in Spns2Δ mice lymph S1P is lost and egress from lymph nodes is blocked. Over time, this leads to a redistribution of T cells from spleen to lymph nodes and a loss of circulating cells, because any cell that leaves the spleen and enters a lymph node is trapped. (b) Representative surface S1PR1 on naïve CD4+ T cells in the blood and spleen (top panels) and in the lymph and LN (bottom panels) of a Spns2Δ mouse and its littermate control (Ctrl). Surface S1PR1 on T cells is internalized upon binding S1P. Hence the lower S1PR1 on the surface of T cells in blood than spleen, in both Spns2Δ and control animals, indicates that T cells sense more S1P in blood than spleen. S1PR1 is also lower on the surface of T cells in lymph than LN of control mice. But in Spns2Δ mice S1PR1 is equally high on T cells in lymph and LN, suggesting that the gradient that directs T cell exit from LN has been ablated. (c–h) T cell distribution in Spns2Δ mice and littermate controls. (c–d) Percent of total peripheral naïve CD4 (c) and CD8 (d) T cells in the spleen and LN. Total peripheral lymphocytes are defined as those in spleen and a subset of LN (brachial, axillary, inguinal, and mesenteric); blood and lymph make a negligible contribution. (e–f) Number of naïve CD4 (e) and CD8 (f) T cells in blood and lymph. (g) Total number of naïve CD8 T cells in the periphery. (h) Naïve CD8 T cell numbers in the spleen and LN. Data in (b–h) are representative of or pool 8 pairs of mice analyzed in 8 experiments. (i–j) Frequency of PI+ (i) and apoptotic (j) naïve CD8 T cells in LN of Spns2Δ mice and littermate controls. 6 pairs of mice analyzed in 6 experiments. (k–n) Frequency of apoptotic (k,m) and PI+ (l,n) naïve CD4 T cells (k,l) and CD8 T cells (m,n) in spleen of Spns2Δ mice and littermate controls. 5 pairs of mice analyzed in 5 experiments. There is no statistically significant difference in death of naïve CD4 or CD8 T cells in the spleen of Spns2Δ mice compared to littermate controls, although there seems to be a trend towards increased death in Spns2Δ mice. Normal T cell survival in the spleen of Spns2Δ mice is consistent with normal blood S1P and normal S1P production by blood vessel endothelial cells lining the marginal sinus, which likely maintain normal S1PR1 signaling in T cells in the spleen. We hypothesize that the few T cells able to leave the LN of Spns2Δ mice are relatively healthy, and stabilized while they are in the spleen. However, we hesitate to over-interpret these results because very few T cells remain in the spleen of Spns2Δ animals, and they may be different in a way that is not captured by gating on CD62LhiCD44lo T cells. (o–p) Congenically labeled lymphocytes from BCL2-Tg and WT littermate donors were co-transferred (1:1 by naïve CD4 counts) to Spns2Δ mice and littermate controls. Number of WT or BCL2-Tg naïve CD8 T cells recovered in spleen and LN 21 days after transfer. 9 pairs of mice analyzed in 3 experiments. Lines indicate mean. Unpaired 2-tailed t-test, *p<0.05, **p<0.01, ***p<0.001 ****p<0.0001.
Extended Data Figure 2
Extended Data Figure 2. Spns2 deletion in lymphatic endothelial cells does not block thymic egress, and does not induce substantial accumulation of naïve T cells in tissues other than LN and spleen
A reduction in the efficiency of T cell exit from the thymus is reflected in an accumulation of mature (CD69lowCD62Lhi) single positive (SP) T cells. (a) Expression of CD4 and CD8 by total thymocytes (upper panels), and expression of CD69 and CD62L by CD4SP thymocytes (lower panels), from a representative Spns2Δ mouse and littermate control. (b) Percent mature CD4SP of total CD4SP and percent mature CD8SP of total CD8SP T cells in Spns2Δ mice and littermate controls. (c) Number of mature CD4SP and CD8SP thymocytes in Spns2Δ mice and littermate controls. Graphs in (b–c) compile 5 pairs of mice analyzed in 5 experiments. (d–e) Number of naïve CD4 and CD8 T cells in the Peyer’s patches (d) and bone marrow (e) of Spns2Δ mice and littermate controls. (f–h) Number of CD4 and CD8 T cells in liver (f), lungs (g) and small intestine lamina propria (h) of Spns2Δ mice and littermate controls. Interestingly, T cells do accumulate in the Peyer’s patches of Spns2Δ mice, but the numbers account for only ~5% of the missing cells (there were ~ 2.1E7 fewer naïve CD4 T cells in the combined spleen, mesenteric, inguinal, brachial, and axillary LN of Spns2Δ mice compared to controls, and 9.6E5 more naïve CD4 T cells in the Peyer’s patches of Spns2Δ mice compared to controls). Graph in (d) pools 8 pairs of mice analyzed in 8 experiments, and (e–h) pool 3 pairs of mice analyzed in 3 experiments. Lines indicate mean. Unpaired 2-tailed t-test, p=0.07 for (e), p=0.095 for (h), *p<0.05, **p<0.01.
Extended Data Figure 3
Extended Data Figure 3. Loss of naïve T cells in Spns2Δ mice is not due to conversion to another cell type
To assess whether T cells in Spns2Δ mice lose quiescence and die of activation-induced apoptosis, we assessed CD44 expression, cell size, and BrdU incorporation. (a) Expression of CD44 and CD62L on CD4 T cells in LN of representative Spns2Δ and littermate control mice. (b) % CD44hi of total CD4 and % CD44hi of total CD8 T cells in LN. (c) Number of CD44hiCD4+ T cells and CD44hiCD8+ T cells in LN. Data in (b–c) pool 9 pairs of mice analyzed in 9 experiments. (d) Forward scatter area (FSC-A) of naïve CD4 T cells in LN of a representative Spns2Δ (shaded) and littermate control (black) mouse. (e) Ratio of mean FSC-A of naive CD4 and CD8 T cells in the LN of a Spns2Δ mouse to mean FSC-A of naïve CD4 and CD8 T cells in the LN of its littermate control. Data pool 16 pairs of mice analyzed in 16 experiments. (f) Mice were injected intraperitoneally with BrdU daily for 3 days. 24 hours after the last injection, LN were collected and naïve CD4 and CD8 T cells were analyzed by flow cytometry for BrdU incorporation. Data pool 5 pairs of mice analyzed in 5 experiments. (g) Frequencies of induced regulatory T cells (iTreg) and natural regulatory T cells (nTreg) in the LN of Spns2Δ and littermate control mice. iTreg were defined as FOXP3+Neuropilin and nTreg were defined as FOXP3+Neuropilin+. Data pool 3 pairs of mice analyzed in 3 experiments. Lines indicate mean. Unpaired 2-tailed t-test, p=0.051, *p<0.05, p***<0.001.
Extended Data Figure 4
Extended Data Figure 4. Spns2 is required in Lyve1-Cre deleted radioresistant cells
Hosts were lethally irradiated and reconstituted with bone marrow (BM) from the specified congenically-marked donors. Mice were analyzed > 6 weeks after transplantation. (a) Representative flow cytometry plot of surface S1PR1 on T cells in lymph of the indicted chimeras (left). Ratio of surface S1PR1 MFI on naïve T cells in the lymph of a Spns2Δ mouse reconstituted with WT BM to surface S1PR1 MFI on naïve T cells in the lymph of a littermate control with WT BM (right). Graph compiles 5 pairs of mice analyzed in 5 experiments. (b) Representative flow cytometry plot of surface S1PR1 on T cells in lymph of the indicted chimeras (left). Ratio of surface S1PR1 MFI on naïve T cells in the lymph of a WT mouse reconstituted with Spns2Δ BM to surface S1PR1 MFI on naïve T cells in the lymph of a WT mouse reconstituted with littermate control BM (right). Graph compiles 5 pairs of mice analyzed in 5 experiments. (c) Total number of donor-derived naïve CD4 and CD8 T cells in the periphery (combined spleen and mesenteric, axillary, inguinal, and brachial LN) of the indicated chimeras. (d) Number of donor-derived naïve CD4 T cells in the lymph, blood, LN and spleen of the indicated chimeras. (e) Frequency of apoptotic donor-derived naïve CD4 T cells in the LN of the indicated chimeras. (f) Number of donor-derived naïve CD8 T cells in the lymph, blood, LN and spleen of the indicated chimeras. (g) Frequency of apoptotic donor-derived naïve CD8 T cells in the LN of the indicated chimeras. (c–g) compile 5 sets of mice (made using 2 pairs of Spns2Δ and control donors and 2 WT donors) analyzed in 5 experiments. (h–i) Reconstitution of macrophages in the LN of chimeras. (h) Gating scheme to assess reconstitution in bulk CD11b+ cells and CD11b+CD169+ sinus-lining macrophages. Representative plots for 4 sets of mice analyzed in 4 experiments. (i) Quantification of percent donor-derived CD11b+ and CD11b+CD169+ macrophages. The average percent donor-derived CD45+ hematopoietic cells was 92%, CD11b+ macrophages was 89%, and CD11b+CD169+ macrophages was 87%. Graphs compile 4 sets of mice (made using 2 pairs of Spns2Δ and control donors and 2 WT donors) analyzed in 4 experiments. Lines indicate mean. Unpaired 2-tailed t-test, p=0.061, *p<0.05, **p<0.01, ***p<0.001, ****p<0.0001.
Extended Data Figure 5
Extended Data Figure 5. Naïve T cell survival is dependent on S1P, but independent of circulation
Spns2Δ mice and littermate controls were treated for 21 days with 30 mg/L DOP and 10 g/L sucrose, or sucrose alone, in the drinking water. (a–c) The effect of DOP treatment on T cell exposure to extracellular S1P within the LN was assessed by measuring surface expression of S1PR1 on naïve T cells, which is inversely related to S1P levels. (a) Representative flow cytometry plot of surface S1PR1 on naïve CD4 T cells. An FTY720-treated mouse was used as a negative control for S1PR1 staining. (b) Ratio of cell surface S1PR1 mean fluorescence intensity (MFI) on naïve LN CD4 T cells from the indicated mice to cell surface S1PR1 MFI on naïve LN CD4 T cells from sucrose-treated control mice. 5 groups of mice analyzed in 5 experiments. (c) Ratio of cell surface S1PR1 MFI on naïve LN CD8 T cells from the indicated mice to cell surface S1PR1 MFI on naïve LN CD8 T cells from sucrose-treated control mice. 4 groups of mice analyzed in 4 experiments. (d–e) Number of naïve CD4 (d) or CD8 (e) T cells in the blood of Spns2Δ mice and littermate controls, with and without DOP treatment. 8 groups of mice analyzed in 5 experiments. (f–g) Frequency of PI+ (f) and apoptotic (g) naïve CD8 T cells in LN of Spns2Δ mice and littermate controls, with and without DOP treatment. 5 groups (control and Spns2Δ groups had a total of 6 mice, DOP-treated control and DOP-treated Spns2Δ groups had a total of 5 mice) analyzed in 3 experiments. (h) Congenically marked BCL2-Tg and littermate WT lymphocytes (at a 1:1 ratio for naïve CD4 T cell counts) were co-transferred to Spns2Δ and littermate control mice, with and without DOP treatment. 21 days after transfer, WT or BCL2-Tg naïve CD8 T cells recovered in LN were enumerated. Ratio of WT to BCL2-Tg T cells is shown for control and DOP-treated Spns2Δ mice and littermate controls. 10 mice per group of recipients analyzed in 4 experiments. Lines indicate mean. Unpaired 2-tailed t-test, *p<0.05, **p<0.01, ***p<0.001.
Extended Data Figure 6
Extended Data Figure 6. Naïve T cell survival is not dependent on S1PR4 signaling
WT CD45.1+ mice were lethally irradiated and reconstituted with bone marrow from CD45.2+ S1pr4−/− or littermate control mice. Mice were analyzed 6 weeks after bone marrow reconstitution. (a) Percent semi-mature (CD69hiCD62Llo) and mature (CD69loCD62Lhi) of total CD4SP thymocytes and percent semi-mature and mature of total CD8SP thymocytes in S1pr4−/− and control chimeras. (b) Number of semi-mature and mature CD4SP and CD8SP thymocytes. (c–e) Number of naïve CD4 and CD8 T cells in blood (c), spleen (d) and LN (e). LN quantified were brachial, axillary, inguinal, and mesenteric. Two sets of S1pr4−/− and littermate control bone marrow donors were used. Data pool 5 pairs of chimeras analyzed in 3 experiments, all gated on CD45.2+ cells. Lines indicate mean. Unpaired 2-tailed t-test, *p<0.05.
Extended Data Figure 7
Extended Data Figure 7. Cell autonomous S1PR1 signaling is required in naïve CD8 T cells to inhibit apoptosis
(a–b) Adult S1pr1f/fUBC-CreERT2 mice and littermate controls were thymectomized, treated with tamoxifen, and analyzed 12 weeks later (tamoxifen-treated S1pr1f/fUBC-CreERT2 mice are referred to as S1pr1Δ). (a) Number of naïve CD8 T cells in LN (mesenteric, axillary, inguinal, and brachial) and spleen of S1pr1Δ mice and littermate controls. (b) Frequency of apoptotic naïve CD8 T cells in LN and spleen of S1pr1Δ mice and littermate controls. 5 pairs of mice analyzed in 3 experiments. (c–d) CD45.1+ mice were lethally irradiated and reconstituted with a mix of BM from WT UBC:GFP mice and BM from S1pr1f/fUBC-CreERT2 CD45.2+ mice or littermate controls. The mice were thymectomized 6 weeks after reconstitution and tamoxifen treated 4 weeks after surgery. (c) Ratio of the number of S1pr1f/fUBC-CreERT2 or littermate control naïve CD8 T cells to the number of GFP+ naïve CD8 T cells found in the blood before tamoxifen-induced S1pr1 deletion, and the same ratio in the blood, LN, and spleen 24 weeks after tamoxifen treatment. 5 pairs of mice from 2 bone marrow donor sets (except control spleen, with 4 mice), analyzed in 3 experiments. (d) Frequency of apoptotic S1pr1Δ or littermate control naïve CD8 T cells and GFP+ WT naïve CD8 T cells. 10 pairs of mice from 3 bone marrow donor sets analyzed in 5 experiments 12 or 24 weeks after tamoxifen treatment. (e) CD45.1+ WT mice were irradiated and reconstituted with a 1:1 ratio of UBC:GFP WT BM and either CD45.2+ S1pr1f/f or S1pr1f/f;UBC-CreERT2 BM. After 6 weeks, Cre activity was induced with 5 daily injections of tamoxifen (in both groups of mice). 5 days after the last dose of tamoxifen, naive GFP-CD45.2+ CD4 T cells were sorted from LN. Transcripts were quantified by RNA-Seq, and differentially expressed genes (Benjamini-Hochberg adjusted p-value <0.05) were analyzed using Ingenuity Pathway Analysis (Qiagen v. 1.0). Differentially expressed transcripts that fell into the “Molecular and Cellular Functions” category with the annotation “Cell death and survival” are shown. Lines indicate mean. Unpaired 2-tailed t-test, p=0.092, *p<0.05, **p<0.01, **** p<0.0001.
Extended Data Figure 8
Extended Data Figure 8. DOP does not rescue cell death in S1pr1 deficient mice
Frequency of apoptotic (a, c) and PI+ (b, d) naïve CD4 (a, b) and naïve CD8 (c, d) T cells in LN of S1pr1Δ mice and littermate controls, with and without DOP treatment (30 mg/L DOP with 10 g/L sucrose in drinking water, or sucrose alone, for 3 weeks, as in Fig. 2). 6 groups of mice analyzed in 4 experiments. Lines indicate mean. Unpaired 2-tailed t-test, *p<0.05, **p<0.01.
Extended Data Figure 9
Extended Data Figure 9. Little evidence that S1PR1 regulates access to IL7 or self-peptide/MHC
(a–b) Sorted naïve CD4 T cells (which do not express MHCII) (a) and sorted naïve CD8 T cells (b) from LN of S1pr1Δ and littermate control animals were cultured for 5 days in the indicated concentrations of IL7. Frequency of PI+ cells measured by flow cytometry. Graph pools 9 experiments (a) or 6 experiments (b). (c) Western blot of LN CD4 T cells stimulated ex vivo with IL7. Representative of 2 experiments. (d–e) Immunofluorescence staining for the indicated markers in the LN T zone. (FRC, fibroblastic reticular cells). Representative of 3 experiments. (f) Representative cell surface IL7Rα on LN naïve CD4 T cells. (g) Ratio of IL7Rα MFI on S1pr1Δ LN naïve CD4 and CD8 T cells to littermate controls. Compiles data from 4 pairs in 4 experiments. (h) Representative Nur77 expression by naïve CD4 T cells isolated from LN of S1pr1Δ and littermate control animals. Naïve CD4 T cells transferred to MHCII-KO recipients and activated CD4 T cells were used as negative and positive controls for Nur77 expression respectively. (i) Ratio of Nur77 MFI in S1pr1Δ LN naïve T cells to littermate controls. Graph compiles 4 pairs of mice analyzed in 4 experiments. (j–m) S1pr1Δ and littermate control mice were treated with either IL7Rα blocking or isotype control antibody, and analyzed 5 days later. (j) Efficacy of IL7Rα blockade was assessed by staining for IL7Rα (using the anti-IL7Rα blocking antibody) on naïve CD4 T cells from LN of mice treated with anti-IL7Rα and isotype control. (k) Efficacy of IL7Rα blockade was measured by the ability of LN CD4 T cells from anti-IL7Rα and isotype control treated mice to phosphorylate STAT5 in response to IL7 ex vivo (5 minute stimulation with the indicated concentrations of IL7), measured by Western blot. Representative of 3 experiments. (l–m) Frequency of apoptotic naïve CD4 (l) and CD8 (m) T cells in LN. 8 groups of mice analyzed in 4 experiments. (n) Sorted LN naïve CD4 T cells from S1pr1Δ animals and littermate controls were transferred to MHCII-KO recipients. Cells in recipient LN were analyzed 5 days later. 4 pairs in 4 experiments. We cannot exclude effects below our limit of detection, or the possibility that pre-existing defects in S1pr1Δ cells preserve the differences measured in our assays. Lines mean, error bars SEM. Unpaired 2-tailed t-test, =0.052, *p<0.05, **p<0.01.
Extended Data Figure 10
Extended Data Figure 10. Naïve T cells require S1PR1 signaling for maintenance of mitochondrial content and function
(a) Naïve CD8 T cells from LN of S1pr1Δ mice and littermate controls were analyzed by flow cytometry for total mitochondria (MitoTracker Deep Red FM) and functional mitochondria (MitoTracker Red CMX-Ros). Representative histograms and compiled ratios are shown for 4 pairs of mice analyzed in 4 experiments. (b–c) Frequency of apoptotic naïve CD4 (b) or CD8 (c) T cells from LN of Ctrl, S1pr1Δ, Ctrl BCL2+, and S1pr1Δ BCL2+ mice. Compiles 3 sets of mice analyzed in 3 experiments. (d–e) Mitochondrial function was assayed ex vivo in sorted naïve CD4 and CD8 T cells from LN of Ctrl BCL2+ and S1pr1Δ BCL2+ mice using XF Cell Mito Stress Test Kit and an XFe96 Extracellular Flux Analyzer (Agilent Technologies, formerly Seahorse). (d) Oxygen consumption rate (OCR) of naïve CD4 T cells from LN of Ctrl BCL2+ and S1pr1Δ BCL2+mice. Graph plots replicates from 1 experiment. Error bars show SEM. Data are representative of 2 pairs of mice analyzed in 2 experiments. (e) OCR of naïve CD8 T cells from Ctrl BCL2+ and S1pr1Δ BCL2+mice. Graph plots replicates from 1 experiment. Error bars show SEM. Data are representative of 2 pairs of mice analyzed in 2 experiments. (f) Ratio of average basal and maximal oxygen consumption rates (OCR) of S1pr1Δ naïve CD8 LN T cells to the average basal and maximal OCR of littermate controls. Graph compiles 3 pairs of mice analyzed in 3 experiments. Black dots indicate OCR ratios between S1pr1Δ mice and controls, grey dots indicate OCR ratios between S1pr1Δ;BCL2-tg mice and BCL2-tg controls. (g–j) CellTrace Violet-labeled CD4 and CD8 T cells from LN of S1pr1Δ mice and littermate controls were activated with anti-CD3/CD28 and cultured in medium supplemented with glucose or galactose for 72 hours. CellTrace Violet dilution for CD4 (g) and CD8 (h) T cells and total numbers of CD4 (i) and CD8 (j) T cells measured 72 hours after activation. Graph compiles triplicate samples from 4 pairs of mice analyzed in 4 experiments. (k) Transcripts upregulated as part of the ER unfolded protein response – Eif2ak3 (PERK), Hspa5 (BIP), and Ddit3 (CHOP) – were measured by RT-qPCR on sorted naïve CD4 T cells from LN of S1pr1Δ and littermate control animals. Data compile 4 sets of cells sorted from 4 pairs of mice. Error bars show SEM. (l) Ratio of β-actin signal quantified by Western blot to the number of CD4 T cells loaded per well from S1pr1Δ mice and littermate controls. Graph compiles 4 sets of samples from 4 pairs of mice analyzed in 2 experiments (a subset of the samples in Fig. 4b). (m) CD4 T cells isolated from LN were stimulated ex vivo with 1 μM S1P or vehicle for 3 hours. AKT and S6 phosphorylation were assessed by Western blot. Representative of 2 experiments. Lines and bars mean, error bars SEM. Unpaired 2-tailed t-test, =p=0.053, *p<0.05, **p<0.01.
Figure 1
Figure 1. SPNS2 is required for naïve T cell survival
(a,b) Number of naïve (CD44lowCD62Lhi) CD4 T cells in periphery (combined spleen and LN) (a), spleen, and LN (b). 8 pairs analyzed in 8 experiments. (c–e) Gating (c) and frequency of PI+ (d) and apoptotic (e) LN naïve CD4. 6 pairs, 6 experiments. (f) Congenically-labeled lymphocytes from BCL2-Tg and WT littermates were co-transferred (1:1 by naïve CD4 counts). 21 days later, naïve CD4 were enumerated in recipients’ tissues. 11 pairs, 4 experiments. t-test, *p<0.05, **p<0.01, ***p<0.001, ****p<0.0001.
Figure 2
Figure 2. Naïve T cell survival depends on S1P, but not circulation
Spns2Δ mice and littermate controls were treated for 21 days with DOP or vehicle. Frequency of PI+ (a) and apoptotic (b) LN naïve CD4. 5 groups, 3 experiments. (c) Congenically marked BCL2-Tg and littermate WT lymphocytes were co-transferred (1:1 by naïve CD4 counts). 21 days later, naïve CD4 were enumerated in recipients’ LN. 10 groups, 4 experiments. t-test, p=0.078, *p<0.05, **p<0.01, ***p<0.001, ****p<0.0001.
Figure 3
Figure 3. Cell-autonomous S1PR1 inhibits apoptosis
(a–b) Adult S1pr1f/fUBC-CreERT2 mice and littermate controls were thymectomized, tamoxifen-treated, and analyzed 12 weeks later. Number of naïve CD4 (a), and frequency of apoptotic naïve CD4 (b). 5 pairs, 3 experiments. (c–d) CD45.1+ mice were reconstituted with a mix of BM from WT UBC:GFP mice and BM from S1pr1f/fUBC-CreERT2 CD45.2+ mice or littermate controls. Chimeras were thymectomized 6 weeks after reconstitution, and tamoxifen-treated 4 weeks later. (c) Ratio of the number of S1pr1f/fUBC-CreERT2 or control naïve CD4 to GFP+ naïve CD4. 5 pairs of mice from 2 BM donor sets, analyzed in 3 experiments 24 weeks post-tamoxifen (control spleen has 4 mice). (d) Frequency of apoptotic naïve CD4 in LN. 10 pairs from 3 BM donor sets in 5 experiments analyzed 12 or 24 weeks post-tamoxifen. t-test, **p<0.01, ****p<0.0001.
Figure 4
Figure 4. Naïve T cells require S1PR1 to maintain mitochondrial content
(a–b) LN CD4 T cells analyzed by Western blot. Quantification of 7 pairs in 5 experiments for VDAC1 and calnexin, 6 pairs in 5 experiments for COXIV. (c–d) LN naïve CD4 analyzed by flow cytometry. 4 pairs, 4 experiments. (e–f) OCR of sorted LN naïve CD4. Curve showing technical replicates from one pair (e), and compilation of 4 pairs in 3 experiments (f). Black dots indicate ratios between S1pr1Δ and controls, grey dots ratios between S1pr1Δ;BCL2-tg and BCL2-tg controls. (g–h) Immunofluorescence of LN CD4 T cells. Arrows, examples of colocalization. Quantification compiles cells from 7 pairs in 6 experiments. (i–j) LN CD4 T cells analyzed by Western blot. 6 pairs, 4 experiments. Error, SEM. t-test, *p<0.05, ***p<0.001.

Comment in

References

    1. Jenkins MK, Chu HH, McLachlan JB, Moon JJ. On the composition of the preimmune repertoire of T cells specific for Peptide-major histocompatibility complex ligands. Annual review of immunology. 2010;28:275–294. - PubMed
    1. Boehm T, Swann JB. Thymus involution and regeneration: two sides of the same coin? Nature reviews. Immunology. 2013;13:831–838. - PubMed
    1. Cyster JG, Schwab SR. Sphingosine-1-phosphate and lymphocyte egress from lymphoid organs. Annual review of immunology. 2012;30:69–94. - PubMed
    1. Proia RL, Hla T. Emerging biology of sphingosine-1-phosphate: its role in pathogenesis and therapy. The Journal of clinical investigation. 2015;125:1379–1387. - PMC - PubMed
    1. Mendoza A, et al. The transporter Spns2 is required for secretion of lymph but not plasma sphingosine-1-phosphate. Cell reports. 2012;2:1104–1110. - PMC - PubMed

Publication types

MeSH terms