. 2017 May 1;17(5):13.
doi: 10.1167/17.5.13.

FEFsem neuronal response during combined volitional and reflexive pursuit

Affiliations

FEFsem neuronal response during combined volitional and reflexive pursuit

Leah Bakst et al. J Vis. .

Abstract

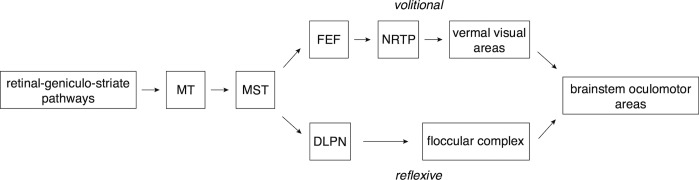
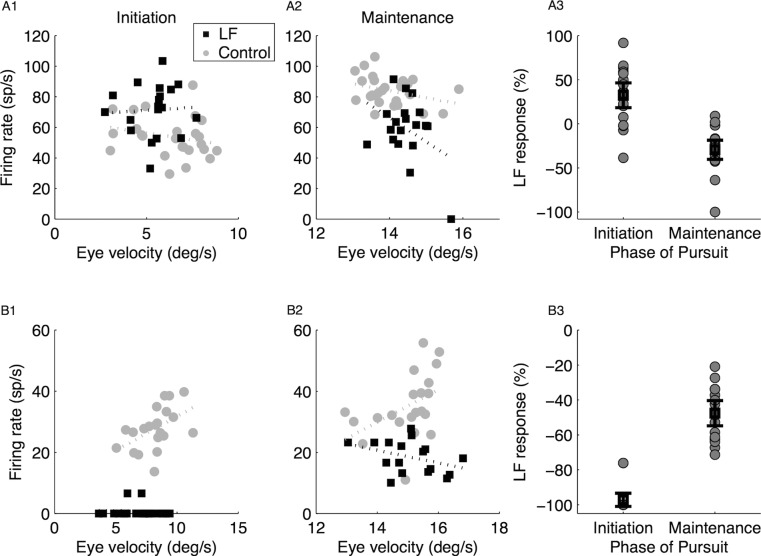
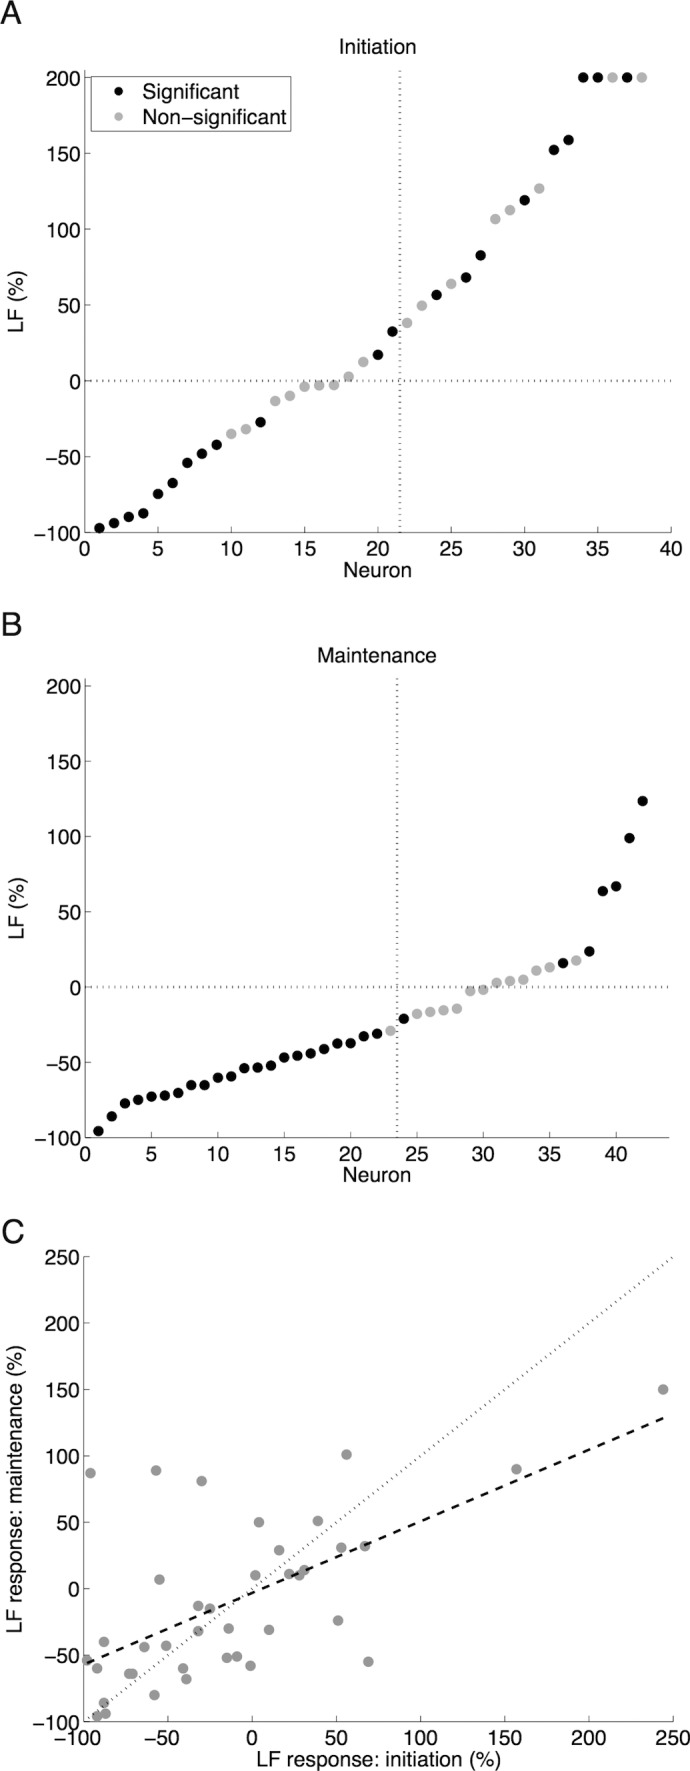
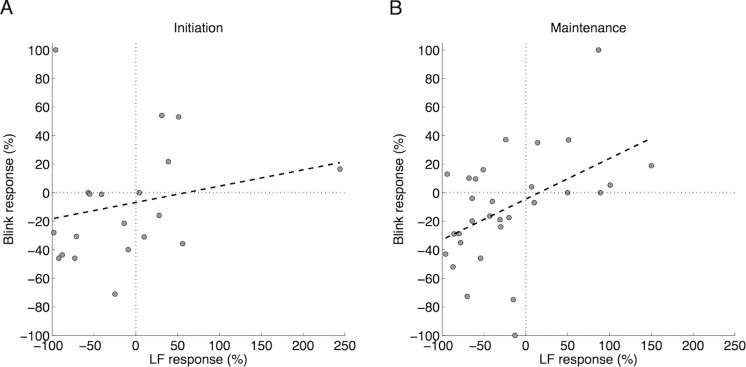
Although much is known about volitional and reflexive smooth eye movements individually, much less is known about how they are coordinated. It is hypothesized that separate cortico-ponto-cerebellar loops subserve these different types of smooth eye movements. Specifically, the MT-MST-DLPN pathway is thought to be critical for ocular following eye movements, whereas the FEF-NRTP pathway is understood to be vital for volitional smooth pursuit. However, the role that these loops play in combined volitional and reflexive behavior is unknown. We used a large, textured background moving in conjunction with a small target spot to investigate the eye movements evoked by a combined volitional and reflexive pursuit task. We also assessed the activity of neurons in the smooth eye movement subregion of the frontal eye field (FEFsem). We hypothesized that the pursuit system would show less contribution from the volitional pathway in this task, owing to the increased involvement of the reflexive pathway. In accordance with this hypothesis, a majority of FEFsem neurons (63%) were less active during pursuit maintenance in a combined volitional and reflexive pursuit task than during purely volitional pursuit. Interestingly and surprisingly, the neuronal response to the addition of the large-field motion was highly correlated with the neuronal response to a target blink. This suggests that FEFsem neuronal responses to these different perturbations-whether the addition or subtraction of retinal input-may be related. We conjecture that these findings are due to changing weights of both the volitional and reflexive pathways, as well as retinal and extraretinal signals.


Figures

Figure 1
Figure 1
Schematic representation of pathways for volitional and reflexive pursuit. The two pathways have common beginnings and ends but discrete cortico-ponto-cerebellar portions. The upper part of the schematic represents the likely neural pathways subserving volitional pursuit, whereas the bottom portion represents the likely pathways underlying reflexive ocular following. MT = middle temporal area; MST = medial superior temporal area; FEF = smooth eye movement subregion of the frontal eye field; NRTP = nucleus reticularis tegmenti pontis; DLPN = dorsolateral pontine nucleus.
Figure 2
Figure 2
Smooth eye movements in a combined volitional and reflexive tracking task. (A) Average eye movement traces for Monkey T. The gray trace represents control trials (n = 921) with no LF motion, and the black trace represents trials with concurrent LF motion (n = 532). Target motion onset and offset at 0 and 1000 ms, respectively, indicated by the dashed vertical lines. The gray shaded regions indicate the quantification intervals used for initiation (50–200 ms after target motion onset) and maintenance (300–600 ms). (B) Average eye movement traces for Monkey B, same conventions as in (A). Control trials n = 752, LF trials n = 202. (C) Average eye movement traces for Monkey F, same conventions as in (A). Control trials n = 978, LF trials n = 90.
Figure 3
Figure 3
Quantification of behavior. (A) Eye velocity at peaks and troughs during pursuit, as seen in Figure 2. Each line represents data from an individual monkey. Both Monkeys T and F had two quantifiable peaks and troughs, whereas Monkey B exhibited only one. (B) Peak-trough differences in eye velocity for each monkey.
Figure 4
Figure 4
Example FEFsem neuronal activity during combined volitional and reflexive pursuit. Top panel shows the target velocity (dashed line), average eye velocity in control trials (gray shaded region, n = 26), and LF trials (black line, n = 19). Middle panel shows the average spike density function for control and LF trials; conventions as in the top panel. Gray horizontal lines represent the intervals used for initiation and maintenance. Bottom panel shows a raster plot for the LF trials. Data from Monkey T.
Figure 5
Figure 5
Relationship of firing rate to eye velocity in two representative FEFsem neurons. The neuron in (A) is the same as from Figure 4. (A1) Data from initiation interval. Average of firing rate and eye velocity from the initiation interval for control (gray, n = 26) and LF (black, n = 19) trials. Dotted lines represent best linear fits. (A2) Data from maintenance interval, same conventions as in A1. (A3) LF response for both intervals for each LF trial. Mean and 95% confidence intervals shown atop in black. Significant difference between initiation and maintenance (p < 0.001). (B1–3) Same conventions as in (A1–3). Control trials (n = 21), LF trials (n = 17). Data from Monkey T. Significant difference between LFinit and LFmaint, p < 0.001.
Figure 6
Figure 6
Distribution of neuronal responses across the FEFsem population. (A) LFinit: each point represents an individual neuron's response (n = 39). Difference in firing rate between control and LF trials expressed as percentage change; significant differences between LF and control shown by black points. Mean of responses shown by dashed vertical line (37%). (B) Same conventions as in (A) but for the LFmaint (n = 43). Mean = −23%. (C) Comparison of LFinit and LFmaint. Each point represents data from one neuron. Dotted line represents unity, and the dashed line is the line of best fit (R2 = 0.392, p < 0.001), with the equation: LFmaint = 0.54(LFinit) – 3.17.
Figure 7
Figure 7
Comparison of LF and blink responses in FEFsem neurons. (A) Comparison of LFinit (50–200 ms after target motion onset) and the early blink response (110–310 ms). Each gray point represents data from one neuron (n = 20). Dashed line is the line of best fit (R2 = 0.049, p = 0.35), with the equation: Early Blink Response = 0.11(LFinit) – 6.86. (B) Same conventions as in (A) but for LFmaint (300–600 ms) and late blink response (360–710 ms; n = 30). The line of best fit (R2 = 0.220, p < 0.01) has the equation: Late Blink Response = 0.28(LFmaint) – 4.54.

Similar articles

Cited by

References

    1. Asanuma, C., Thach, W. T., & Jones, E. G.. (1983a). Anatomical evidence for segregated focal groupings of efferent cells and their terminal ramifications in the cerebellothalamic pathway of the monkey. Brain Research Reviews, 5, 267–297. - PubMed
    1. Asanuma, C., Thach, W. T., & Jones, E. G.. (1983b). Distribution of cerebellar terminations in the ventral lateral thalamic region of the monkey. Brain Research Reviews, 5, 237–265. - PubMed
    1. Bakst, L., Fleuriet, J., & Mustari, M. J.. (2017). Temporal dynamics of retinal and extraretinal signals in the FEFsem during smooth pursuit eye movements. Journal of Neurophysiology, 117 5, 1987–2003. - PMC - PubMed
    1. Bogadhi, A. R., Montagnini, A., & Masson G.. (2013). Dynamic interaction between retinal and extraretinal signals in motion integration for smooth pursuit. Journal of Vision, 13 13: 5, 1–26, doi:10.1167/13.13.5. [PubMed] [Article] - DOI - PubMed
    1. Boussaoud, D., Desimone, R., & Ungerleider, L.G.. (1992). Subcortical connections of visual areas MST and FST in macaques. Visual Neuroscience, 9, 291–302. - PubMed

LinkOut - more resources