. 2017 May 24;37(21):5263-5273.
doi: 10.1523/JNEUROSCI.3981-16.2017.

Sleep Loss Promotes Astrocytic Phagocytosis and Microglial Activation in Mouse Cerebral Cortex

Affiliations

Sleep Loss Promotes Astrocytic Phagocytosis and Microglial Activation in Mouse Cerebral Cortex

Michele Bellesi et al. J Neurosci. .

Abstract

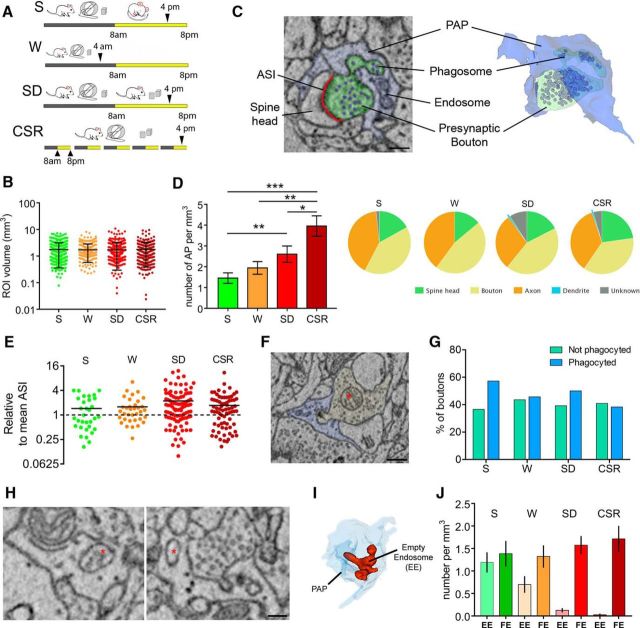
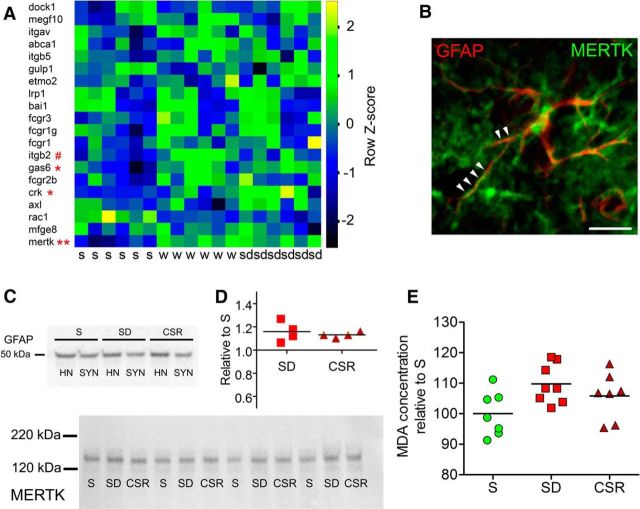
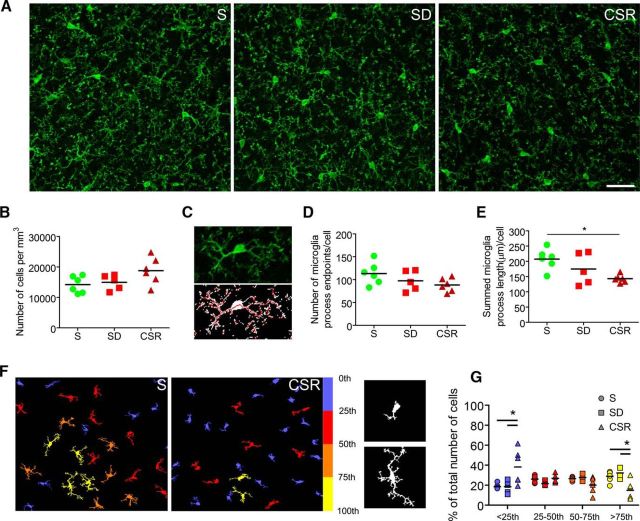
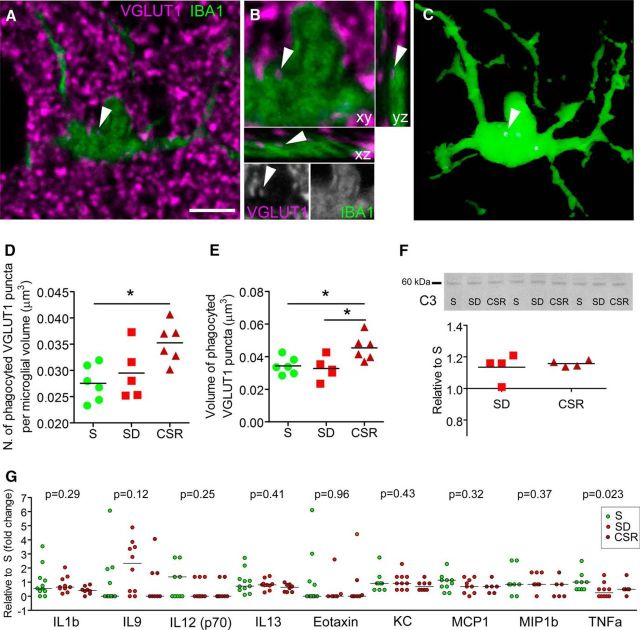
We previously found that Mertk and its ligand Gas6, astrocytic genes involved in phagocytosis, are upregulated after acute sleep deprivation. These results suggested that astrocytes may engage in phagocytic activity during extended wake, but direct evidence was lacking. Studies in humans and rodents also found that sleep loss increases peripheral markers of inflammation, but whether these changes are associated with neuroinflammation and/or activation of microglia, the brain's resident innate immune cells, was unknown. Here we used serial block-face scanning electron microscopy to obtain 3D volume measurements of synapses and surrounding astrocytic processes in mouse frontal cortex after 6-8 h of sleep, spontaneous wake, or sleep deprivation (SD) and after chronic (∼5 d) sleep restriction (CSR). Astrocytic phagocytosis, mainly of presynaptic components of large synapses, increased after both acute and chronic sleep loss relative to sleep and wake. MERTK expression and lipid peroxidation in synaptoneurosomes also increased to a similar extent after short and long sleep loss, suggesting that astrocytic phagocytosis may represent the brain's response to the increase in synaptic activity associated with prolonged wake, clearing worn components of heavily used synapses. Using confocal microscopy, we then found that CSR but not SD mice show morphological signs of microglial activation and enhanced microglial phagocytosis of synaptic elements, without obvious signs of neuroinflammation in the CSF. Because low-level sustained microglia activation can lead to abnormal responses to a secondary insult, these results suggest that chronic sleep loss, through microglia priming, may predispose the brain to further damage.SIGNIFICANCE STATEMENT We find that astrocytic phagocytosis of synaptic elements, mostly of presynaptic origin and in large synapses, is upregulated already after a few hours of sleep deprivation and shows a further significant increase after prolonged and severe sleep loss, suggesting that it may promote the housekeeping of heavily used and strong synapses in response to the increased neuronal activity of extended wake. By contrast, chronic sleep restriction but not acute sleep loss activates microglia, promotes their phagocytic activity, and does so in the absence of overt signs of neuroinflammation, suggesting that like many other stressors, extended sleep disruption may lead to a state of sustained microglia activation, perhaps increasing the brain's susceptibility to other forms of damage.

Keywords: astrocyte; cortex; microglia; mouse; sleep; sleep deprivation.


Figures

Figure 1.
Figure 1.
Sleep loss promotes AP. A, Experimental design. B, Volume of all ROIs analyzed in S (n = 295), W (n = 266), SD (n = 355), and CSR (n = 280) mice. Black bars depict mean and SD. C, Example of AP as visualized in two-dimensional SBEM images (left) and its 3D reconstruction (right). Scale bar: 200 nm. D, Left, Number of synaptic elements phagocyted by astrocytes in S, W, SD, and CSR mice. Values (mean ± SEM) are expressed per cubed millimeter of astrocytic volume. *p < 0.05; **p < 0.01; ***p < 0.001. Right, Breakdown frequency analysis of the neuropil structures involved in AP for S, W, SD, and CSR. E, ASI size of all S, W, SD, and CSR AP+ synapses relative to mean ASI size (dashed line) in a random sample of synapses (S, n = 302; W, n = 256; SD, n = 345; CSR, n = 296). F, Example of a presynaptic bouton (yellow) containing a mitochondrion (asterisk) and being phagocyted by a PAP (blue). Scale bar, 400 nm. G, Percentage of presynaptic boutons containing a mitochondrion that are (blue bars) or are not (green bars) involved in AP in S, W, SD, and CSR mice. H, Examples of FE (asterisk, left) and EE (asterisk, right). Scale bar, 130 nm. I, 3D reconstruction of one EE (red). Note its tubular structure within the PAP (light blue). J, Number of EE and FE (mean ± SEM) per cubed millimeter of astrocytic volume in S, W, SD, and CSR mice.
Figure 2.
Figure 2.
Sleep loss is associated with MERTK upregulation. A, Heat diagram showing the expression levels of astrocytic genes previously identified (Cahoy et al., 2008) as indicative of phagocytosis in astrocytic-enriched samples of S, W, and SD adult heterozygous Aldh1L1-eGFP-L10a mice (Bellesi et al., 2015). #p < 0.05 in S versus W; *p < 0.1 and **p < 0.01 in S versus SD. B, Example of an astrocyte stained with GFAP (red) and coexpressing MERTK (green) along its processes (arrowheads). Scale bar, 30 μm. C, Top, GFAP expression in cortical homogenates (HN) and synaptoneurosomes (SYN). Bottom, Representative bands from S, SD, and CSR pools (n = 4 per pool) showing MERTK expression in cortical synaptoneurosomes. D, Western blot quantification of MERTK expression in SD (p < 0.05) and CSR (p < 0.05) relative to S. E, Lipid peroxidation analysis showing MDA concentration for S, SD, and CSR mice (KW test, p = 0.065).
Figure 3.
Figure 3.
Chronic sleep loss is associated with microglia activation. A, Raw images from S (n = 6), SD (n = 5), and CSR (n = 6) mice (frontal cortex) showing IBA-1 staining. Scale bar, 30 μm. B, Number of IBA-1-positive cells per cubed millimeter in S, SD, and CSR mice. C, Example of one IBA-1-positive microglial cell as it appears from the raw image and after processing (despeckling and skeletonizing). D, E, Number of end points per cell (D) and sum of all process lengths per microglial cell (E) in S, SD, and CSR mice. *p < 0.05. F, Left, Examples from S and CSR fields showing processed and color-coded IBA-1 microglial cells (yellow, more ramified; blue, less ramified). Right, Examples of poorly ramified (above) and very ramified (below) IBA-1 microglial cells. G, Distribution in quartiles of the number of IBA-1 microglial cells ranked by area size, an indirect measure of the complexity of process branching. *p < 0.05.
Figure 4.
Figure 4.
Chronic sleep loss is associated with microglial phagocytosis. A, Raw image showing an IBA-1-positive microglia (green) and VGLUT-1 puncta staining (magenta) in a representative CSR mouse. Scale bar, 5 μm. B, Enlarged frame of the cell shown in A, visualized also in the xz and yz projections and in gray separated channels, showing a VGLUT-1-positive element engulfed within the microglial soma (arrowheads). C, 3D reconstruction of the same cell showing the engulfed VGLUT-1 element (arrowhead). D, E, Number (D) and volume (E) of phagocyted VGLUT-1 elements per microglial cell for S (n = 6), SD (n = 5), and CSR (n = 6). *p < 0.05. F, Western blot analysis of the complement component C3 for SD and CSR pools relative to S pools. Representative bands are depicted above from cortical homogenates of S, SD, and CSR pools (n = 4 per pool). G, Protein levels of cytokines and chemokines in CSF from S (n = 11), SD (n = 10), and CSR (n = 8) mice. Protein levels were measured in individual CSF specimens using multiplex magnetic bead technology for the simultaneous measurement of the 23 cytokines/chemokines. Shown is the expression of the detected molecules and the relative p values obtained from the KW test.

References

    1. Bellesi M, Vyazovskiy VV, Tononi G, Cirelli C, Conti F (2012) Reduction of EEG theta power and changes in motor activity in rats treated with ceftriaxone. PloS One 7:e34139. 10.1371/journal.pone.0034139 - DOI - PMC - PubMed
    1. Bellesi M, Pfister-Genskow M, Maret S, Keles S, Tononi G, Cirelli C (2013) Effects of sleep and wake on oligodendrocytes and their precursors. J Neurosci 33:14288–14300. 10.1523/JNEUROSCI.5102-12.2013 - DOI - PMC - PubMed
    1. Bellesi M, de Vivo L, Tononi G, Cirelli C (2015) Effects of sleep and wake on astrocytes: clues from molecular and ultrastructural studies. BMC Biol 13:66. 10.1186/s12915-015-0176-7 - DOI - PMC - PubMed
    1. Berbel P, Innocenti GM (1988) The development of the corpus callosum in cats: a light- and electron-microscopic study. J Comp Neurol 276:132–156. 10.1002/cne.902760109 - DOI - PubMed
    1. Bialas AR, Stevens B (2013) TGF-beta signaling regulates neuronal C1q expression and developmental synaptic refinement. Nat Neurosci 16:1773–1782. 10.1038/nn.3560 - DOI - PMC - PubMed

Publication types

MeSH terms

Substances