. 2017 Aug 1;118(2):1105-1122.
doi: 10.1152/jn.00141.2017. Epub 2017 May 24.

Automatic and intentional influences on saccade landing

Affiliations

Automatic and intentional influences on saccade landing

David Aagten-Murphy et al. J Neurophysiol. .

Abstract

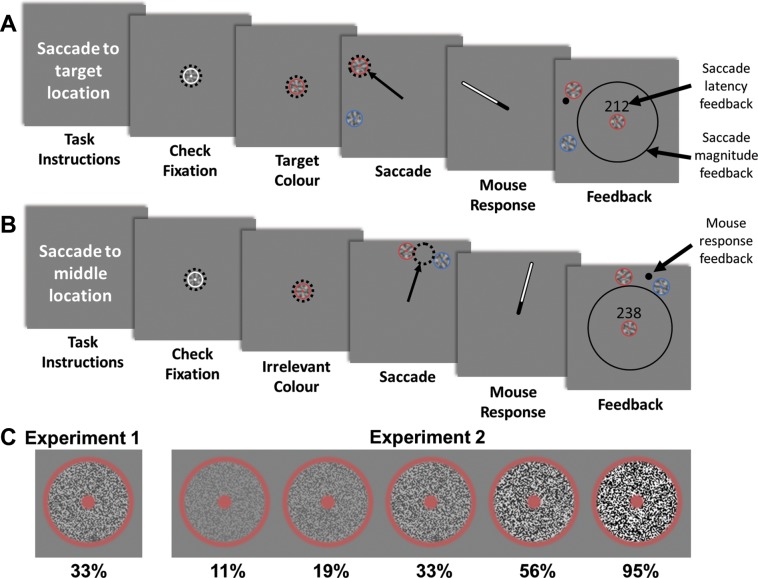
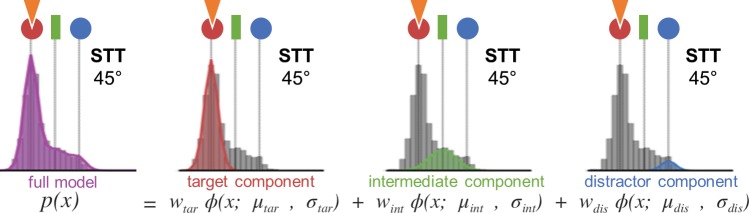
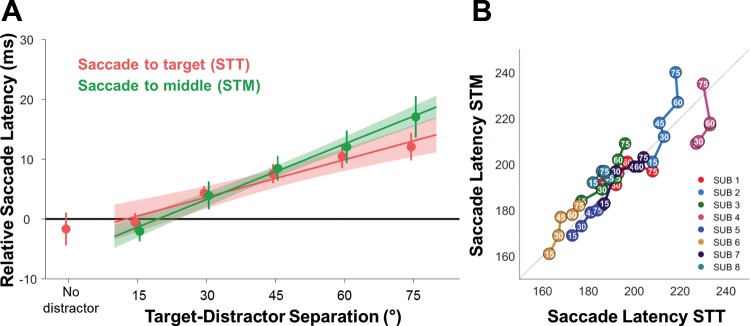
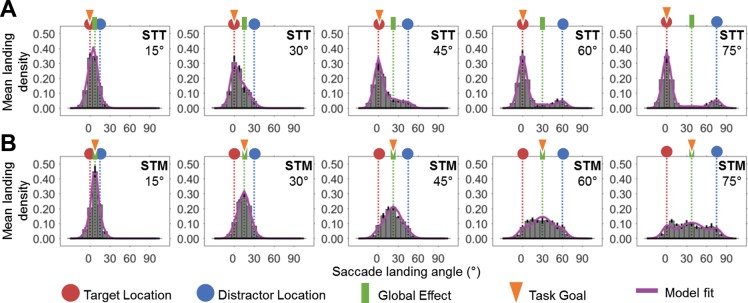
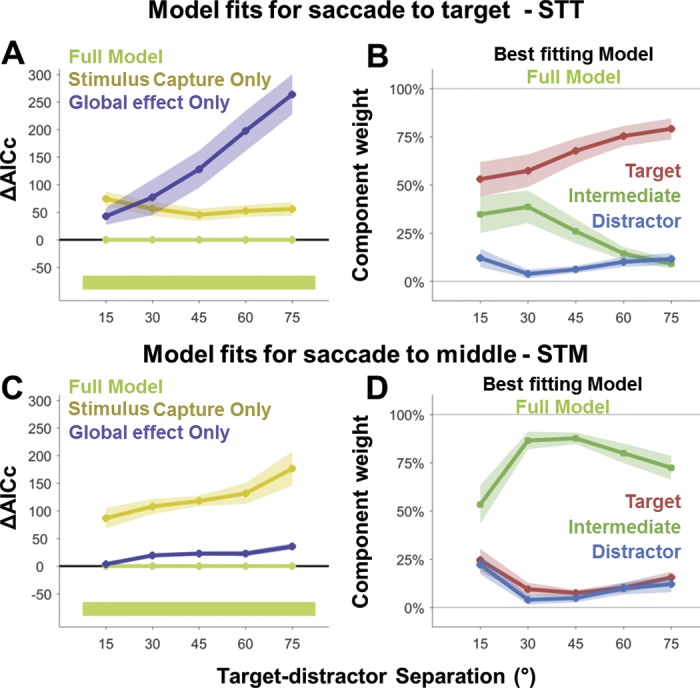
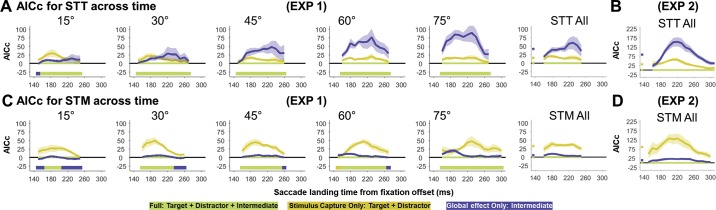
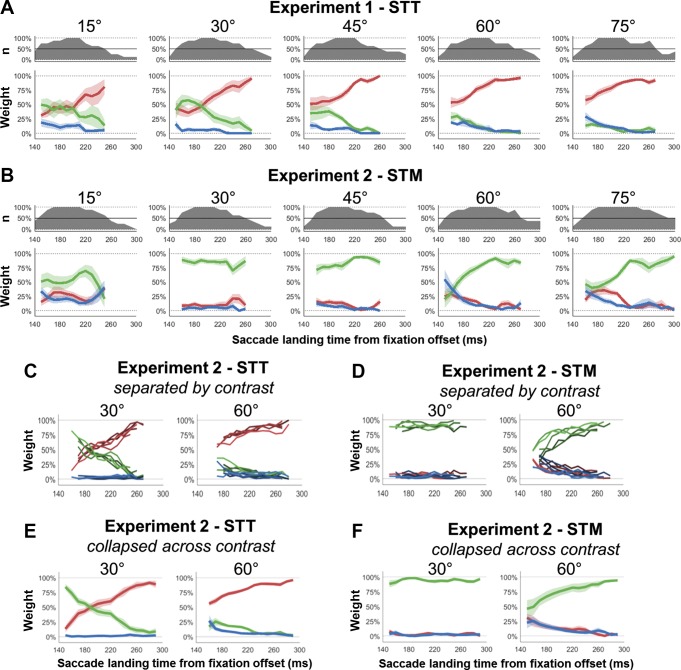
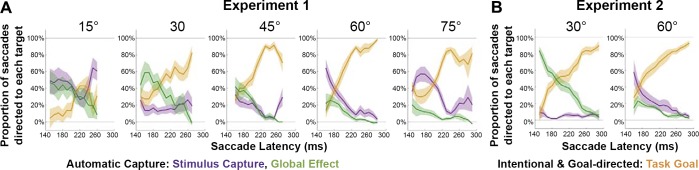
Saccadic eye movements enable us to rapidly direct our high-resolution fovea onto relevant parts of the visual world. However, while we can intentionally select a location as a saccade target, the wider visual scene also influences our executed movements. In the presence of multiple objects, eye movements may be "captured" to the location of a distractor object, or be biased toward the intermediate position between objects (the "global effect"). Here we examined how the relative strengths of the global effect and visual object capture changed with saccade latency, the separation between visual items and stimulus contrast. Importantly, while many previous studies have omitted giving observers explicit instructions, we instructed participants to either saccade to a specified target object or to the midpoint between two stimuli. This allowed us to examine how their explicit movement goal influenced the likelihood that their saccades terminated at either the target, distractor, or intermediate locations. Using a probabilistic mixture model, we found evidence that both visual object capture and the global effect co-occurred at short latencies and declined as latency increased. As object separation increased, capture came to dominate the landing positions of fast saccades, with reduced global effect. Using the mixture model fits, we dissociated the proportion of unavoidably captured saccades to each location from those intentionally directed to the task goal. From this we could extract the time course of competition between automatic capture and intentional targeting. We show that task instructions substantially altered the distribution of saccade landing points, even at the shortest latencies.NEW & NOTEWORTHY When making an eye movement to a target location, the presence of a nearby distractor can cause the saccade to unintentionally terminate at the distractor itself or the average position in between stimuli. With probabilistic mixture models, we quantified how both unavoidable capture and goal-directed targeting were influenced by changing the task and the target-distractor separation. Using this novel technique, we could extract the time course over which automatic and intentional processes compete for control of saccades.

Keywords: global effect; oculomotor capture; target selection; top-down selection.


Figures

Fig. 1.
Fig. 1.
Procedure for the two different tasks. The procedure for the saccade to target (STT; A) and saccade to middle (STM; B) tasks are shown. Participants were required to maintain fixation until the disappearance of the fixation stimulus, at which stage they executed an eye movement as rapidly as possible to the task goal location. Immediately afterwards, they were required to indicate the goal location with the computer mouse. They were then given feedback regarding the magnitude (but not the angle) of their saccade (to discourage participants undershooting the goal location) and the latency of their saccade (with participants instructed to aim for 200 ms or faster) and were shown the location of their perceptual response in relation to the target and distractor. C: a close-up view of the stimuli, with the different contrast modifications used in experiment 2.
Fig. 2.
Fig. 2.
Probabilistic mixture model. The data show a histogram of saccade landing end-point distributions for fictitious data on the STT task with a target and distractor separation of 45°. The target, distractor, and intermediate locations are shown by red, blue, and green symbols, respectively, while the task goal (here “saccade to target”) is indicated by the orange triangle. The general formula for the full model is shown with a diagram of the corresponding Gaussian distribution shown above each component. The sum of the Gaussians is shown in purple. Each component consists of a weight, determining its relative strength in the mixture, a fixed parameter for the Gaussian’s center (target, intermediate, or distractor), and a parameter for the width of the distribution. We additionally examined simpler variations of the model in which we selectively eliminated different components to test their necessity for accurately describing the data.
Fig. 3.
Fig. 3.
Saccade latency for the different tasks and target-distractor separations. A: the changes in saccade latency between the two tasks as the target-distractor separation increased. Here saccade latency was expressed as the relative difference between the median saccade latency at a 15° separation across both tasks per subject, with the data showing the mean differences with SE. The shaded region indicates the 95% confidence intervals for a linear fit. B: the median saccade latency for each of the subjects (SUB 1−8) on both tasks. Here a strong correlation between the times in both tasks is evident, demonstrating that the time to initiate their saccade is closely related in both tasks. Additionally, the trend for larger separations to have slower saccade latency is evident within individual subjects’ data, with the distance from the origin increasing as target-distractor separation increases.
Fig. 4.
Fig. 4.
Histograms of landing position for different target-distractor separations. Distributions of the average landing position across participants for the STT (A) and STM (B) task are shown. Note that the goal location in the STT task was the target location (red), while the goal location for the STM task was the intermediate location (green). From the histograms above, it can clearly be seen that the simple change of task goal resulted in substantially different distributions for all of the different target-distractor separations, with the effects most noticeable at larger separations. The purple line indicates the average full model fit to the collapsed data for each subject.
Fig. 5.
Fig. 5.
The AICc of the different model fits and the weights of the best model for different target-distractor separations in the STT and STM tasks. For both the STT (A) and STM (C) task, the full model, which included a target, distractor, and intermediate component, was always the best fit to the data (with the lowest change in AICc for each separation indicated by the thick bar beneath). The weights for the best fitting full model for both STT (B) and STM (D) are also shown.
Fig. 6.
Fig. 6.
The change in AICc across target-distractor separations, task, and experiments as a function of saccade latency. The average AICc for the different models across participants for experiment 1 (EXP 1; A and C) and experiment 2 (EXP 2; B and D) as a function of saccade latency for the STT and STM task is shown. While the green line indicates the full model, the yellow and purple lines indicate the ΔAICc of stimulus-capture-only and global-effect-only models relative to the full model, respectively. In experiment 1, the full model almost always fits the data better than either of the alternative simpler models. Indeed, as the panel collapsed across separations shows, when considering all target-distractor separations, the full model was always the best model (with the small square indicating the average ΔAICc collapsed across separations and saccade latency). This pattern is true also for the data of experiment 2. Here the data collapsed across contrast is presented, and, while the plots are substantially smoother due to the increased number of trials, they match very closely with the data found in experiment 1.
Fig. 7.
Fig. 7.
Histograms of landing position for different target-distractor separations. The mean weights for the target (red), distractor (blue), and intermediate (green) model components across participants are shown for each of the different target-distractor separations (columns) and for both STT (A) and STM (B) tasks. As the latency distributions for individuals varied significantly, above each set of weights is the proportion of participants with sufficient data for inclusion in the average at that time point. Averages of <50% of the participants are not shown. The weights for each of the different contrasts examined in experiment 2 are shown in C and D for STT and STM, whereas the weights collapsed across contrast are shown in E and F, respectively. Importantly, although 8 new participants were examined, the data for experiment 2 closely match the equivalent separations in experiment 1.
Fig. 8.
Fig. 8.
Automatic and intentional capture effects in time for different target-distractor separations. By comparing the STT and STM task for each of the different target-distractor separations, we could generate estimates for the proportion of saccades unavoidably captured toward either the location of stimuli or the global effect location and those that were intentionally directed toward the task goal for both experiment 1 (A) and experiment 2 (B). This reveals how the proportion of saccades dedicated to different locations changes with the delay before movement onset.
Fig. 9.
Fig. 9.
Saccade latency for 30° and 60° stimulus separation and the influence of stimulus contrast. A: the relative differences in saccade latency as stimulus contrast increased for both the STT (red) and STM (green) task for either 30° (left) or 60° (right) separation between stimuli. As contrast increased, there was a reduction in the latency of saccades in both tasks, with the reduction occurring slightly more rapidly in the STM task when stimuli were 30° separated. B: each participant’s saccade latency for each contrast level (1 = lowest, 5 = highest) on both the STT and STM task are plotted. Almost all participants show a steady decrease in saccade latency as contrast increases, while the overall latencies for 30° are visibly faster than for 60° (as was found in experiment 1).

References

    1. Aitsebaomo AP, Bedell HE. Saccadic and psychophysical discrimination of double targets. Optom Vis Sci 77: 321–330, 2000. doi:10.1097/00006324-200006000-00012. - DOI - PubMed
    1. Arai K, McPeek RM, Keller EL. Properties of saccadic responses in monkey when multiple competing visual stimuli are present. J Neurophysiol 91: 890–900, 2004. doi:10.1152/jn.00818.2003. - DOI - PubMed
    1. Bacon WF, Egeth HE. Overriding stimulus-driven attentional capture. Percept Psychophys 55: 485–496, 1994. doi:10.3758/BF03205306. - DOI - PubMed
    1. Bompas A, Sumner P. Saccadic inhibition reveals the timing of automatic and voluntary signals in the human brain. J Neurosci 31: 12501–12512, 2011. doi:10.1523/JNEUROSCI.2234-11.2011. - DOI - PMC - PubMed
    1. Boot WR, Kramer AF, Peterson MS. Oculomotor consequences of abrupt object onsets and offsets: onsets dominate oculomotor capture. Percept Psychophys 67: 910–928, 2005. doi:10.3758/BF03193543. - DOI - PubMed

Publication types

LinkOut - more resources