. 2017 Jul 15;28(15):2076-2090.
doi: 10.1091/mbc.E17-03-0184. Epub 2017 May 24.

Transmembrane helix hydrophobicity is an energetic barrier during the retrotranslocation of integral membrane ERAD substrates

Affiliations

Transmembrane helix hydrophobicity is an energetic barrier during the retrotranslocation of integral membrane ERAD substrates

Christopher J Guerriero et al. Mol Biol Cell. .

Abstract

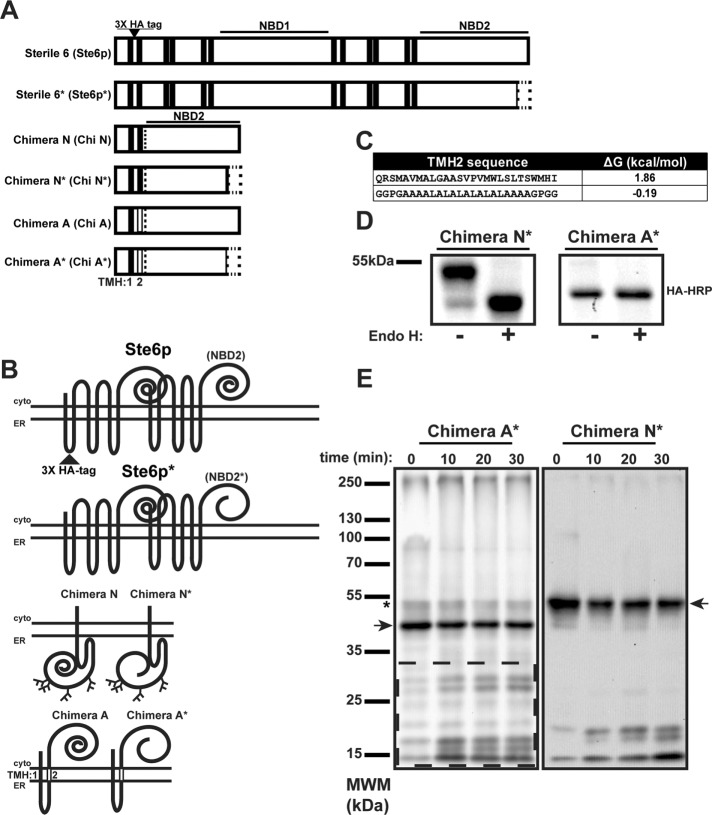
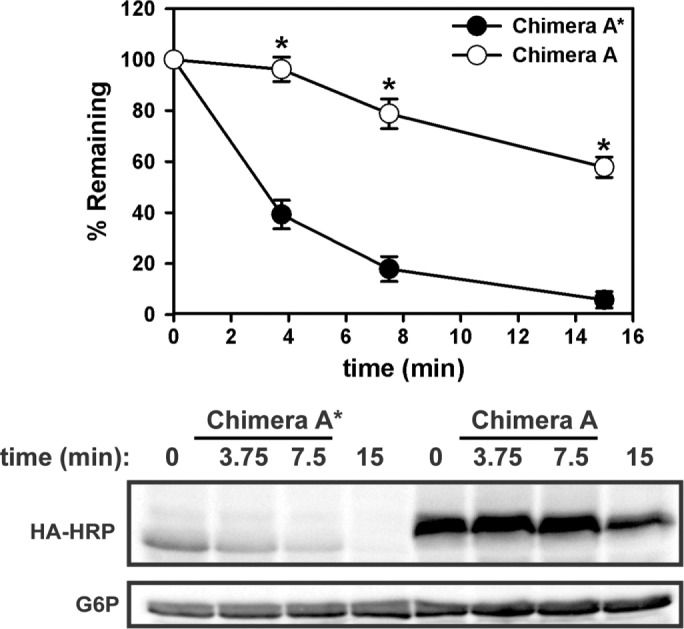
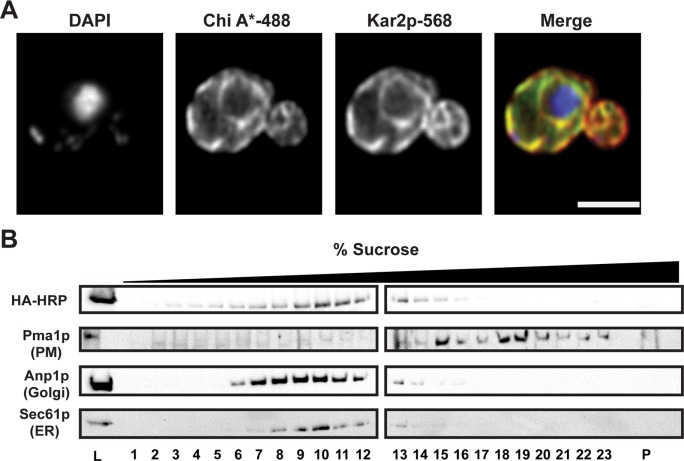
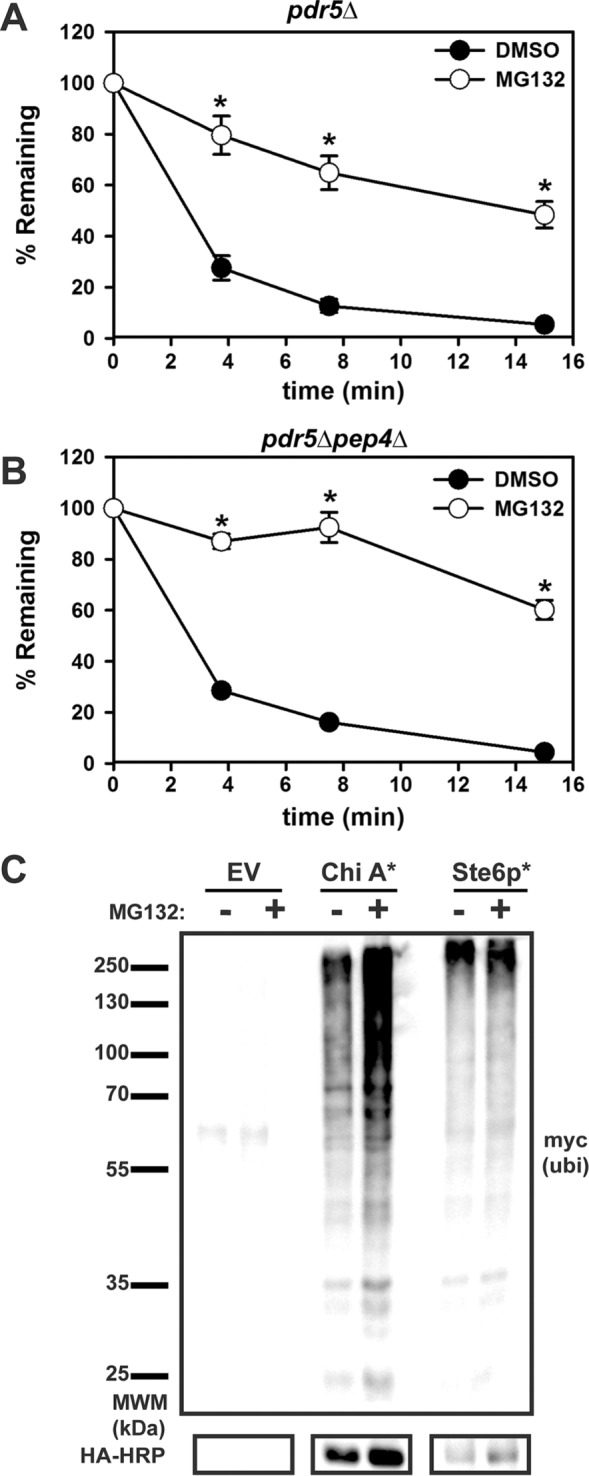
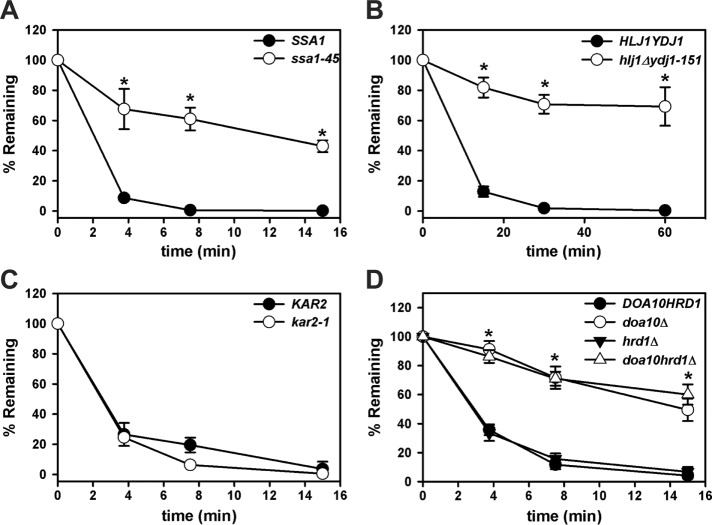
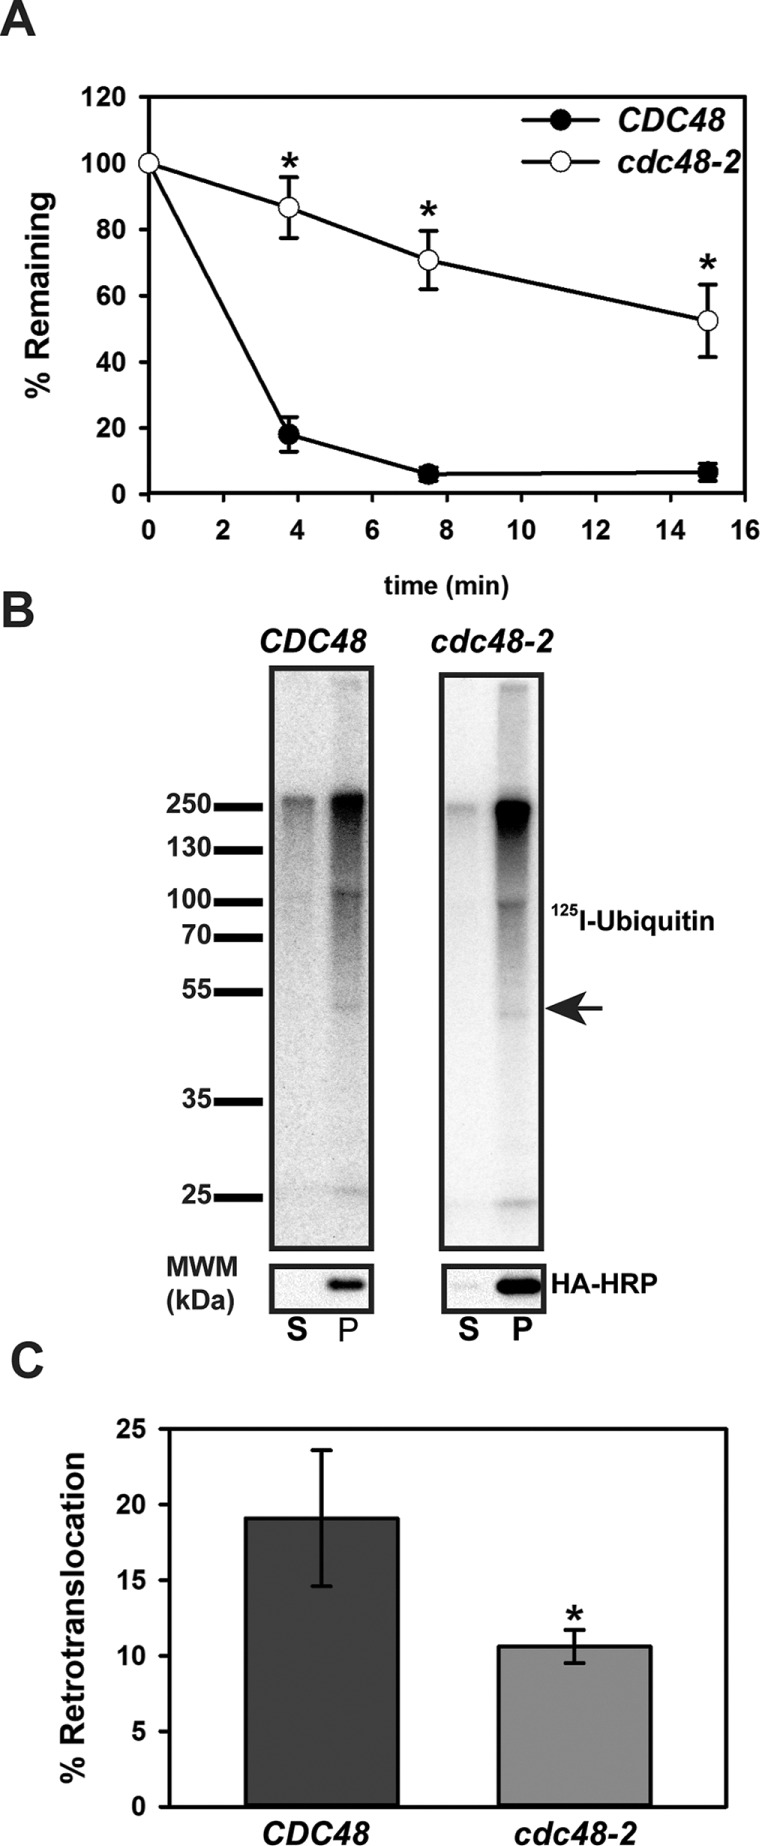
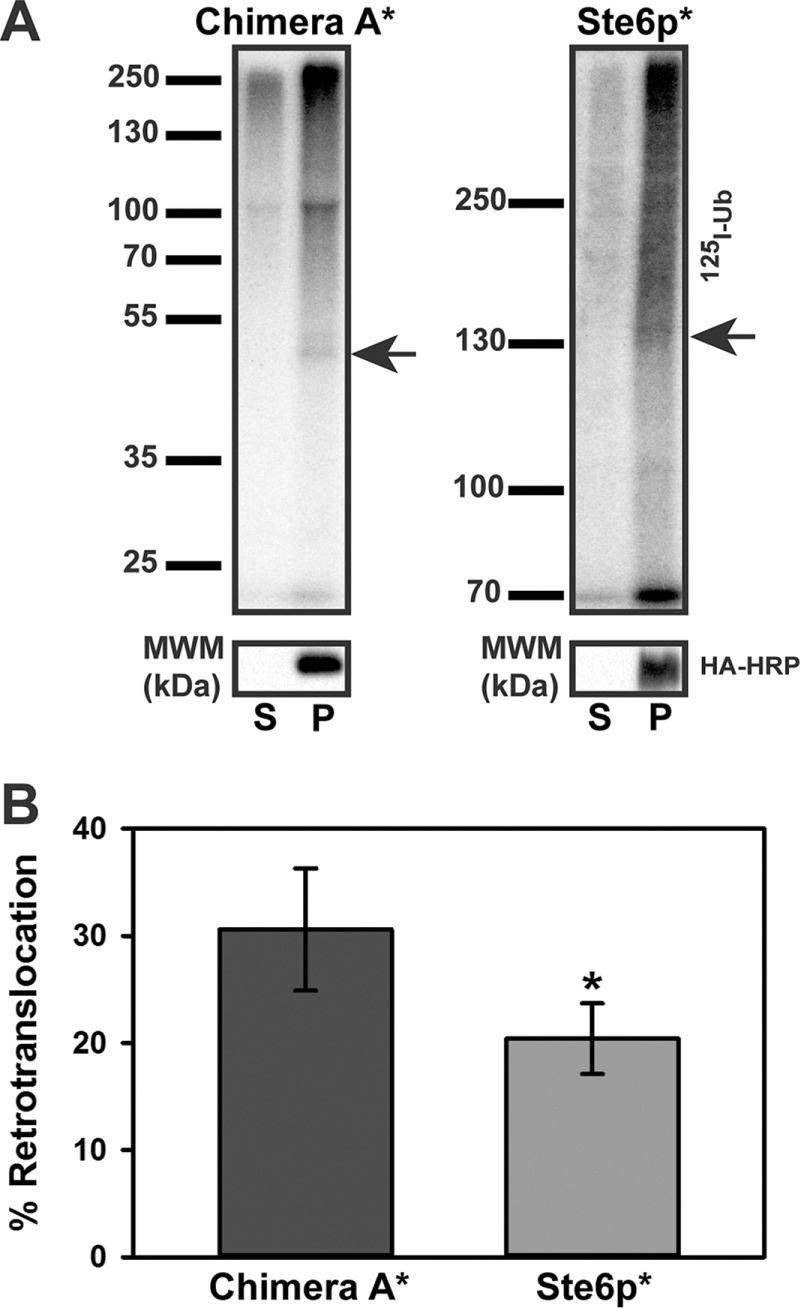
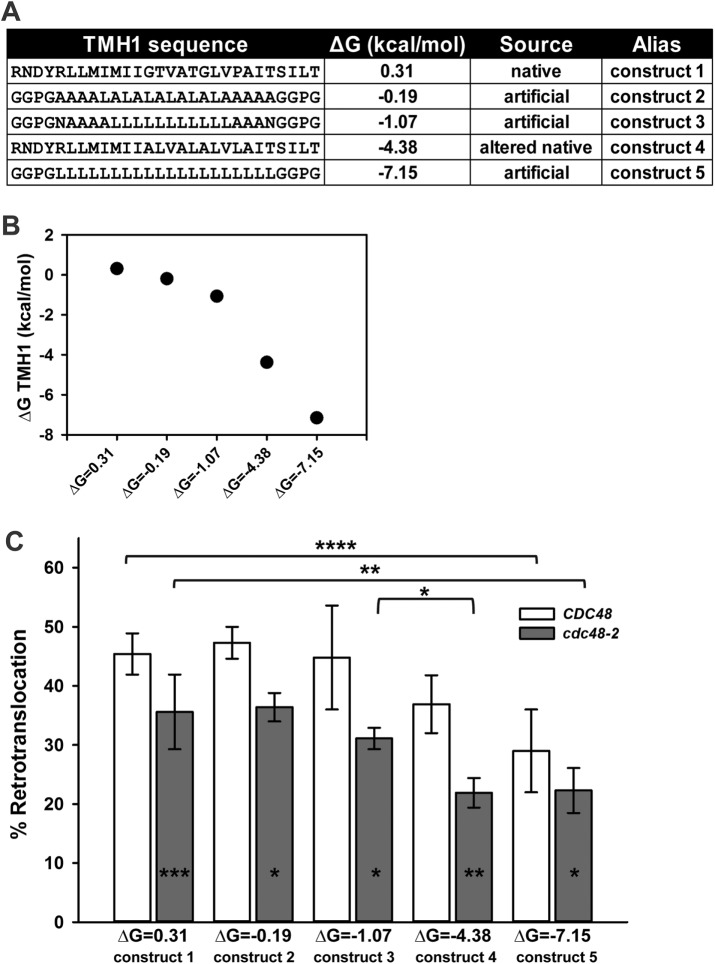
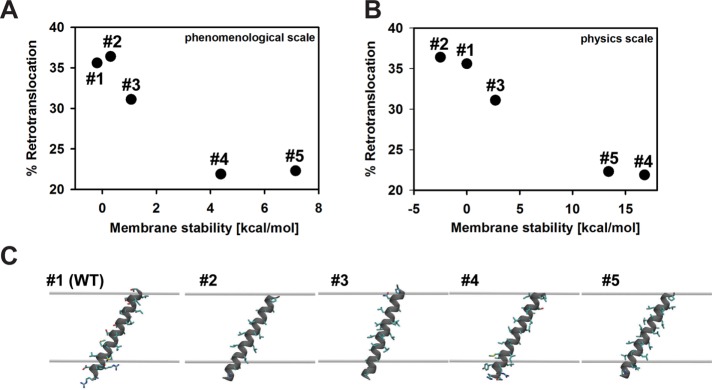
Integral membrane proteins fold inefficiently and are susceptible to turnover via the endoplasmic reticulum-associated degradation (ERAD) pathway. During ERAD, misfolded proteins are recognized by molecular chaperones, polyubiquitinated, and retrotranslocated to the cytoplasm for proteasomal degradation. Although many aspects of this pathway are defined, how transmembrane helices (TMHs) are removed from the membrane and into the cytoplasm before degradation is poorly understood. In this study, we asked whether the hydrophobic character of a TMH acts as an energetic barrier to retrotranslocation. To this end, we designed a dual-pass model ERAD substrate, Chimera A*, which contains the cytoplasmic misfolded domain from a characterized ERAD substrate, Sterile 6* (Ste6p*). We found that the degradation requirements for Chimera A* and Ste6p* are similar, but Chimera A* was retrotranslocated more efficiently than Ste6p* in an in vitro assay in which retrotranslocation can be quantified. We then constructed a series of Chimera A* variants containing synthetic TMHs with a range of ΔG values for membrane insertion. TMH hydrophobicity correlated inversely with retrotranslocation efficiency, and in all cases, retrotranslocation remained Cdc48p dependent. These findings provide insight into the energetic restrictions on the retrotranslocation reaction, as well as a new computational approach to predict retrotranslocation efficiency.


Figures

FIGURE 1:
FIGURE 1:
Generation of a dual-pass integral membrane ERAD substrate. (A) Linear diagrams of Sterile 6 (Ste6p), Sterile 6p*, and associated substrates. Ste6p is a yeast ABC transporter containing 12 TMHs (black bars) and cytoplasmic NBD1 and NBD2. Truncation of Ste6p’s NBD2 is depicted as an empty rectangle, which results in Ste6p*. Chimera N and Chimera N* are composed of the first two TMHs of Ste6p fused to either full-length or truncated NBD2 (dotted line). Chimera A and Chimera A* contain a nonnative TMH2 (vertical open bar). All constructs contain a triple-HA tag in the ER lumenal loop between TMH1 and 2. (B) Topologies of the constructs in A, with the lumenal HA tag indicated in Ste6p, which was present in all constructs, and the nonnative TMH2 in Chimera A (open rectangle). (C) Sequence of TMH2 for Chimera N* and Chimera A* given next to the predicted ΔG (kcal/mol) for membrane insertion as reported by dgpred.cbr.su.se. (D) S. cerevisiae expressing Chimera N* and Chimera A* were grown to log phase, and cellular protein was extracted by alkaline lysis, precipitated, resuspended, and incubated in the presence or absence of Endo H. Chimeras were detected after SDS–PAGE and immunoblotting. (E) ER-derived microsomes were generated from S. cerevisiae transformed with a Chimera N* or A* expression vector under the control of the PGK promoter. Microsomes were subjected to limited proteolysis with proteinase K on ice for the indicated times. Reactions were quenched and proteins were detected as described in D. Dashed box, Chimera A*-derived proteolytic products. Full-length proteins are denoted by an arrow. Asterisk denotes a small population of Chimera A* that is synthesized with NBD2* in the ER lumen, as observed for the majority of Chimera N*.
FIGURE 2:
FIGURE 2:
The dual-pass transmembrane-tethered substrate Chimera A* is rapidly degraded. Yeast expressing Chimera A (full-length NBD2; open circles) and Chimera A* (NBD2*; filled circles) under the control of the ADH promoter were grown to log phase and assayed by cycloheximide chase for the indicated times at 26°C. Proteins were extracted and detected as described in Materials and Methods. Representative blots are shown below the graph, and glucose-6-phosphate dehydrogenase (G6P) serves as loading control. Data represent means ± SE from three independent experiments. *p < 0.0000005 as determined by Student’s t test.
FIGURE 3:
FIGURE 3:
Chimera A* resides in the ER. (A) Chimera A* localization was determined by indirect immunofluorescence confocal microscopy using mouse anti-HA (Chimera A*), rabbit anti-Kar2p (ER lumen), and DAPI to stain the nuclei. Primary antibodies were labeled with Alexa goat anti-mouse 488 and goat anti-rabbit 568, respectively; scale bar, ∼5 μm. (B) Yeast lysates from Chimera A*–expressing cells were subject to sucrose gradient centrifugation, fractions were collected from the top (low sucrose) to the bottom (high sucrose), and an aliquot of fraction each was analyzed by SDS–PAGE and immunoblot analysis for Sec61p (ER marker), Anp1p (Golgi marker), Pma1p (plasma membrane marker), and Chimera A* (HA-HRP). Lanes containing 0.5% of the total protein loaded (L, on the left) and the pelleted material from the bottom of the gradient tube (P, on the right) were included.
FIGURE 4:
FIGURE 4:
Chimera A* degradation is proteasome-dependent. (A) Chimera A* was expressed under the control of the ADH promoter in (A) pdr5Δ or (B) pdr5Δ pep4Δ yeast. Before the cycloheximide chase analysis, cells were preincubated with DMSO (control; filled circles) or 100 μM MG132 (proteasome inhibitor; open circles) for 20 min and then chased for the indicated times. Graphed data represent the means ± SE from three independent experiments. *p < 0.00003. (C) pdr5Δ cells were transformed with an empty vector or Chimera A* or Ste6p* expression vectors under the control of the PGK promoter, as well as a plasmid for the Cu2+-inducible expression of myc-tagged ubiquitin. Cells were treated for 90 min with DMSO (–) or 50 μM MG132 (+) and then lysed. Total protein was immunoprecipitated with HA-conjugated agarose beads, followed by SDS–PAGE and immunoblot analysis for myc-tagged ubiquitin and the HA tag.
FIGURE 5:
FIGURE 5:
Chimera A* degradation requires cytosolic chaperones and the E3 ubiquitin ligase, Doa10p. Cycloheximide chase analyses were performed as described in Materials and Methods to measure the turnover of Chimera A* in (A) SSA1 and ssa1-45, (B) HLJ1YDJ1 and hlj1Δydj1-151, (C) KAR2 and kar2-1, and (D) DOA10, doa10Δ, hrd1Δ, and doa10Δhrd1Δ at 37°C (A, B) or at 26°C (C, D). Chimera A* was expressed under the control of the ADH promoter (A, C, D) or the PGK promoter (B). Data represent the means ± SE for at least three independent experiments. *p < 0.0007 for ssa1-45, p < 0.02 for hlj1Δydj1-151, and p < 0.0006 for doa10Δ and doa10Δhrd1Δ compared with the isogenic wild-type strains.
FIGURE 6:
FIGURE 6:
Chimera A* degradation and retrotranslocation require the AAA+ ATPase Cdc48p. (A) Cycloheximide chase analyses were performed as described in Materials and Methods for BY4742 (CDC48, wild type) and cdc48-2 yeast expressing Chimera A* under the control of the ADH promoter. To inactivate cdc48-2, strains were subjected to a 2-h temperature shift to 39°C. Data represent the means ± SE for two independent experiments, *p < 0.04. (B) Microsomes were prepared by glass bead disruption of CDC48 or cdc48-2 yeast expressing Chimera A* under the control of the PGK promoter, which were temperature shifted for 2 h at 39°C. Microsomes were ubiquitinated in vitro with 125-labeled ubiquitin for 40 min using cytosol prepared from CDC48 or cdc48-2 yeast, which was also temperature shifted for 2 h at 39°C. After the reaction, retrotranslocated material (supernatant, S) was separated from membrane-integrated material (pellet, P) by centrifugation before analysis by immunoprecipitation, SDS–PAGE, and autoradiography (top). Half of the material was analyzed separately by immunoblot analysis with anti–HA-HRP (bottom). Arrow indicates the relative migration of Chimera A*. (C) Percent retrotranslocation was determined by comparing the percentage of the radioactive signal in the supernatant (S) divided by the total (S + P) × 100. The data represent the means ± SD from two independent experiments performed in triplicate. *p < 0.0003.
FIGURE 7:
FIGURE 7:
Chimera A* is more efficiently retrotranslocated than Ste6p*. (A) Microsomes prepared from CDC48 yeast expressing Chimera A* or Ste6p* under the control of the PGK promoter grown at 26°C were subjected to an in vitro ubiquitination reaction for 40 min using cytosol prepared from CDC48 yeast grown at 26°C. Samples were processed as described in Figure 6. Representative autoradiographs (top) and corresponding anti–HA-HRP blots (bottom). Arrows indicate the relative migrations of Chimera A* and Ste6p*. (B) The percentage retrotranslocation, calculated as described in the legend to Figure 6, represents the means ± SD from four independent experiments performed in triplicate. *p < 0.03.
FIGURE 8:
FIGURE 8:
Retrotranslocation efficiency correlates inversely with transmembrane hydrophobicity. (A) Chimera A* variants were designed to harbor increasingly hydrophobic TMH1 sequences. Predicted ΔG for membrane residence is indicated next to each TMH1 sequence, as determined by dg.pred.cbr.su.se. (B) Calculated TMH1 ΔG (kcal/mol), as described in Materials and Methods. (C) Microsomes were prepared from CDC48 yeast expressing each chimera variant under the control of the PGK promoter, and retrotranslocation was measured in the presence of CDC48 cytosol (open bars) or using temperature-shifted cdc48-2 cytosol (gray bars). Percentage retrotranslocation, calculated as described in Figure 6, is shown. Data represent the means ± SD from least two independent experiments performed in triplicate. *p < 0.03, **p < 0.003, ***p < 0.0004, ****p < 0.00002.
FIGURE 9:
FIGURE 9:
Retrotranslocation efficiency is more accurately predicted by a physics-based model. Retrotranslocation extent vs. predicted TMH stabilities for the phenomenological insertion energy scale (A) and a physics-based continuum model of protein insertion (B). Energy values in B are reported relative to the wild-type segment (the absolute stability of construct 1 is −48.6 kcal/mol). (C) Optimal orientation of TMH segments in the membrane based on the physics-based model. The upper and lower gray surfaces are the interface of the hydrophobic membrane core with the head-group region. Helices adopt a 20–30° angle with respect to the membrane normal in order to maximize burial of hydrophobic residues in the membrane core.

Similar articles

Cited by

References

    1. Adams A, Gottschling DE, Kaiser CA, Stearns T. Methods in Yeast Genetics. Cold Spring Harbor, NY: Cold Spring Harbor Laboratory Press; 1997.
    1. Aller SG, Yu J, Ward A, Weng Y, Chittaboina S, Zhuo R, Harrell PM, Trinh YT, Zhang Q, Urbatsch IL, Chang G. Structure of P-glycoprotein reveals a molecular basis for poly-specific drug binding. Science. 2009;323:1718–1722. - PMC - PubMed
    1. Amberg DC, Burke D, Strathern JN, Cold Spring Harbor Laboratory . Methods in Yeast Genetics: A Cold Spring Harbor Laboratory Course Manual. Cold Spring Harbor, NY: Cold Spring Harbor Laboratory Press; 2005.
    1. Argudo D, Bethel NP, Marcoline FV, Grabe M. Continuum descriptions of membranes and their interaction with proteins: towards chemically accurate models. Biochim Biophys Acta. 2016;1858:1619–1634. - PMC - PubMed
    1. Baeza-Delgado C, Marti-Renom MA, Mingarro I. Structure-based statistical analysis of transmembrane helices. Eur Biophys J. 2013;42:199–207. - PubMed

MeSH terms

LinkOut - more resources