. 2017 Nov 7;28(23):3203-3214.
doi: 10.1091/mbc.E16-07-0522. Epub 2017 May 24.

Analysis of interphase node proteins in fission yeast by quantitative and superresolution fluorescence microscopy

Affiliations

Analysis of interphase node proteins in fission yeast by quantitative and superresolution fluorescence microscopy

Matthew Akamatsu et al. Mol Biol Cell. .

Abstract

We used quantitative confocal microscopy and FPALM superresolution microscopy of live fission yeast to investigate the structures and assembly of two types of interphase nodes-multiprotein complexes associated with the plasma membrane that merge together and mature into the precursors of the cytokinetic contractile ring. During the long G2 phase of the cell cycle, seven different interphase node proteins maintain constant concentrations as they accumulate in proportion to cell volume. During mitosis, the total numbers of type 1 node proteins (cell cycle kinases Cdr1p, Cdr2p, Wee1p, and anillin Mid1p) are constant even when the nodes disassemble. Quantitative measurements provide strong evidence that both types of nodes have defined sizes and numbers of constituent proteins, as observed for cytokinesis nodes. Type 1 nodes assemble in two phases-a burst at the end of mitosis, followed by steady increase during interphase to double the initial number. Type 2 nodes containing Blt1p, Rho-GEF Gef2p, and kinesin Klp8p remain intact throughout the cell cycle and are constituents of the contractile ring. They are released from the contractile ring as it disassembles and then associate with type 1 nodes around the equator of the cell during interphase.


Figures

FIGURE 1:
FIGURE 1:
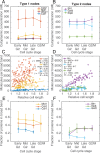
Global and local numbers of molecules of interphase node proteins over the cell cycle measured by quantitative fluorescence microscopy (see Materials and Methods). Values in A, B, E, and F are means ± SD. (A, B) Concentrations of (A) type 1 and (B) type 2 interphase node proteins over the cell cycle. Cells were classified into interphase stages by cell length. (C, D) Numbers of molecules in the broad band of nodes over the cell cycle for (C) type 1 and (D) type 2 interphase node proteins. The x-axis (relative cell length) is defined as the cell length scaled relative to the smallest (1) and largest (2) cell in the population. Extrapolation of linear fits to x = 1 give the average number of molecules at the cell equator at cell birth. Cells expressing Cdr1p-3GFP were shorter than wild-type cells (Martin and Berthelot-Grosjean, 2009; Moseley et al., 2009) and so their lengths were scaled independently. (E, F) Fractions of each interphase node protein in the broad band of nodes over the cell cycle for (E) type 1 and (F) type 2 nodes. Cells were classified into interphase stages by cell length.
FIGURE 2:
FIGURE 2:
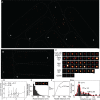
Fluorescence intensities of individual type 1 and 2 interphase nodes. (A) Field of cells expressing Cdr2p-mEGFP. Reverse contrast fluorescence micrograph of a sum projection of five slices closest to the coverslip. Red circles are node regions selected for fluorescence measurements (see Materials and Methods). Black lines outline cells. Scale bar, 1 µm. (B–H) Histograms of fluorescence intensity per node. The continuous curves are fits of multiple Gaussian distributions to the data. Peak values are means ± SD from the fits. Shaded regions on the left of each graph is background fluorescence intensity plus 1 SD. (B) n = 138 spots in 33 cells; (C) 23 spots in 4 cells; (D) 72 spots in 20 cells; (E) 23 spots in 11 cells; (F) 68 spots in 18 cells; (G) 58 spots in 17 cells; and (H) 177 spots in 29 cells.
FIGURE 3:
FIGURE 3:
High-speed FPALM of cells expressing Cdr2p-mEOS3.2. (A, B) Gaussian kernel density heat maps in focal planes partway between a medial longitudinal section and the cell surface, which captures nodes near the surface. Cells are labeled a–i in the order of cell cycle stage based on length and the presence of a septum: a, b, cells with septa; c, d, early G2; e, f, mid G2; g, late G2; h, G2/M; and i, mitosis. White lines mark cell perimeters. Bar, 400 nm. (C) Individual nodes of cells marked in A and B with lower contrast. See Materials and Methods for details on cell classification. Dashed white lines separate nodes from different cells. Bar, 100 nm. (D) Surface densities of interphase nodes in a zone 1.6 µm wide centered on the equator across the cell cycle. Densities were determined by Voronoi tessellation (see Supplemental Figure S6). The sample was 122 nodes in 11 cells in three fields. Line is a linear fit. (E, F) Analysis of the spatial distribution of Cdr2p-mEOS3.2 in face views of nodes with <55 detections (approximately the n = 1 peak in G). (E) Histograms of the radial density distribution of mEOS3.2 detections from the center of each node. Inset, Gaussian kernel density heat maps of detections in individual nodes (face views). Bar, 100 nm. (F) Cumulative distribution plots of radial density of detections in nodes marked by Cdr2p-mEOS3.2. The 75th percentile of detection radial distances is reported. CDF, cumulative distribution function. (G) Histogram of the numbers of FPALM detections per node for face view of Cdr2p-mEOS3.2 nodes. The continuous curves are fits of multiple Gaussian distributions to the data with the peak numbers of detections indicated. Values reported are means ± SD from the fits. n = 92 spots.
FIGURE 4:
FIGURE 4:
High-speed FPALM of cells expressing Blt1p-mEOS3.2. A, B, E, and F are displayed as Gaussian kernel time-colored maps according to the times when detections occurred during acquisition. Dotted white lines mark cell perimeters and sites of division. (A) Nodes in cells with contractile rings but no septum. (B) Nodes in cells with septa. Bar, 400 nm. (C) Line scan of two nodes marked in the bottom of B. Intensity values (proportional to density of detections) were averaged across the 20-pixel width of the line. (D) Local surface densities of interphase nodes in a zone 1.6 µm wide centered on the equator across the cell cycle from a sample of 472 nodes in 13 cells in two fields. Line is a linear fit. (E) Image of six interphase cells marked with cell cycle stage. Bar, 400 nm. (F) Images of individual nodes from A, B, and E arranged by cell cycle stage and location at cell equators or cell tips. Dashed white lines separate nodes from different cells. Bar, 100 nm. (G, H) Analysis of the spatial distribution of Blt1p-mEOS3.2 in face views of nodes with <50 detections (approximately the n = 1 peak in I). (G) Histograms of the radial density distribution of detections from the center of each node. Inset, Gaussian kernel density heat maps of detections in individual nodes (face views). Bar, 100 nm. (H) Cumulative distribution plots of the radial density of detections in nodes marked by Blt1p-mEOS3.2. CDF, cumulative distribution function. The 75th percentile of detection radial distances is reported. (I) Histogram of the numbers of FPALM detections per node for face views of nodes. The continuous curves are fits of multiple Gaussian distributions to the data with the peak numbers of detections indicated. Values reported are means ± SD from the fits. n = 125 spots.

References

    1. Akamatsu M, Berro J, Pu K-M, Tebbs IR, Pollard TD. Cytokinetic nodes in fission yeast arise from two distinct types of nodes that merge during interphase. J Cell Biol. 2014;204:977–988. - PMC - PubMed
    1. Almonacid M, Moseley JB, Janvore J, Mayeux A, Fraisier V, Nurse P, Paoletti A. Spatial control of cytokinesis by Cdr2 kinase and Mid1/anillin nuclear export. Curr Biol. 2009;19:961–966. - PubMed
    1. Bähler J, Wu JQ, Longtine MS, Shah NG, McKenzie A, Steever AB, Wach A, Philippsen P, Pringle JR. Heterologous modules for efficient and versatile PCR-based gene targeting in Schizosaccharomyces pombe. Yeast. 1998;14:943–951. - PubMed
    1. Baumgärtner S, Tolic-Nørrelykke IM. Growth pattern of single fission yeast cells is bilinear and depends on temperature and DNA synthesis. Biophys J. 2009;96:4336–4347. - PMC - PubMed
    1. Berro J, Pollard TD. Local and global analysis of endocytic patch dynamics in fission yeast using a new “temporal superresolution” realignment method. Mol Biol Cell. 2014;25:3501–3514. - PMC - PubMed

LinkOut - more resources