. 2017 Jun 21;37(25):6113-6124.
doi: 10.1523/JNEUROSCI.0584-17.2017. Epub 2017 May 24.

Microglia Are Irrelevant for Neuronal Degeneration and Axon Regeneration after Acute Injury

Affiliations

Microglia Are Irrelevant for Neuronal Degeneration and Axon Regeneration after Acute Injury

Alexander M Hilla et al. J Neurosci. .

Abstract

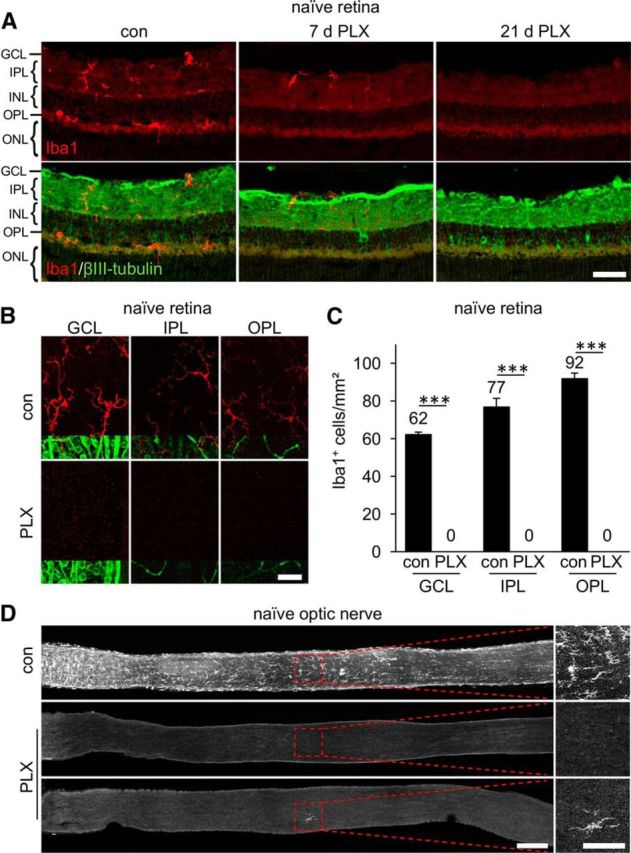
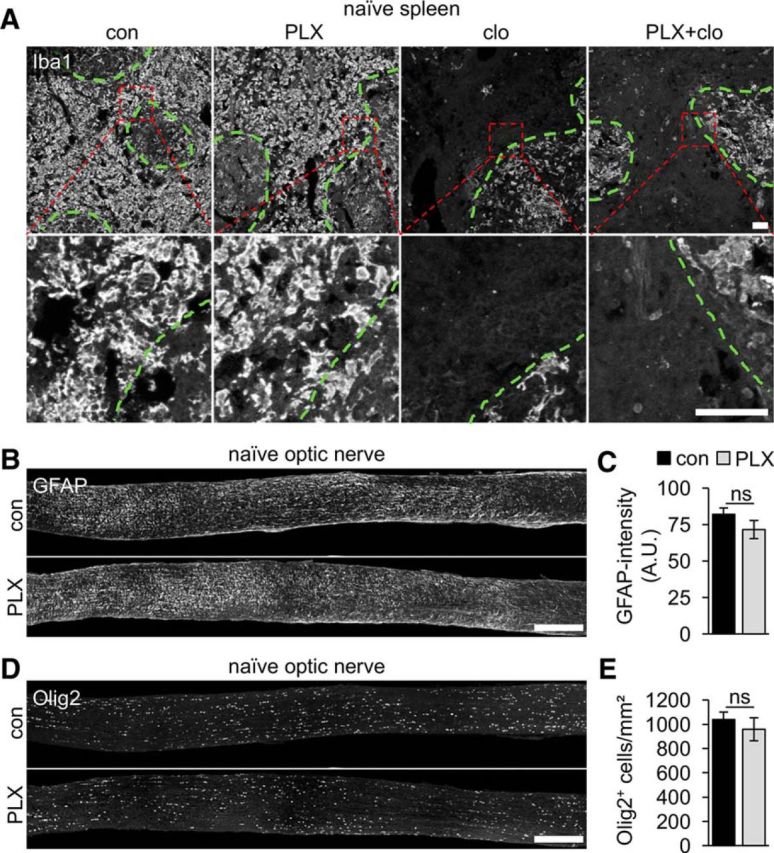
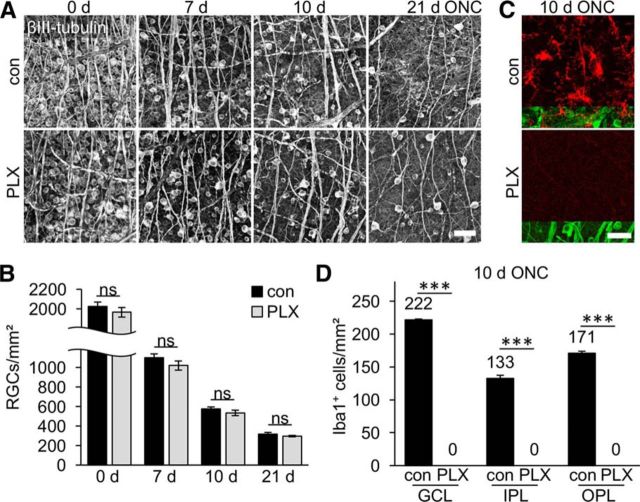
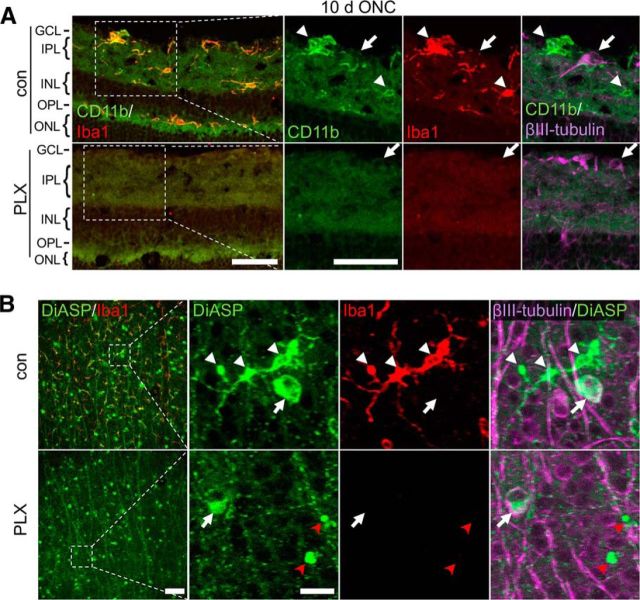
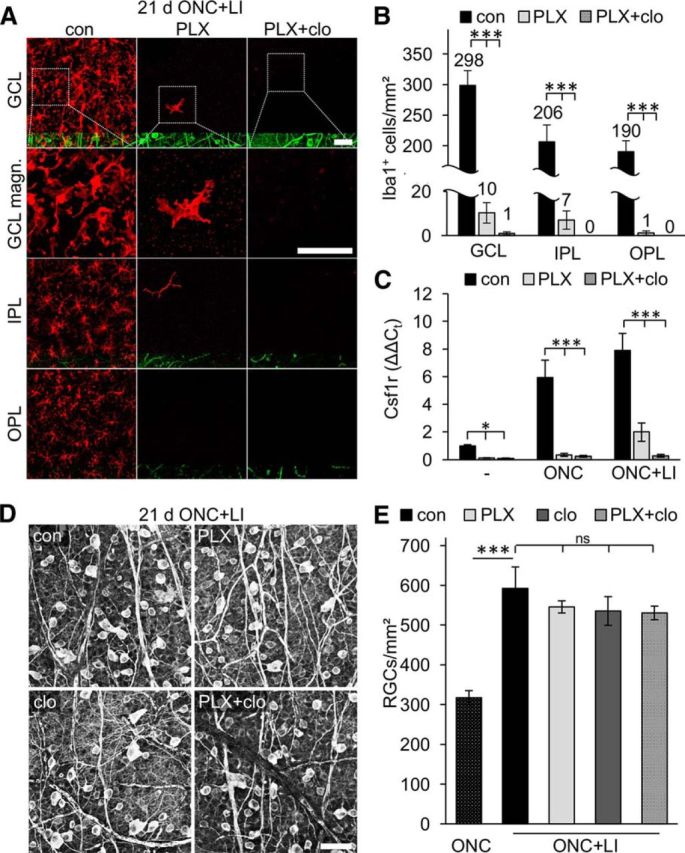
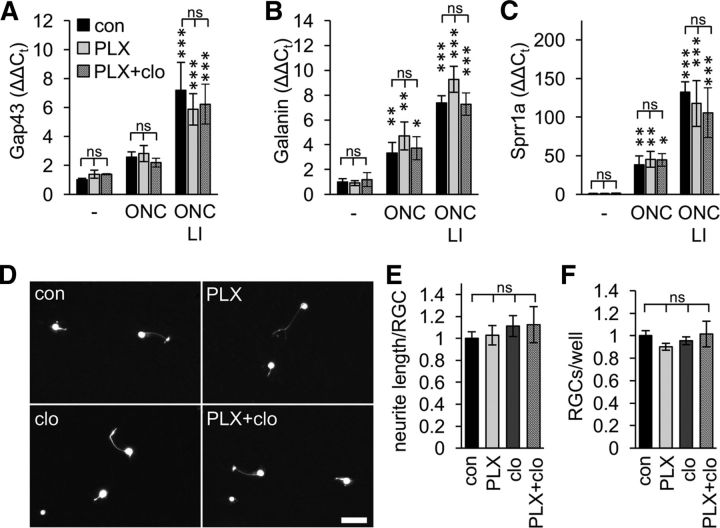
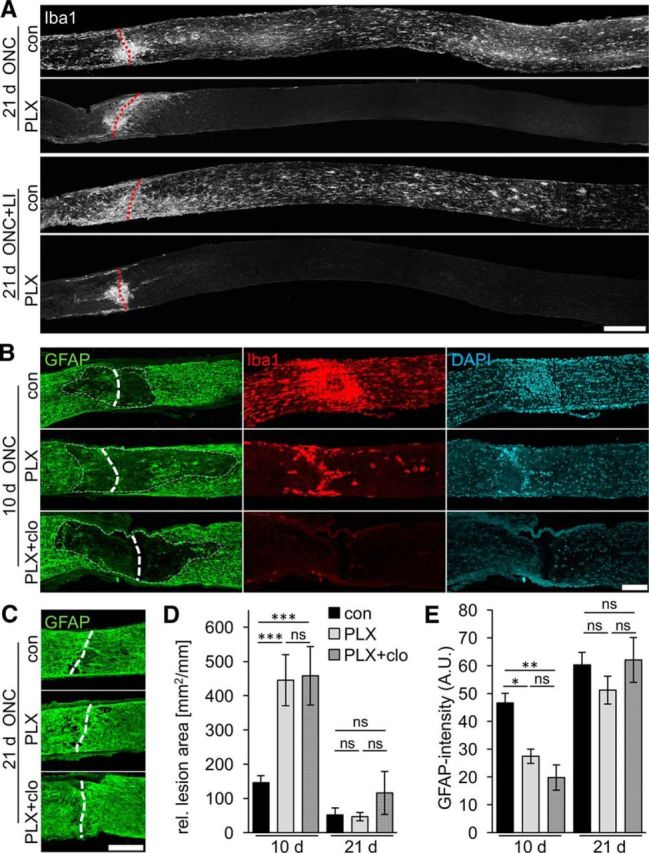
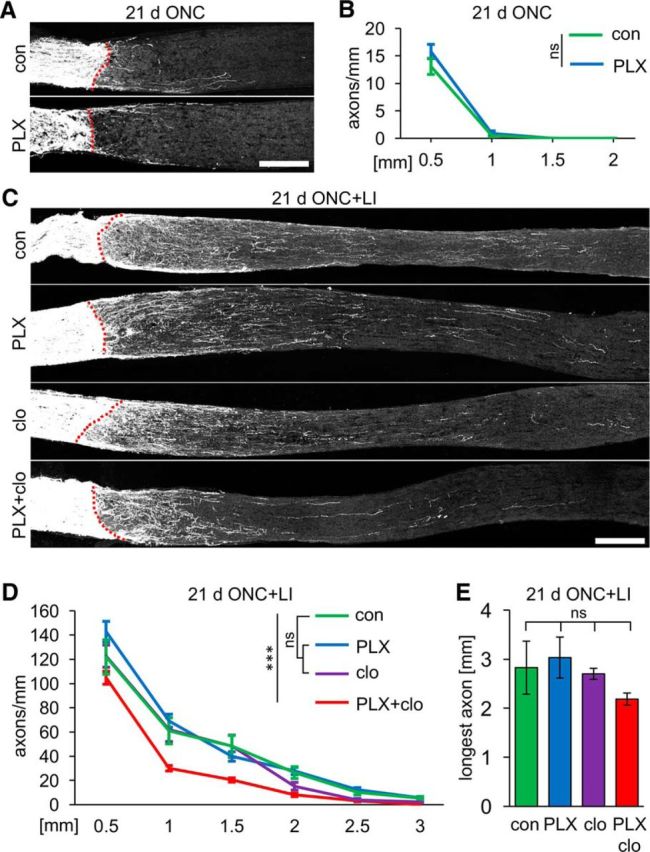
The role of microglia in degenerative and regenerative processes after damage of the nervous system remains ambiguous, partially due to the paucity of appropriate investigative methods. Here, we show that treatment with the pharmacological colony stimulating factor 1 receptor inhibitor PLX5622 specifically eliminated microglia in murine retinae and optic nerves with high efficiency. Interestingly, time course and extent of retinal ganglion cell (RGC) degeneration after optic nerve crush remained unaffected upon microglia depletion, although remnants of prelabeled apoptotic RGCs were not cleared from the retina in these animals. In addition, microglia depletion neither affected the induction of regeneration associated genes upon optic nerve injury nor the increased regenerative potential of RGCs upon lens injury (LI). However, although the repopulation of the optic nerve lesion site by astrocytes was significantly delayed upon microglia depletion, spontaneous and LI-induced axon regeneration were unaffected by PLX5622 treatment or peripheral macrophage depletion by clodronate liposome treatment. Only concurrent double depletion of microglia and infiltrated macrophages slightly, but significantly, compromised optic nerve regeneration. Therefore, microglia are not essentially involved in RGC degeneration or axonal regeneration after acute CNS injury.SIGNIFICANCE STATEMENT The roles of microglia, the phagocytosing cells of the CNS, and invading macrophages in degenerative and regenerative processes after injury are still controversial and insufficiently characterized. Here, we show that application of a CSF1R inhibitor eliminated virtually all microglia from the visual system, whereas macrophages were spared. Specific microglia depletion impaired the removal of dead labeled retinal ganglion cells after optic nerve crush, but remarkable had no influence on their degeneration. Similarly, optic nerve regeneration was completely unaffected, although repopulation of the lesion site by astrocytes was delayed significantly. Therefore, contrary to previous reports, this experimental approach revealed that microglia seemingly neither promote nor inhibit neuronal degeneration or axonal regrowth within the injured visual system.

Keywords: apoptosis; axon regeneration; lens injury; microglia; neuroprotection; optic nerve; retina.


Figures

Figure 1.
Figure 1.
Depletion of microglia in retinae and optic nerves of naive mice via pharmacologic inhibition of CSF1R. A, Iba1-positive cells (red) were identified in the GCL, the IPL, and the OPL on retinal cross-sections of untreated control mice (con). After 7 d on a constant PLX5622 diet (PLX), fewer stained cells were detected, whereas no positive signal was observed after 21 d. For spatial orientation, immunostaining of βIII-tubulin (green) was used to label RGCs and their axons in the GCL, whereas RGC dendrites were detected in the IPL. INL, Inner nuclear layer; ONL, outer nuclear layer. Scale bar, 25 μm. B, Representative confocal pictures of flat-mounted mouse retinae showing Iba1-positive ramified microglia (red) in the GCL, IPL, and OPL of naive retinae. Coimmunostaining for βIII-tubulin (green) was used to detect RGCs and their axons in the GCL and blood vessels in the IPL and OPL, respectively. No Iba1-positive cells were detected in animals that had been before on a PLX diet for 21 d. Scale bar, 25 μm. C, Quantification of Iba1-positive cells in respective layers (GCL, IPL, and OPL) of flat-mounted retinae from control- and PLX-treated mice as shown in B. Mean microglia numbers per square millimeter are depicted above the respective columns. No microglia were detected upon 21 d long PLX treatment. Treatment effects: ***p < 0.001 for 6 mice per experimental group (1-way ANOVA with Holm–Sidak post hoc test). D, Iba1-stained microglial cells were detected throughout optic nerves of untreated control mice (con), but depleted upon PLX treatment. A rare example of a remaining single Iba1-positive cell (bottom PLX-treated optic nerve) is presented to substantiate that Iba1 staining still works in PLX-treated animals. Dashed boxes indicate areas magnified in the respective photographs to the right. Scale bars, 200 μm in overview and 100 μm in respective magnifications.
Figure 2.
Figure 2.
PLX5622 treatment is specific for microglia. A, Iba1 immunostaining was unchanged on thin sections of spleen isolated from mice on either 3-week control (con) or PLX5622 (PLX) diet, indicating that peripheral monocytes/macrophages were unaffected by this treatment. In comparison, the majority of monocytes/macrophages were eliminated upon injection of clodronate liposomes (clo), especially in the red pulp, whereas macrophages in the white pulp (green dashed lines) remained due to poor accessibility by liposomes. Cotreatment with PLX and clodronate liposomes (PLX+clo) did not further reduce numbers of Iba1-positive cells in spleen sections. Dashed red boxes indicate areas magnified in the respective photographs underneath. Scale bars, 100 μm. B, Representative photographs of longitudinal optic nerve sections from naive mice stained for GFAP. Number and distribution of GFAP-positive astrocytes were comparable in untreated control (con) and PLX-treated mice (PLX). Scale bar, 250 μm. C, Quantification of GFAP fluorescence intensity on optic nerve sections represented in B. Mean gray values of GFAP staining, measured in arbitrary units (A.U.), were determined in three randomly selected 150 × 150 μm sectors and averaged per optic nerve (five mice per group). Microglia depletion did not affect GFAP intensity. ns, Nonsignificant by Student's t test. D, Representative photographs of longitudinal optic nerve sections stained for Olig2. Number and distribution of Olig2-positive oligodendrocyte lineage cells were comparable in untreated control (con) and PLX-treated mice (PLX). Scale bar, 250 μm. E, Quantification of Olig2-positive cell nuclei on optic nerve sections as depicted in D. Cell nuclei were quantified in three randomly selected 150 × 150 μm sectors per nerve section and data are presented as means per square millimeter (five mice per group). Microglia depletion did not affect the number of Olig2-positive cells. ns, Nonsignificant by Student's t test.
Figure 3.
Figure 3.
Axotomy-induced RGC degeneration is unaltered upon microglia depletion. A, Representative photographs of βIII-tubulin-stained flat-mounted retinae isolated either from untreated control (con) or PLX5622-treated (PLX) mice at 0, 7, 10, and 21 d after ONC. Scale bar, 50 μm. B, Quantification of surviving RGCs per square millimeter in flat-mounted retinae as indicated in A. Numbers of surviving βIII-tubulin-positive RGCs decreased gradually over time. Microglia depletion had no impact on RGC survival at any time point analyzed. ns, Nonsignificant by one-way ANOVA with Holm–Sidak post hoc test. Data represent mean values ± SEM of at least 4 mice per experimental group (con 0 d: n = 11, 7 d: n = 4, 10 d: n = 6, 21 d: n = 6; PLX 0 d: n = 6, 7 d: n = 4, 10 d: n = 6, 21 d: n = 7). C, Representative confocal photographs of flat-mounted retinae showing Iba1-positive reactive microglia with short and thick protrusions (red) in the GCL of control retinae 10 d after ONC. Coimmunostaining for βIII-tubulin (green) was used to detect RGCs' somata and axons. No Iba1-positive cells were detected in PLX-treated animals. Scale bar, 25 μm. D, Quantification of Iba1-positive cells in respective cell layers (GCL, IPL, and OPL) of flat-mounted retinae in control- and PLX-treated mice 10 d after ONC as presented in C. Mean microglia numbers per square millimeter are depicted above the respective columns and are increased throughout all layers upon ONC compared with noninjured mice (Fig. 1C). No microglia were detected upon PLX treatment. Treatment effects: ***p < 0.001. ns, Nonsignificant by one-way ANOVA with Holm–Sidak post hoc test. Cells were quantified in four (con) and six (PLX) different retinae, respectively.
Figure 4.
Figure 4.
Verification of microglia depletion upon PLX5622 treatment. A, Iba1-positive cells (red) in the GCL, IPL, and OPL costain (arrowheads) for CD11b (green) on retinal cross-sections, indicating the presence of activated microglia 10 d after ONC. Immunostaining of βIII-tubulin (magenta) identifies RGCs (arrow) and their axons in the GCL. Only RGCs (arrow), but no microglia, were detected after PLX5622 treatment (PLX). INL, Inner nuclear layer; ONL, outer nuclear layer. Scale bar, 50 μm. B, Prior retrograde 4-Di-10-ASP (DiASP)-labeling confirms the absence of phagocytic microglia in axotomized retinae of PLX-treated mice. In control retinae (con), DiASP (green) was detected in surviving βIII-tubulin-positive (magenta) RGC soma (arrow), as well as in Iba1-positive (red) microglia (white arrowheads) at 14 d after ONC due to ongoing phagocytosis of degenerated RGCs. In contrast, only DiASP-positive RGCs (white arrow) and DiASP-labeled apparent apoptotic bodies (red arrowheads), but no microglia, were observed in retinae of PLX-treated animals. Dashed boxes indicate areas magnified in the respective photographs to the right. Scale bars, 100 μm in overview on the left and 25 μm in respective magnifications.
Figure 5.
Figure 5.
Microglia and infiltrating macrophages have no impact on the survival of regeneration-competent axotomized RGCs. A, Confocal images of flat-mounted murine retinae show the distribution and morphology of Iba1-positive cells (red) in respective retinal layers 21 d after ONC+LI, which increases the regenerative potential of RGCs. In otherwise untreated retinae (con), Iba1-positive cells were identified in the GCL, IPL, and OPL. In contrast to sole ONC (Fig. 3), a few Iba1-positive cells were detected in the GCL and IPL of PLX5622 (PLX)-treated mice 21 d after ONC+LI. These cells likely represent infiltrated macrophages because they disappeared upon combined treatment with PLX and clodronate liposomes (PLX+clo). For spatial orientation, coimmunostaining for βIII-tubulin (green) was used to detect RGCs and their axons in the GCL, whereas blood vessels were nonspecifically labeled in the IPL and OPL. Dashed boxes indicate areas in the GCL magnified in the second row (GCL magn.). Scale bars, 50 μm. B, Quantification of Iba1-positive cells in respective layers (GCL, IPL, and OPL) of flat-mounted retinae in experimental groups as described in A. Cell numbers are depicted above the respective columns. Almost no Iba1-positive cells were detected upon combined treatment with PLX+clo. Treatment effects compared with controls: ***p < 0.001 by one-way ANOVA with Holm–Sidak post hoc test. Cells were quantified in six (con), six (PLX), and four (PLX+clo) different retinae, respectively. C, Quantitative RT-PCR analysis of Csf1r, a marker for microglia and macrophages, in retinae of either PLX-treated or combined PLX + clodronate liposomes (PLX+clo)-treated mice compared with untreated controls (con). Retinae were isolated from naive mice (−) or animals that received either ONC or ONC+LI for 5 d before tissue isolation. Csf1r mRNA levels were strongly elevated upon ONC and even further upon ONC+LI in con mice. PLX treatment eliminated Csf1r expression in retinae from con and ONC-treated mice and clodronate liposomes had no further effect under these conditions. In contrast, low Csf1r expression was still detected in PLX-treated animals after ONC+LI, which was diminished by additional injections of clodronate liposomes. Treatment effects compared with controls: *p < 0.05; ***p < 0.001 by two-way ANOVA with Holm–Sidak post hoc test for 3 animals per experimental group. D, Representative photographs of βIII-tubulin-stained flat-mounted retinae isolated either from otherwise untreated con, PLX-treated, clodronate liposome (clo)-treated, or PLX+clo-treated mice at 21 d after ONC+LI. Scale bar, 50 μm. E, Quantification of surviving RGCs in flat-mounted retinae as indicated in D. RGC numbers after sole ONC (stippled bar, data from Fig. 2B) were included to illustrate the neuroprotective effect of LI. RGC survival and LI-mediated neuroprotection were completely unaffected by microglia (PLX), macrophage (clo), and microglia + macrophage (PLX+clo) depletion. Treatment effects compared with controls: ***p < 0.001. ns, Nonsignificant by one-way ANOVA with Holm–Sidak post hoc test. Cells were quantified in six con, six PLX, four clo, and four PLX+clo-treated retinae, respectively.
Figure 6.
Figure 6.
RGCs' intrinsic regenerative capacity is unaltered in microglia-depleted mice. AC, Quantitative RT-PCR analysis of Gap43 (A), Galanin (B), and Sprr1a (C) expression in retinae of either PLX5622 (PLX)-treated or combined PLX + clodronate liposomes (PLX+clo)-treated mice compared with untreated controls (con). Retinae were isolated from naive mice (−) or from animals that had received either ONC or ONC+LI 5 d before tissue isolation. ONC, particularly ONC+LI, induced the expression of these proregenerative genes, but microglia depletion had no discernable impact. ns, Nonsignificant compared with con; *p < 0.05; **p < 0.01; ***p < 0.001 compared with naive mice by two-way ANOVA with Holm–Sidak post hoc test for 3 animals per experimental group. D, Representative photographs of dissociated adult RGCs isolated from mice on either control (con) or PLX diet after clodronate-liposome (clo) injections or combined PLX+clo treatment. All mice received ONC+LI 5 d before tissue isolation to increase the regenerative capacity of RGCs. RGCs were cultured for 1 d and visualized by βIII-tubulin staining. Scale bar, 25 μm. E, Quantification of RGC neurite length in retinal cultures as depicted in D. PLX, clo, or combined PLX+clo treatment before tissue isolation had no impact on neurite growth from regeneration-competent RGCs. Data were normalized to controls with an average neurite length of 3.0 μm/RGC and represent means ± SEM of at least three independent experiments. In total, 22 con, 24 PLX-, 12 clo-, and 15 PLX+clo-treated wells were analyzed. ns, Nonsignificant by one-way ANOVA with Holm–Sidak post hoc test. F, Quantification of RGC numbers in retinal cultures as in D. PLX, clo, or combined PLX+clo treatment before tissue isolation had no impact on RGC survival in culture. Data were normalized to controls at 1 d with an average number of 580 RGCs/well and represent means ± SEM from the same experimental groups as in E. ns, Nonsignificant by one-way ANOVA with Holm–Sidak post hoc test.
Figure 7.
Figure 7.
Delayed repopulation of the optic nerve lesion site by astrocytes upon microglia depletion. A, Iba1 staining of longitudinally sectioned optic nerves isolated 21 d after ONC or ONC+LI. Iba1-positive cells were detected along the whole optic nerve of mice on control diet (con), with some cell accumulation at the injury site (dashed red line). In contrast, Iba1-positive cells were only found around the lesion site in PLX-treated animals both after ONC or ONC+LI, likely representing infiltrated macrophages. Scale bar, 200 μm. B, Representative photographs of the optic nerve lesion site of mice on either control diet (con), PLX5622 diet (PLX) or PLX diet + clodronate treatment (PLX+clo) that were costained for GFAP (green), Iba1 (red), and DAPI (blue) 10 d after ONC. The area of reduced GFAP staining around the lesion site (dashed line) was larger upon both PLX and PLX+clo treatment than controls. PLX treatment reduced the number of Iba1-positive cells around the lesion sites, whereas none were detected upon PLX+clo treatment. DAPI staining confirmed the presence of fewer cells around the lesion site upon PLX and PLX+clo treatments. Scale bar, 100 μm. C, Representative photographs of GFAP-stained optic nerve lesion sites of mice as in B 21 d after ONC. Astrocytes repopulated the lesion site in all three experimental groups. Scale bar, 100 μm. D, Quantification of the lesion area size identified by reduced GFAP staining relative to the optic nerve width on sections as in B and C. The lesion site was significantly larger upon PLX and PLX+clo treatments compared with controls at 10 d, but similar at 21 d after ONC. Treatment effects: ***p < 0.001. ns, Nonsignificant by two-way ANOVA with Holm–Sidak post hoc test. The area size was quantified on 4 sections per optic nerve for 5–9 mice per experimental group (con 10 d: n = 24, 21 d: n = 32; PLX: 10 d: n = 24, 21 d: n = 36; PLX+clo: 10 d: n = 20, 21 d: n = 20 sections). E, Quantification of GFAP fluorescence intensity within the lesion site on sections as in B and C. Mean gray values within a 500 × 150 μm sector centered at the lesion site were determined in arbitrary units (A.U.). GFAP staining intensity was significantly reduced upon PLX and PLX+clo treatments compared with controls at 10 d, but similar at 21 d after ONC. Treatment effects: *p < 0.05, **p < 0.01. ns, Nonsignificant by two-way ANOVA with Holm–Sidak post hoc test for the same specimens as in D.
Figure 8.
Figure 8.
Optic nerve regeneration is only compromised upon codepletion of microglia and monocytes/macrophages. A, Representative photographs of optic nerve sections with CTB-labeled regenerating axons 21 d after ONC. Nerves were isolated from mice either on control (con) or PLX5622 diet (PLX). Dashed lines indicate the crush site. Scale bar, 250 μm. B, Quantification of regenerating axons extending 0.5, 1, 1.5, and 2 mm from the injury site on sections as in A. Spontaneous axon regeneration was unaffected by PLX treatment. ns, Nonsignificant by two-way ANOVA with Holm–Sidak post hoc test. Axons were quantified on five sections per nerve for five mice per experimental group (n = 25). C, Representative photographs of optic nerve sections with CTB-labeled regenerating axons 21 d after ONC+LI. Respective mice were either on control (con) or PLX diet (PLX) and some received intraperitoneal injections of clodronate liposomes (clo and PLX+clo, respectively). Dashed lines indicate the lesion site. Scale bar, 250 μm. D, Quantification of regenerating axons extending 0.5, 1, 1.5, 2, 2.5, and 3 mm from the injury site on sections as in C. Optic nerve regeneration was unaffected by the depletion of either microglia (PLX) or infiltrating macrophages (clo) compared with controls (con), but double depletion of both cell types (PLX+clo) slightly but significantly reduced the number of regenerating axons. Treatment effects: ***p < 0.001. ns, Nonsignificant by two-way ANOVA with Holm–Sidak post hoc test. Axons were quantified on five sections per nerve for five to eight mice per experimental group (con: n = 30; PLX: n = 40; clo: n = 25; PLX+clo: n = 25). E, Quantification of the longest regenerating axon per section for experimental groups as described in C. Average length of the longest axons was unaffected by depletion of microglia (PLX), infiltrating macrophages (clo), or both cell types (PLX+clo) compared with controls. ns, Nonsignificant by one-way ANOVA with Holm–Sidak post hoc test for the same specimens as in D.

References

    1. Anderson MA, Burda JE, Ren Y, Ao Y, O'Shea TM, Kawaguchi R, Coppola G, Khakh BS, Deming TJ, Sofroniew MV (2016) Astrocyte scar formation aids central nervous system axon regeneration. Nature 532:195–200. 10.1038/nature17623 - DOI - PMC - PubMed
    1. Auriault C, Joseph M, Tartar A, Capron A (1983) Characterization and synthesis of a macrophage inhibitory peptide from the second constant domain of human immunoglobulin G. FEBS Lett 153:11–15. 10.1016/0014-5793(83)80109-4 - DOI - PubMed
    1. Baptiste DC, Powell KJ, Jollimore CA, Hamilton C, LeVatte TL, Archibald ML, Chauhan BC, Robertson GS, Kelly ME (2005) Effects of minocycline and tetracycline on retinal ganglion cell survival after axotomy. Neuroscience 134:575–582. 10.1016/j.neuroscience.2005.04.011 - DOI - PubMed
    1. Bennett ML, Bennett FC, Liddelow SA, Ajami B, Zamanian JL, Fernhoff NB, Mulinyawe SB, Bohlen CJ, Adil A, Tucker A, Weissman IL, Chang EF, Li G, Grant GA, Hayden Gephart MG, Barres BA (2016) New tools for studying microglia in the mouse and human CNS. Proc Natl Acad Sci U S A 113:E1738–E1746. 10.1073/pnas.1525528113 - DOI - PMC - PubMed
    1. Bosco A, Inman DM, Steele MR, Wu G, Soto I, Marsh-Armstrong N, Hubbard WC, Calkins DJ, Horner PJ, Vetter ML (2008) Reduced retina microglial activation and improved optic nerve integrity with minocycline treatment in the DBA/2J mouse model of glaucoma. Invest Ophthalmol Vis Sci 49:1437–1446. 10.1167/iovs.07-1337 - DOI - PubMed

Publication types

Substances