. 2017 May 24;9(391):eaal3226.
doi: 10.1126/scitranslmed.aal3226.

Multiparametric plasma EV profiling facilitates diagnosis of pancreatic malignancy

Affiliations

Multiparametric plasma EV profiling facilitates diagnosis of pancreatic malignancy

Katherine S Yang et al. Sci Transl Med. .

Abstract

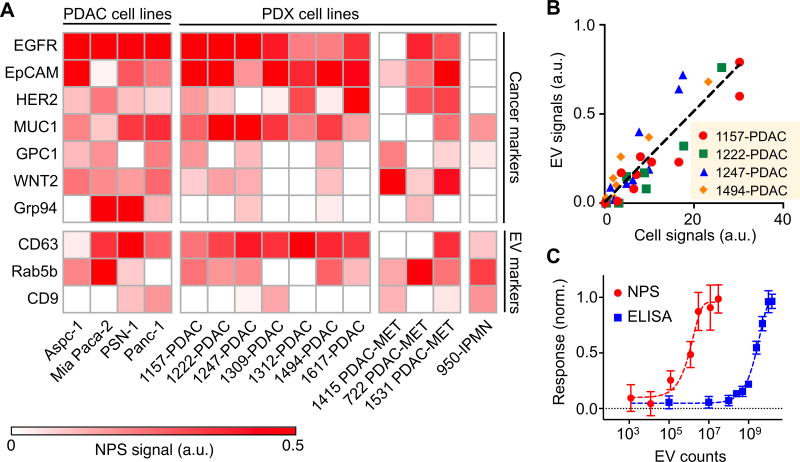
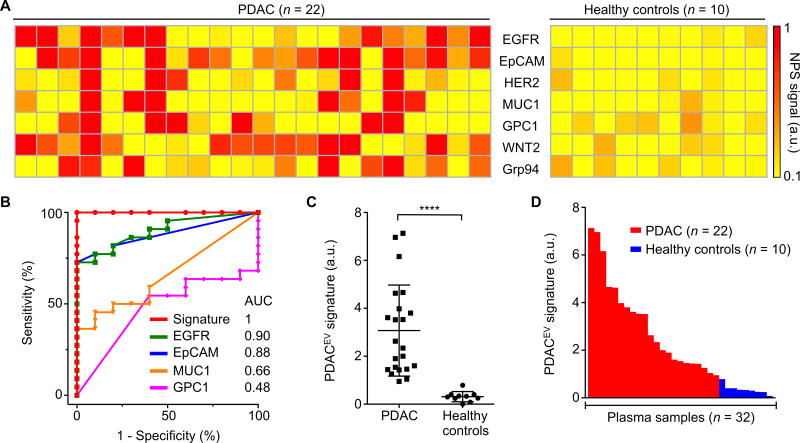
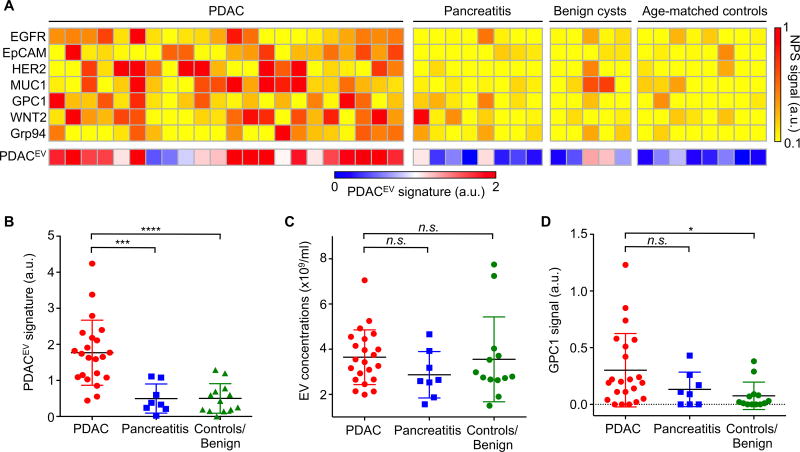
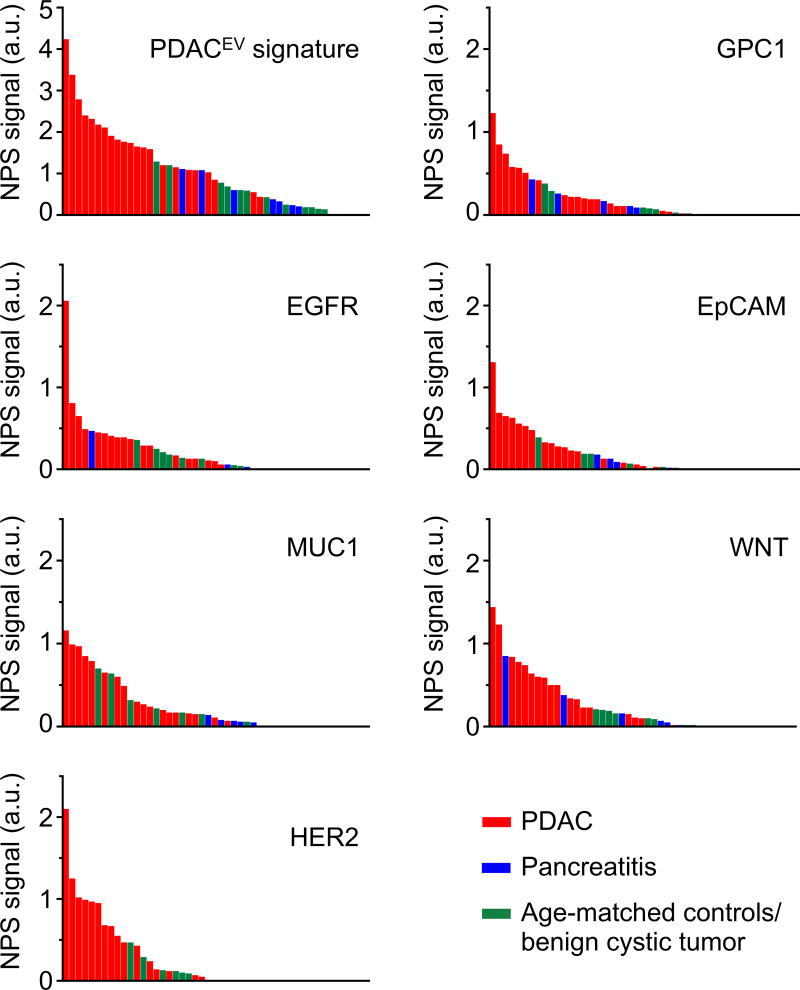
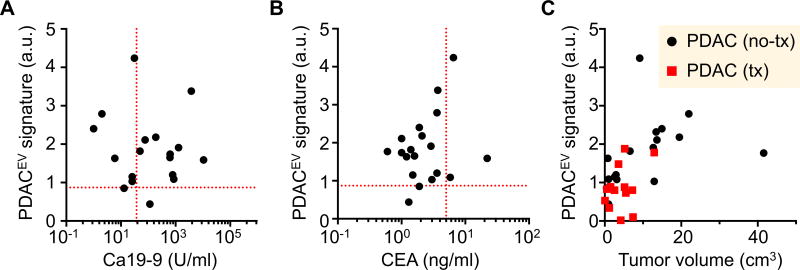
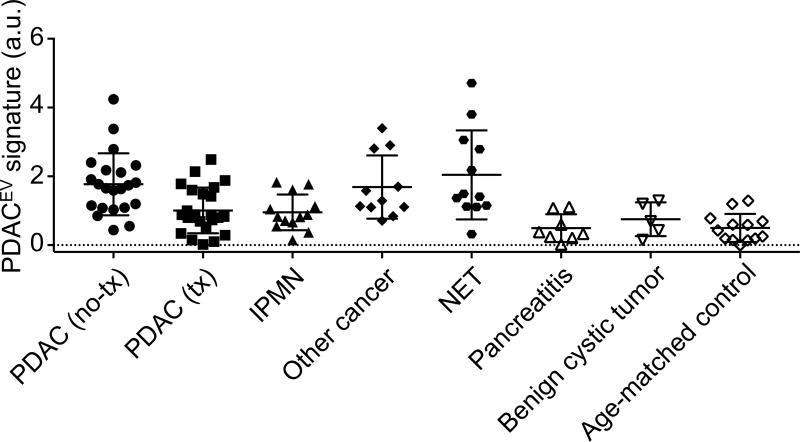
Pancreatic ductal adenocarcinoma (PDAC) is usually detected late in the disease process. Clinical workup through imaging and tissue biopsies is often complex and expensive due to a paucity of reliable biomarkers. We used an advanced multiplexed plasmonic assay to analyze circulating tumor-derived extracellular vesicles (tEVs) in more than 100 clinical populations. Using EV-based protein marker profiling, we identified a signature of five markers (PDACEV signature) for PDAC detection. In our prospective cohort, the accuracy for the PDACEV signature was 84% [95% confidence interval (CI), 69 to 93%] but only 63 to 72% for single-marker screening. One of the best markers, GPC1 alone, had a sensitivity of 82% (CI, 60 to 95%) and a specificity of 52% (CI, 30 to 74%), whereas the PDACEV signature showed a sensitivity of 86% (CI, 65 to 97%) and a specificity of 81% (CI, 58 to 95%). The PDACEV signature of tEVs offered higher sensitivity, specificity, and accuracy than the existing serum marker (CA 19-9) or single-tEV marker analyses. This approach should improve the diagnosis of pancreatic cancer.


Conflict of interest statement

Competing interests: The authors declare no competing financial interests.

Figures

Fig. 1
Fig. 1. Working principle of the plasmon sensor chip (NPS) for tumor derived extracellular vesicles
(A) EV binding to the nanopore surface via monoclonal antibody immobilized on the gold surface causes a spectral shift of light transmitted through the nanopores. (B) The spectral shift of resonance peak in light transmission is measured to quantify the amount of EVs captured on the nanopore surface. a.u., arbitrary unit. (C) Scanning electron micrographs (SEMs) show the periodically arranged nanopore array and EVs captured on the surface. Each nanohole has a diameter of 200 nm and a periodicity of 500 nm.
Fig. 2
Fig. 2. In vitro profiling of tEV markers on cell line-derived EVs
(A) The molecular expression of cancer markers (EGFR, EpCAM, HER2, MUC1, GPC1, WNT2. Grp94) and EV markers (CD63, Rab5b, CD9) were characterized on EVs derived from 4 cancer cell lines and 11 patient-derived xenograft (PDX) cell lines including PDAC, metastatic PDAC (PDAC-MET) and IPMN. (B) Correlation of protein levels measured between EVs and their parental cell lines (1157-PDAC, 1222-PDAC, 1247-PDAC and 1494-PDAC). a.u., arbitrary unit. (C) Sensitivity comparison between NPS and the gold standard ELISA. The responses were normalized against the values of highest concentrations.
Fig. 3
Fig. 3. Molecular profiling of plasma EV for a training cohort
(A) Putative cancer markers (EGFR, EpCAM, HER2, Muc1) and PDAC markers (GPC1, WNT2, Grp94 and B7-H3) were profiled on EVs collected from 22 PDAC patients and 10 healthy controls. (B) ROC curves were calculated for single protein markers as well as for the PDACEV signature combination to determine optimum EV threshold values. AUC, area under the curve. (C) A combined marker panel (EGFR, EpCAM, MUC1, GPC1, WNT2) was established as a PDACEV signature that showed 100% accuracy for the training cohort in distinguishing PDAC from healthy controls. P value was determined by Mann-Whitney test. ****P < 0.0001. (D) A waterfall plot shows the PDACEV signature signals sorted from high (left) to low (right). Each column represents a different patient sample (red, malignant; blue, benign). a.u., arbitrary unit.
Fig. 4
Fig. 4. The PDACEV signature differentiation of PDAC patients from pancreatitis and control patient groups
(A) Heatmap analysis of EV markers. The PDACEV signature is defined as a combined marker panel of EGFR, EpCAM, MUC1, GPC1 and WNT2. (B–D) The established PDACEV signature signals (B), EV concentrations (C) and single GPC1 signal (D) as measured for plasma EVs collected from 22 PDAC patients, 8 pancreatitis, 5 benign cystic tumor, and 8 age matched controls. Pairwise comparison p values were determined by the Dunn’s multiple comparisons test. *P < 0.05, ***P < 0.001, ****P < 0.0001. n.s., not significant. a.u., arbitrary unit.
Fig. 5
Fig. 5. Distribution of EV protein marker signals
Waterfall plots show EV protein levels of each of the different biomarkers sorted from high (left) to low (right). Each column represents a different patient sample (red, PDAC, n=22; blue, pancreatitis, n=8; green, age-matched controls and benign cystic tumors, n=13). a.u., arbitrary unit.
Fig. 6
Fig. 6. Comparison of EV analyses with conventional clinical metrics
The PDACEV signature values are correlated to serum biomarkers (CA 19-9, A and CEA, B) on patients with PDAC and the tumor diameter (C). The dashed red lines indicate the threshold values to be positive (CA 19-9, 37 U/ml; CEA, 5 ng/ml; PDACEV signature, 0.87). a.u., arbitrary unit.
Fig. 7
Fig. 7. EV analyses for patients with different types of pancreatic-related diseases
The PDACEV signature values are measured for patient cohorts (n = 103 including i) PDAC without treatment (n = 22), ii) PDAC treated with neoadjuvant regimen (n = 24), ii) IPMN (n = 13), iv) other GI cancers mimicking pancreatic duodenal cancers (n = 11), v) neuroendocrine tumors (NET, n = 12), vii) pancreatitis (n = 8), viii) benign cystic tumors and (n = 5) and ix) age-matched control (n = 18). a.u., arbitrary unit.

Comment in

References

    1. Rahib L, Fleshman JM, Matrisian LM, Berlin JD. Evaluation of Pancreatic Cancer Clinical Trials and Benchmarks for Clinically Meaningful Future Trials: A Systematic Review. JAMA Oncol. 2016;2:1209–1216. - PubMed
    1. Ghatnekar O, Andersson R, Svensson M, Persson U, Ringdahl U, Zeilon P, Borrebaeck CA. Modelling the benefits of early diagnosis of pancreatic cancer using a biomarker signature. Int J Cancer. 2013;133:2392–2397. - PubMed
    1. Zhang Y, Yang J, Li H, Wu Y, Zhang H, Chen W. Tumor markers CA19-9, CA242 and CEA in the diagnosis of pancreatic cancer: a meta-analysis. Int J Clin Exp Med. 2015;8:11683–11691. - PMC - PubMed
    1. Duffy MJ, Sturgeon C, Lamerz R, Haglund C, Holubec VL, Klapdor R, Nicolini A, Topolcan O, Heinemann V. Tumor markers in pancreatic cancer: a European Group on Tumor Markers (EGTM) status report. Ann Oncol. 2010;21:441–447. - PubMed
    1. Seufferlein T, Mayerle J. Pancreatic cancer in 2015: Precision medicine in pancreatic cancer--fact or fiction. Nat Rev Gastroenterol Hepatol. 2016;13:74–75. - PubMed

Publication types