. 2017 May 24;7(1):2379.
doi: 10.1038/s41598-017-02391-y.

Whole blood transcriptome analysis reveals potential competition in metabolic pathways between negative energy balance and response to inflammatory challenge

Affiliations

Whole blood transcriptome analysis reveals potential competition in metabolic pathways between negative energy balance and response to inflammatory challenge

Juliette Bouvier-Muller et al. Sci Rep. .

Abstract

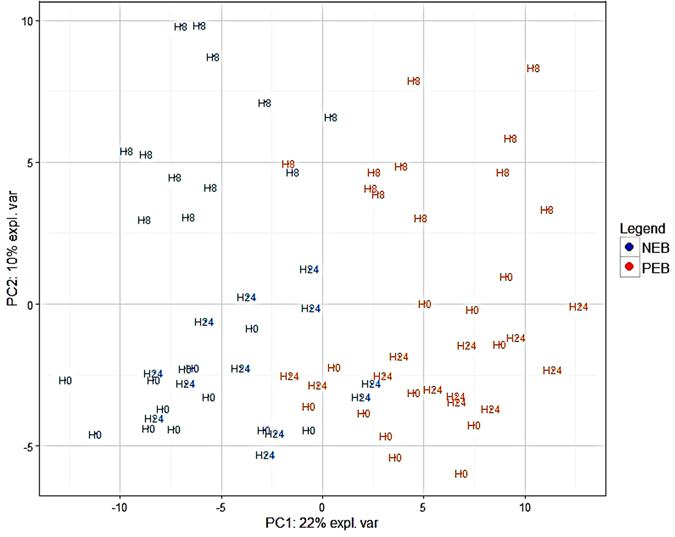
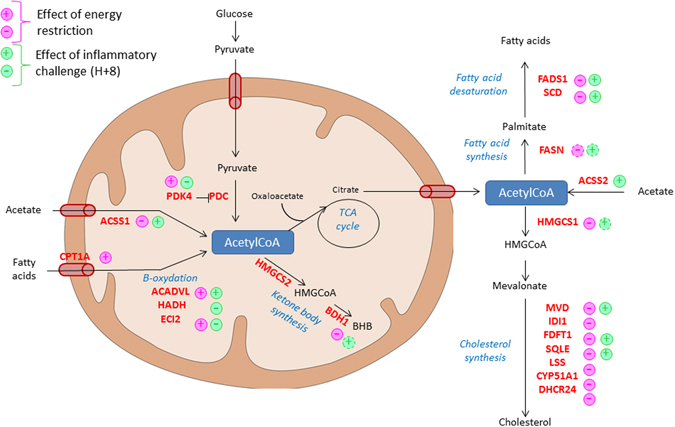
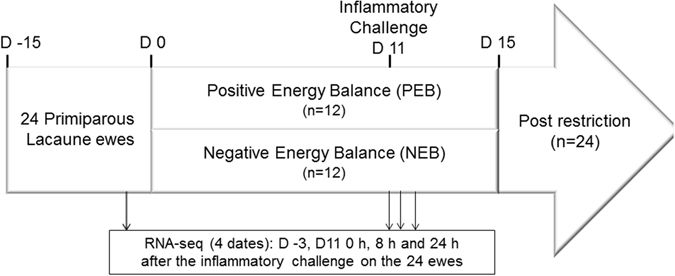
Negative Energy Balance (NEB) is considered to increase susceptibility to mastitis. The objective of this study was to improve our understanding of the underlying mechanisms by comparing transcriptomic profiles following NEB and a concomitant mammary inflammation. Accordingly, we performed RNA-seq analysis of blood cells in energy-restricted ewes and control-diet ewes at four different time points before and after intra mammary challenge with phlogogenic ligands. Blood leucocytes responded to NEB by shutting down lipid-generating processes, including cholesterol and fatty acid synthesis, probably under transcriptional control of SREBF 1. Furthermore, fatty acid oxidation was activated and glucose oxidation and transport inhibited in response to energy restriction. Among the differentially expressed genes (DEGs) in response to energy restriction, 64 genes were also differential in response to the inflammatory challenge. Opposite response included the activation of cholesterol and fatty acid synthesis during the inflammatory challenge. Moreover, activation of glucose oxidation and transport coupled with the increase of plasma glucose concentration in response to the inflammatory stimuli suggested a preferential utilization of glucose as the energy source during this stress. Leucocyte metabolism therefore undergoes strong metabolic changes during an inflammatory challenge, which could be in competition with those induced by energy restriction.


Conflict of interest statement

The authors declare that they have no competing interests.

Figures

Figure 1
Figure 1
PCA performed on the 191 DEGs in response to energy restriction. The orange and blue colors indicate samples from Positive Energy Balance (PEB) and Negative Energy Balance (NEB), respectively. H0, H8 and H24 indicate the sampling hour relative to the inflammatory challenge.
Figure 2
Figure 2
Fold change of the DEGs (q-value < 0.05) in response to energy restriction according to the fold change of the DEG (q-value < 0.05) in early response to inflammatory challenge. Boxplots show normalized counts of FADS1 and PDK4 genes in blood cells of Negative Energy Balance (NEB) ewes (red, n = 12) and Positive Energy Balance (PEB) ewes (blue, n = 12) at four different time points. Day time points are related to the first day of energy restriction (d 0) and hour time points are related to the inflammatory challenge (H0).
Figure 3
Figure 3
Predicted transcription regulators related to DEGs (q-value < 0.05) for both response to energy restriction and early response to the inflammatory challenge. Molecules highlighted in green were down-regulated and molecules highlighted in red were up-regulated.
Figure 4
Figure 4
Summary diagram showing the effect of energy restriction and an inflammatory challenge on mitochondrial metabolic processes and their conflicting features. Pyruvate dehydrogenase kinase PDK4 inhibits the pyruvate dehydrogenase complex (PDC). Plus indicates up-regulated DEG and minus down-regulated DEG. Dotted plus or minus indicate DEG that had a tendency (q-value < 0.1) to be respectively up or down-regulated.
Figure 5
Figure 5
Experiment timeline.

References

    1. Drackley JK. Biology of Dairy Cows During the Transition Period: the Final Frontier? J. Dairy Sci. 1999;82:2259–2273. doi: 10.3168/jds.S0022-0302(99)75474-3. - DOI - PubMed
    1. Dann HM, et al. Diets during far-off and close-up dry periods affect periparturient metabolism and lactation in multiparous cows. J. Dairy Sci. 2006;89:3563–3577. doi: 10.3168/jds.S0022-0302(06)72396-7. - DOI - PubMed
    1. Pyörälä S. Mastitis in Post-Partum Dairy Cows. Reprod. Domest. Anim. 2008;43:252–259. doi: 10.1111/j.1439-0531.2008.01170.x. - DOI - PubMed
    1. Jánosi S, et al. Energy imbalance related predisposition to mastitis in group-fed high-producing postpartum dairy cows. Acta Vet. Hung. 2003;51:409–424. doi: 10.1556/AVet.51.2003.3.14. - DOI - PubMed
    1. Nyman A-K, et al. Metabolites and immune variables associated with somatic cell counts of primiparous dairy cows. J. Dairy Sci. 2008;91:2996–3009. doi: 10.3168/jds.2007-0969. - DOI - PubMed

Publication types

MeSH terms