. 2010 Sep 9:2:121-137.
doi: 10.2147/eb.s9902. eCollection 2010.

Differential effects of amyloid-β peptide aggregation status on in vivo retinal neurotoxicity

Affiliations

Differential effects of amyloid-β peptide aggregation status on in vivo retinal neurotoxicity

H R Watts et al. Eye Brain. .

Abstract

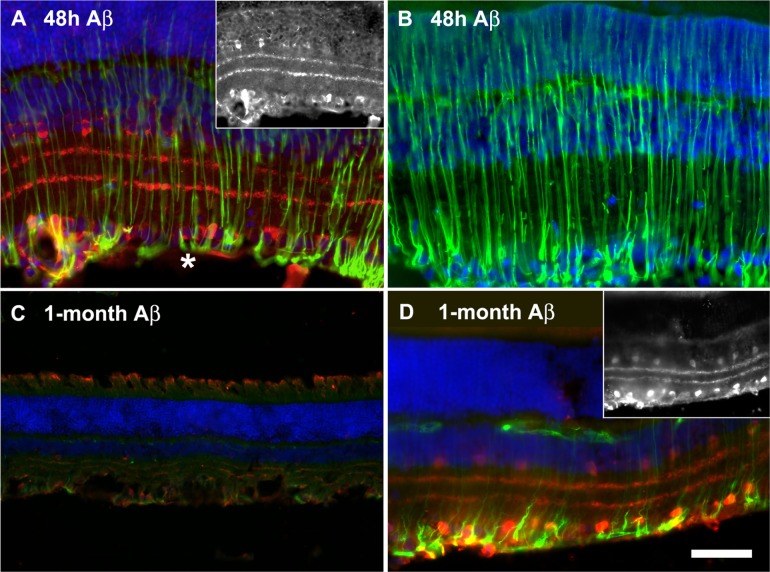
The present study examined the relationship between amyloid beta (Aβ)-peptide aggregation state and neurotoxicity in vivo using the rat retinal-vitreal model. Following single unilateral intravitreal injection of either soluble Aβ1-42 or Aβ1-42 preaggregated for different periods, retinal pathology was evaluated at 24 hours, 48 hours, and 1-month postinjection. Injection of either soluble Aβ (sAβ) or preaggregated Aβ induced a rapid reduction in immunoreactivity (IR) for synaptophysin, suggesting that direct contact with neurons is not necessary to disrupt synapses. Acute neuronal ionic and metabolic dysfunction was demonstrated by widespread loss of IR to the calcium buffering protein parvalbumin (PV) and protein gene product 9.5, a component of the ubiquitin-proteosome system. Injection of sAβ appeared to have a more rapid impact on PV than the preaggregated treatments, producing a marked reduction in PV cell diameters at 48 hours, an effect that was only observed for preaggregated Aβ after 1-month survival. Extending the preaggregation period from 4 to 8 days to obtain highly fibrillar Aβ species significantly increased the loss of choline acteyltransferase IR, but had no effect on PV-IR. These findings prompt the conclusion that Aβ assembly state has a significant impact on in vivo neurotoxicity by triggering distinct molecular changes within the cell.

Keywords: Alzheimer disease; retina.


Conflict of interest statement

Disclosure The authors declare that there are no conflicts of interest in this work.

Figures

Figure 1
Figure 1
Synaptophysin immunoreactivity in retinas from noninjected (right) eyes (top panel) and injected (left) eyes (middle panel) at 48 hours following intravitreal injection of either phosphate buffered saline (PBS), soluble Aβ142 (2 nmol/3 μL) or at 24 hours following injection of aggregated Aβ1–42 (5 nmol/3 μL), incubated for 4 days. Optical density profiles for the corresponding retinas (lower panel) highlight the loss of syna ptophysin-IR in the inner plexiform layer (IPL) of Aβ1–42-injected eyes (E and F). Synaptophysin-IR in the outer plexiform layer (OPL) was more variable, with only a few cases showing a marked decline (F). Scale bar = 50 μm.
Figure 2
Figure 2
Mean optical density of synaptophysin immunoreactivity in the inner plexiform layer of injected eyes for groups receiving either aggregated Aβ1–42 (2 nmol) or (5 nmol) assessed at 24-hour postinjection, or aggregated Aβ42–1 control peptide (5 nmol), aggregated Aβ1–42 (5 nmol) or soluble Aβ1–42 (2 nmol), assessed at 48-hour postinjection. All aggregated peptides were incubated for 4 days. Values are expressed as a percentage of the phosphate buffered saline (PBS) control, given as mean ± standard error of the mean (SEM). *P < 0.05, **P < 0.01: significant reduction compared with Aβ42–1 control peptide group (1-way ANOVA and post hoc Dunnett’s test). Abbreviations: Agg, aggregated; sol, soluble.
Figure 3
Figure 3
Parvalbumin immunostaining with cresyl violet counterstain in a normal retina (A) and at 48 hours following injection of Aβ1–42 incubated for 4 days (B) or soluble Aβ1–42 (C). (D and E) Fluorescence images showing parvalbumin (PV; red) with DAPI nuclear stain (blue) following injection with phosphate buffered saline (PBS; D) or Aβ1–42 incubated for 8 days after 48-hour survival (E) and 1-month survival (F). Note partial recovery of PV-labeling after 1 month despite a marked loss of retinal thickness. Scale bars = 50 μm.
Figure 4
Figure 4
Reduction in parvalbumin (PV) immunoreactive (IR; A) cell numbers and (B) cell diameters 48 hours after injection with phosphate buffered saline (PBS), Aβ42–1 control peptide, soluble Aβ1–42, Aβ1–42 preaggregated for 4 or 8 days and 1 month after Aβ1–42 preaggregated for 8 days. All peptides were injected at 5 nmol/3 μL. Loss of PV-IR cell numbers was far less extensive at 1 month after injection of Aβ1–42; however, this was accompanied by a significant reduction in average cell diameters (B). Bars represent mean ± standard error of the mean (SEM). 95% confidence interval (CI). *P < 0.05, **P < 0.01: significant reduction compared with (A) noninjected eyes (paired t-tests), (B) with PBS controls (1-way ANOVA with a post hoc Dunnett’s test).
Figure 5
Figure 5
Retinal sections showing the distribution of protein gene product 9.5 (PGP 9.5, red) with glial fibrillary acid protein (GFAP, green) and DAPI nuclear stain (blue). Inset monochromatic images depict PGP 9.5 alone. In normal retina (A), PGP 9.5 is strongly expressed among both somata and plexiform layers of horizontal, amacrine and ganglion cells. B) Injection of Aβ42–1 reverse sequence produced modest downregulation of PGP 9.5 and mild upregulation of GFAP after 48 hours. C) 48 hours after injection of Aβ1–4, PGP 9.5 is clearly downregulated, particularly within large somata. GFAP levels are also markedly increased at 48-hour postinjection. D) 1 month after injection of Aβ1–42 PGP 9.5 expression is largely restored within the atrophied inner plexiform layer and small somata; however, the reduction in labeling of large somata persists. All Aβ1–42 treatments were preaggregated for 8 days. Scale bar = 100 μm.
Figure 6
Figure 6
Choline acteyltransferase (ChAT)-immunostaining in noninjected (right) and injected (left) eyes showing (A and B) no change at 48 hours following phosphate buffered saline (PBS) injection. (C and D) Mild loss of ChAT-immunoreactivity (IR) somata 48 hours after injection with Aβ1–42 preincubated for 4 days. (E and F) Extending the preincubation period to 8 days dramatically increased ChAT loss, with weak or undetectable ChAT-IR predominant among both somata and processes in central retina. (G and H) 1 month after injection with 8-day preincubated Aβ1–42, loss of ChAT-IR persisted and was accompanied by a marked reduction in remaining ChAT-IR neuronal diameters. ChAT loss was also evident in the contralateral (noninjected) retina (G). Scale bar = 100 μm.
Figure 7
Figure 7
Reduction in choline acteyltransferase (ChAT) immunoreactive (IR) cell numbers (A) and cell diameters (B) 48-hour postinjection of phosphate buffered saline (PBS), or 5 nmol Aβ42–1 control peptide, soluble Aβ1–42 or Aβ1–42 preaggregated for 4 days, or at 48 hours or 1 month after Aβ1–42 preaggregated for 8 days. (A) Extending the preaggregation period to 8 days dramatically increased the loss of ChAT cells seen at 48 hours. Significant reduction in ChAT-IR was also evident in noninjected retinas (right-eyes) after 1 month (unpaired t-test). (B) Cell diameters of neurons expressing ChAT in injected (left-eyes) after 1 month were significantly reduced. Bars represent mean ± standard error of the mean (SEM). 95% confidence interval (CI). *P < 0.05, **P < 0.01: significant reduction compared with (A) noninjected eyes (paired t-tests) unless otherwise indicated, (B) with PBS controls (1-way ANOVA with a post hoc Dunnett’s test).
Figure 8
Figure 8
Fluorescence images showing retinal choline acteyltransferase (ChAT; red), nestin (green), and DAPI nuclear stain (blue). Inset monochromatic images depict ChAT alone. A) At 48 hours after injection with Aβ1–42 (5 nmol, 8-day preincubation), declining ChAT levels were accompanied by induction of nestin. Nestin expression was most abundant in the endfeet region of Müller glial cells (asterisk in A), dramatically extending into thickened distal processes in more extreme cases (B). In regions of retina showing no evidence of ChAT recovery after 1 month, nestin levels had largely subsided (C). However, notably towards the periphery, short regions retaining robust ChAT activity were accompanied by prolonged nestin expression (D). Scale bar represents 50 μm (A, B, D); 100 μm (C).
Figure 9
Figure 9
(A) Graph showing dramatic reduction in retinal thickness for Aβ1–42-injected group at 1-month survival compared with naïve controls, or 48 hours after injection with phosphate buffered saline (PBS), Aβ42–1 control peptide, or Aβ1–42. All peptides (5 nmol/3 μL) were preaggregated for 8 days. Bars represent mean ± standard error of the mean (SEM). 95% confidence interval (CI). **P < 0.01: significant reduction compared with PBS controls (Tukey’s post hoc test from 1-way ANOVA). (B) Nissl-stained sections from central retina illustrating variation in retinal thickness (upper panel) with atrophy in both contralateral (noninjected) retinas and Aβ1–42-injected retinas after 1-month survival (lower panel). Note that while the outer nuclear layer (ONL) is largely preserved, there is a marked reduction in the thickness of the inner nuclear layer (INL) at 1-month postinjection (asterisks in lower panel). Scale bar = 100 μm.

References

    1. Guo L, Salt TE, Luong V, et al. Targeting amyloid-beta in glaucoma treatment. Proc Natl Acad Sci U S A. 2007;104:13444–13449. - PMC - PubMed
    1. Haass C, Selkoe DJ. Soluble protein oligomers in neurodegeneration: lessons from the Alzheimer’s amyloid beta-peptide. Nat Rev Mol Cell Biol. 2007;8:101–112. - PubMed
    1. Burdick D, Soreghan B, Kwon M, et al. Assembly and aggregation properties of synthetic Alzheimer’s A4/beta amyloid peptide analogs. J Biol Chem. 1992;267:546–554. - PubMed
    1. Hardy J, Allsop D. Amyloid deposition as the central event in the aetiology of Alzheimer’s disease. Trends Pharmacol Sci. 1991;12:383–388. - PubMed
    1. Pike CJ, Burdick D, Walencewicz AJ, Glabe CG, Cotman CW. Neurodegeneration induced by beta-amyloid peptides in vitro: the role of peptide assembly state. J Neurosci. 1993;13:1676–1687. - PMC - PubMed