Relationship between Sonographic Placental Thickness and Gestational Age in Normal Singleton Fetuses in Enugu, Southeast Nigeria
- PMID: 28540100
- PMCID: PMC5423332
- DOI: 10.4103/amhsr.amhsr_457_15
Relationship between Sonographic Placental Thickness and Gestational Age in Normal Singleton Fetuses in Enugu, Southeast Nigeria
Abstract
Background: The accuracy of common ultrasound parameters for the estimation of gestational age (GA) decreases as pregnancy advances in age. Hence, there is need to explore other parameters that may complement the established fetal biometric parameters in predicting GA in late pregnancy.
Aim: The aim of this study is to determine the relationship between the sonographic placental thickness (PT) and GA in the second and third trimesters.
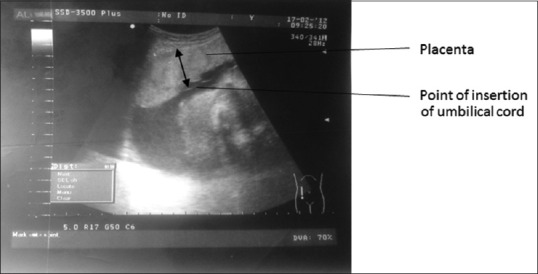
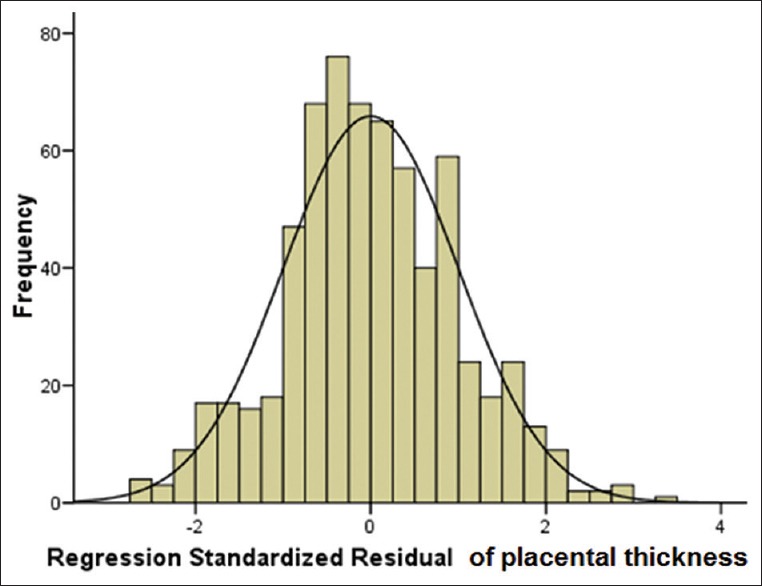
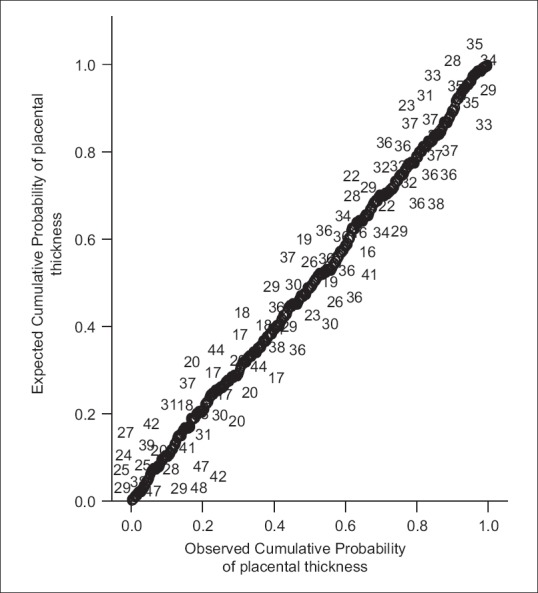
Subjects and methods: A cross-sectional study of 627 normal pregnant women with GA between 14 and 40 weeks was conducted at the University of Nigeria Teaching Hospital Ituku-Ozalla, Enugu from May 2013 to February 2014 by sonography. Anteroposterior diameter of the placenta was measured at the level of the umbilical cord insertion. The last menstrual period of the women, femur length, biparietal diameter, head circumference, and abdominal circumference of the fetus were measured for GA estimation. Descriptive statistics, regression analysis, and independent sample t-test were used in statistical analysis.
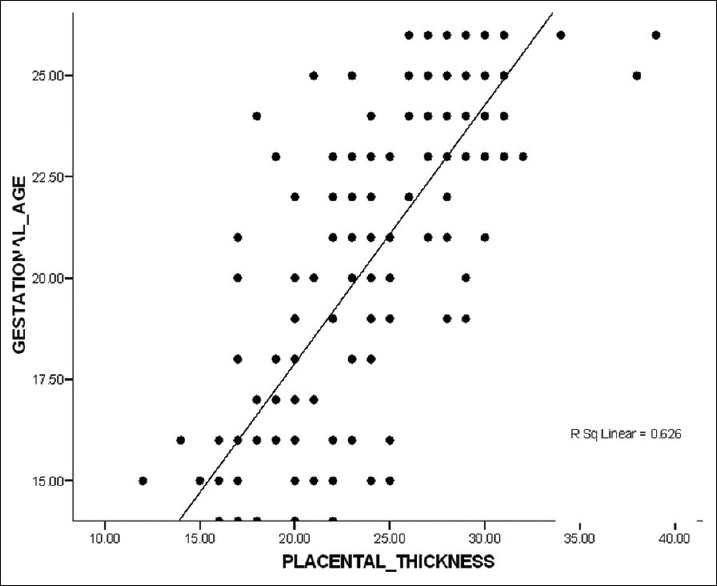
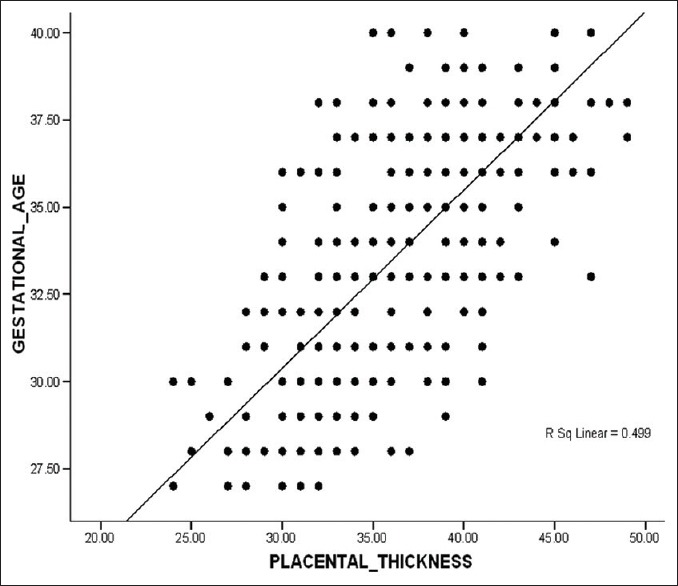
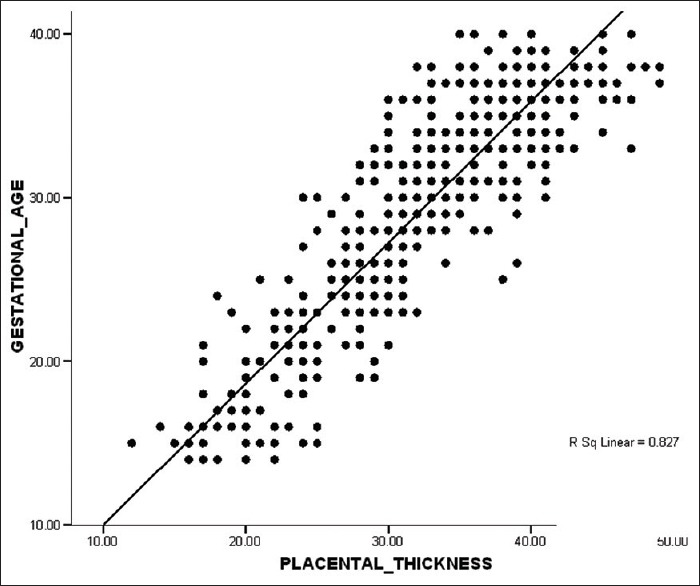
Results: Mean PT was 23.2 (2.8) mm in the second trimester and 36.1 (3.6) mm in the third trimester. There was a significant difference between the values in the present study and values from similar studies in other populations (P < 0.04). There was a strong relationship between GA and PT and the following mathematical relationships for the second and third trimesters were obtained in the GA = 0.982 (PT) + 3.614 and GA = 0.977 (PT) + 3.354, respectively.
Conclusion: Population-specific charts for PT may be used to estimate GA in the second and third trimesters.
Keywords: Gestational age; Placental thickness; Second and third trimesters; Sonography.
Conflict of interest statement
There are no conflicts of interest.
Figures
References
-
- Rudy ES. Diagnostic Ultrasound Applied to Obstetrics and Gynaecology. 2nd ed. New York: Wiley Publishers; 2000. pp. 91–111.
-
- Davis RO, Cutter GR, Goldenberg RL, Hoffman HJ, Cliver SP, Brumfield CG. Fetal biparietal diameter, head circumference, abdominal circumference and femur length. A comparison by race and sex. J Reprod Med. 1993;38:201–6. - PubMed
-
- L'ubuský M, Mícková I, Procházka M, Dzvincuk P, Malá K, Cízek L, et al. Discrepancy of ultrasound biometric parameters of the head (HC – head circumference, BPD – Biparietal diameter) and femur length in relation to sex of the fetus and duration of pregnancy. Ceska Gynekol. 2006;71:169–72. - PubMed
LinkOut - more resources
Full Text Sources
Other Literature Sources