

Monitoring early response to chemoradiotherapy with 18F-FMISO dynamic PET in head and neck cancer
- PMID: 28540417
- PMCID: PMC6563902
- DOI: 10.1007/s00259-017-3720-6
Monitoring early response to chemoradiotherapy with 18F-FMISO dynamic PET in head and neck cancer
Abstract
Purpose: There is growing recognition that biologic features of the tumor microenvironment affect the response to cancer therapies and the outcome of cancer patients. In head and neck cancer (HNC) one such feature is hypoxia. We investigated the utility of 18F-fluoromisonidazole (FMISO) dynamic positron emission tomography (dPET) for monitoring the early microenvironmental response to chemoradiotherapy in HNC.
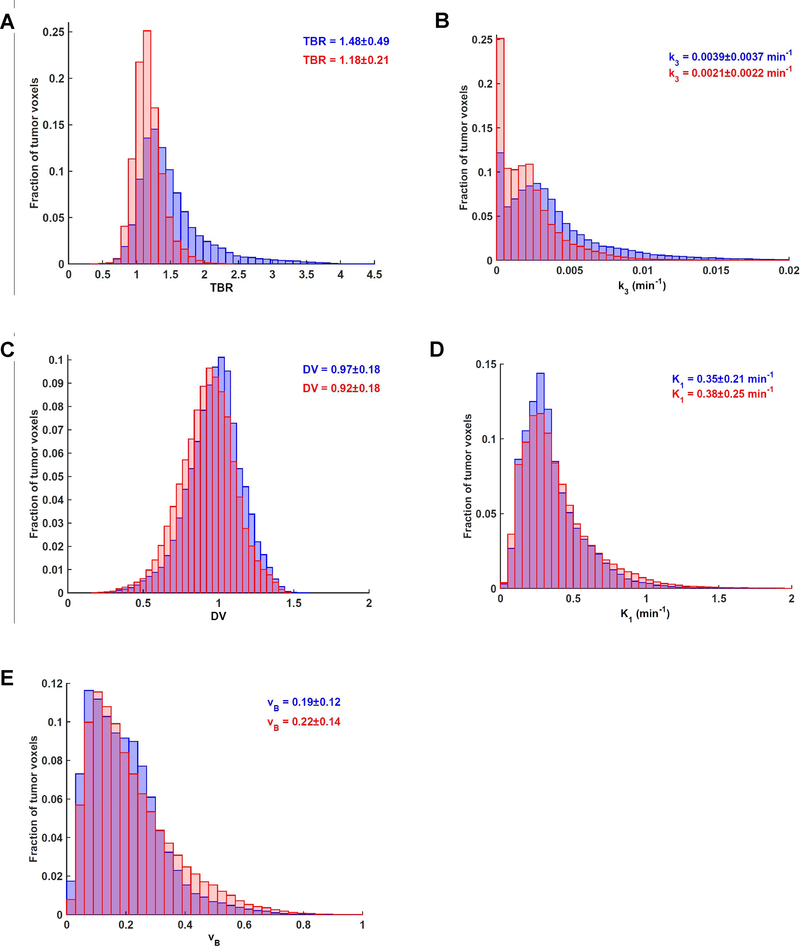
Experimental design: Seventy-two HNC patients underwent FMISO dPET scans in a customized immobilization mask (0-30 min dynamic acquisition, followed by 10 min static acquisitions starting at ∼95 min and ∼160 min post-injection) at baseline and early into treatment where patients have already received one cycle of chemotherapy and anywhere from five to ten fractions of 2 Gy per fraction radiation therapy. Voxelwise pharmacokinetic modeling was conducted using an irreversible one-plasma two-tissue compartment model to calculate surrogate biomarkers of tumor hypoxia (k 3 and Tumor-to-Blood Ratio (TBR)), perfusion (K 1 ) and FMISO distribution volume (DV). Additionally, Tumor-to-Muscle Ratios (TMR) were derived by visual inspection by an experienced nuclear medicine physician, with TMR > 1.2 defining hypoxia.
Results: One hundred and thirty-five lesions in total were analyzed. TBR, k 3 and DV decreased on early response scans, while no significant change was observed for K 1 . The k 3 -TBR correlation decreased substantially from baseline scans (Pearson's r = 0.72 and 0.76 for mean intratumor and pooled voxelwise values, respectively) to early response scans (Pearson's r = 0.39 and 0.40, respectively). Both concordant and discordant examples of changes in intratumor k 3 and TBR were identified; the latter partially mediated by the change in DV. In 13 normoxic patients according to visual analysis (all having lesions with TMR = 1.2), subvolumes were identified where k 3 indicated the presence of hypoxia.
Conclusion: Pharmacokinetic modeling of FMISO dynamic PET reveals a more detailed characterization of the tumor microenvironment and assessment of response to chemoradiotherapy in HNC patients than a single static image does. In a clinical trial where absence of hypoxia in primary tumor and lymph nodes would lead to de-escalation of therapy, the observed disagreement between visual analysis and pharmacokinetic modeling results would have affected patient management in <20% cases. While simple static PET imaging is easily implemented for clinical trials, the clinical applicability of pharmacokinetic modeling remains to be investigated.
Keywords: 18F-FMISO; Dynamic PET; Head and neck cancer; Hypoxia; Treatment response.
Conflict of interest statement
Compliance with Ethical Standards:
Figures


References
-
- Schöder H, Fury M, Lee N, Kraus D. PET monitoring of therapy response in head and neck squamous cell carcinoma. J Nucl Med. 2009;50 Suppl 1:74S–88S. - PubMed
-
- Dubois LJ, Niemans R, van Kuijk SK, et al. New ways to image and target tumour hypoxia and its molecular responses. Radiother Oncol. 2015;116:352–357. - PubMed
-
- van Dijk LK, Boerman OC, Kaanders JH, Bussink J. PET Imaging in Head and Neck Cancer Patients to Monitor Treatment Response: A Future Role for EGFR-Targeted Imaging. Clin Cancer Res. 2015;21:3602–3609. - PubMed
Publication types
MeSH terms
Substances
Grants and funding
LinkOut - more resources
Full Text Sources
Other Literature Sources
Medical
