

Fine-Grained Parcellation of Brain Connectivity Improves Differentiation of States of Consciousness During Graded Propofol Sedation
- PMID: 28540741
- PMCID: PMC5685154
- DOI: 10.1089/brain.2016.0477
Fine-Grained Parcellation of Brain Connectivity Improves Differentiation of States of Consciousness During Graded Propofol Sedation
Abstract
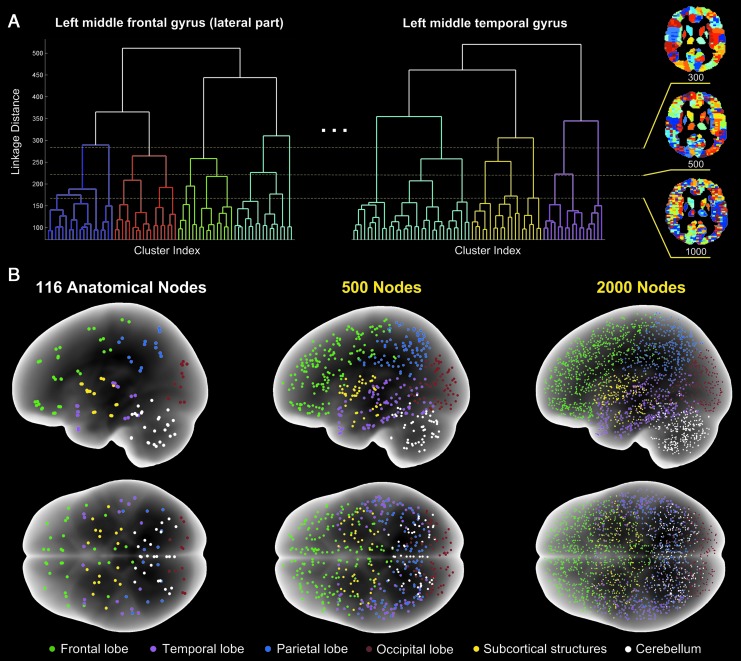
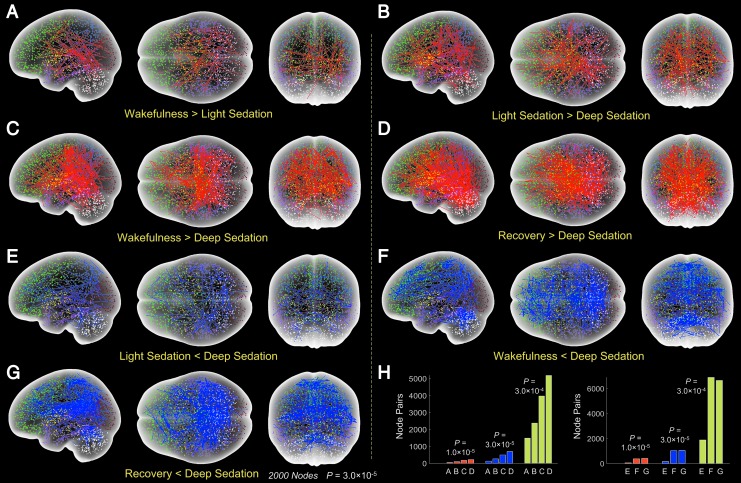
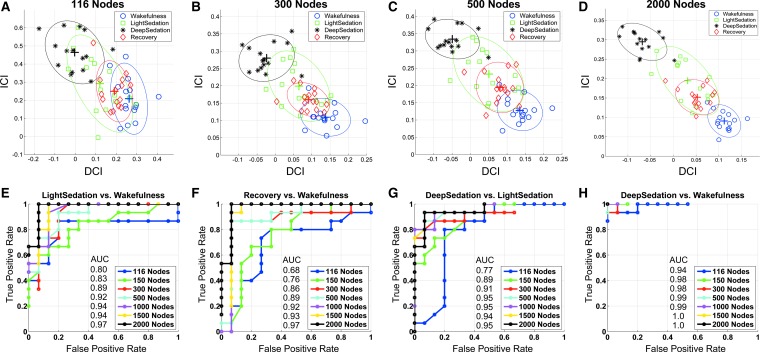
Conscious perception relies on interactions between spatially and functionally distinct modules of the brain at various spatiotemporal scales. These interactions are altered by anesthesia, an intervention that leads to fading consciousness. Relatively little is known about brain functional connectivity and its anesthetic modulation at a fine spatial scale. Here, we used functional imaging to examine propofol-induced changes in functional connectivity in brain networks defined at a fine-grained parcellation based on a combination of anatomical and functional features. Fifteen healthy volunteers underwent resting-state functional imaging in wakeful baseline, mild sedation, deep sedation, and recovery of consciousness. Compared with wakeful baseline, propofol produced widespread, dose-dependent functional connectivity changes that scaled with the extent to which consciousness was altered. The dominant changes in connectivity were associated with the frontal lobes. By examining node pairs that demonstrated a trend of functional connectivity change between wakefulness and deep sedation, quadratic discriminant analysis differentiated the states of consciousness in individual participants more accurately at a fine-grained parcellation (e.g., 2000 nodes) than at a coarse-grained parcellation (e.g., 116 anatomical nodes). Our study suggests that defining brain networks at a high granularity may provide a superior imaging-based distinction of the graded effect of anesthesia on consciousness.
Keywords: brain parcellation; loss of consciousness; propofol sedation; resting-state fMRI; state classification.
Conflict of interest statement
No competing financial interests exist.
Figures
References
-
- Agnati LF, Santarossa L, Genedani S, Canela EI, Leo G, Franco R, et al. . 2004. On the nested hierarchical organization of CNS: basic characteristics of neuronal molecular organization. Cortical Dynamics LNCS 3146. Erdi P., Springer, Berlin:24–54
-
- Alkire MT. 2008. Loss of effective connectivity during general anesthesia. Int Anesthesiol Clin 46:55–73 - PubMed
-
- Baars BJ. 2002. The conscious access hypothesis: origins and recent evidence. Trends Cogn Sci 6:47–52 - PubMed
-
- Baars BJ. 2005. Global workspace theory of consciousness: toward a cognitive neuroscience of human experience. Prog Brain Res 150:45–53 - PubMed
Publication types
MeSH terms
Substances
Grants and funding
LinkOut - more resources
Full Text Sources
Other Literature Sources
