. 2017 May 25:8:15277.
doi: 10.1038/ncomms15277.

Impaired prosaposin lysosomal trafficking in frontotemporal lobar degeneration due to progranulin mutations

Affiliations

Impaired prosaposin lysosomal trafficking in frontotemporal lobar degeneration due to progranulin mutations

Xiaolai Zhou et al. Nat Commun. .

Abstract

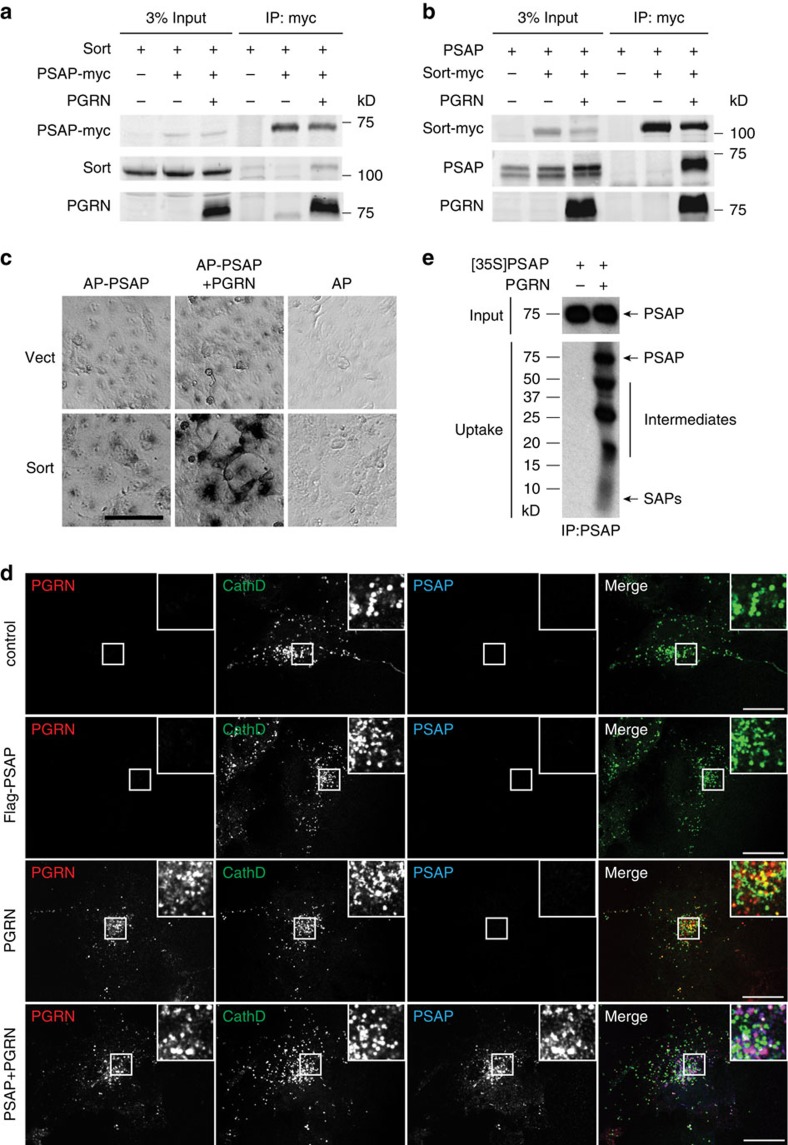
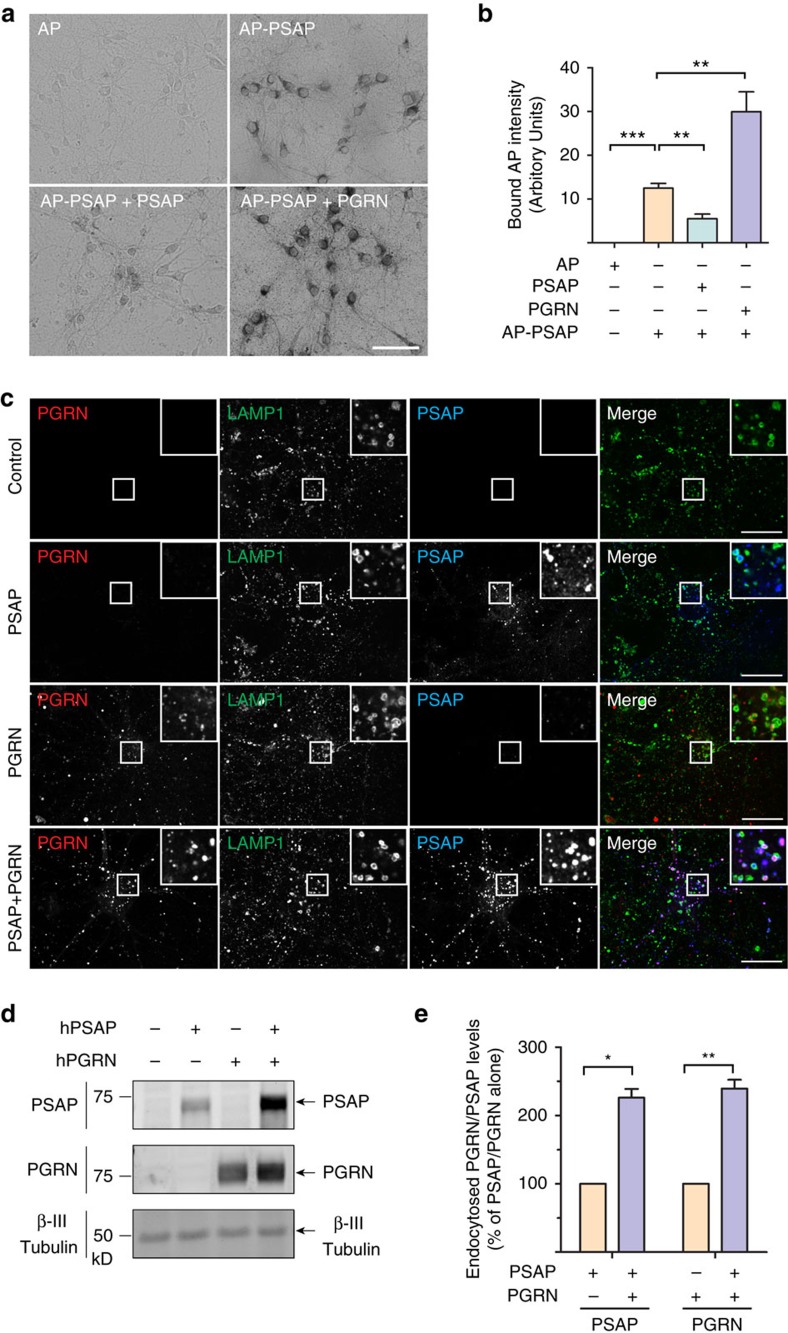
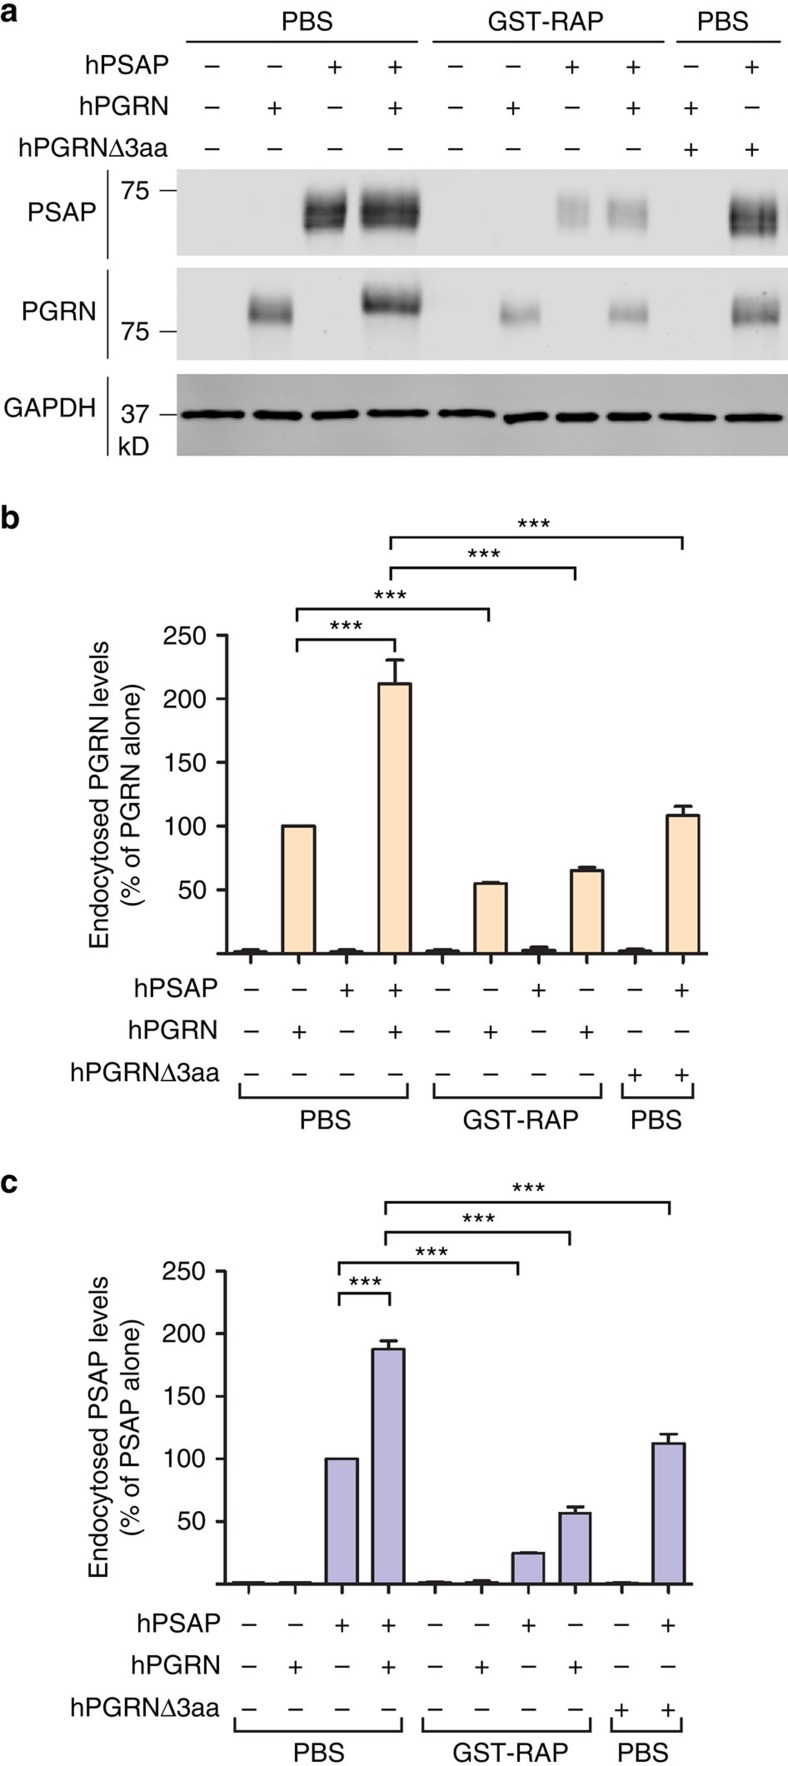
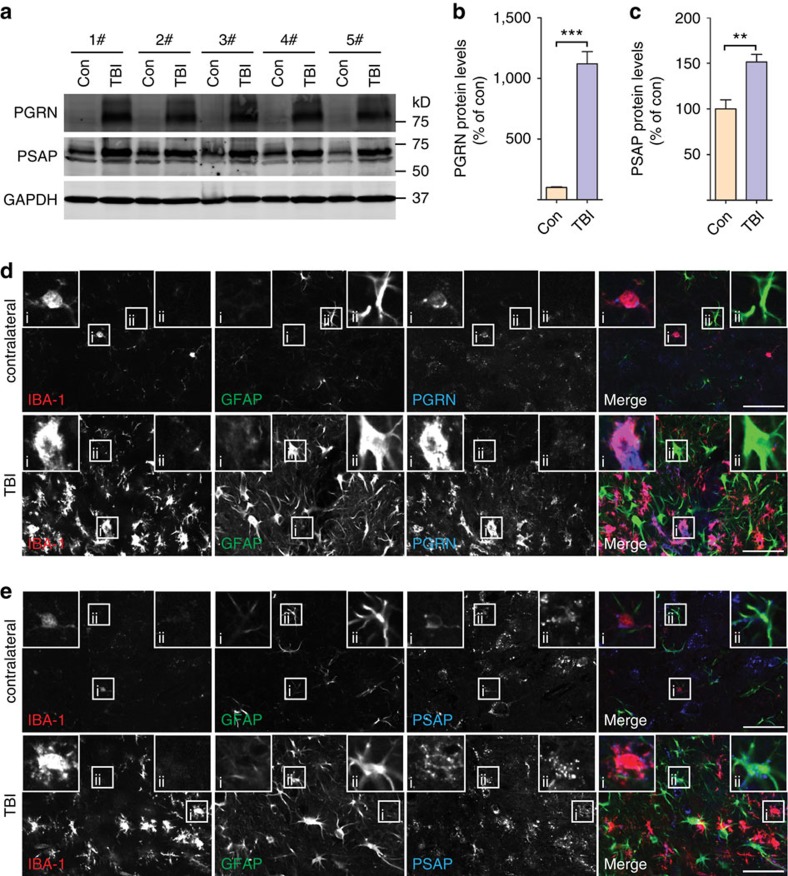
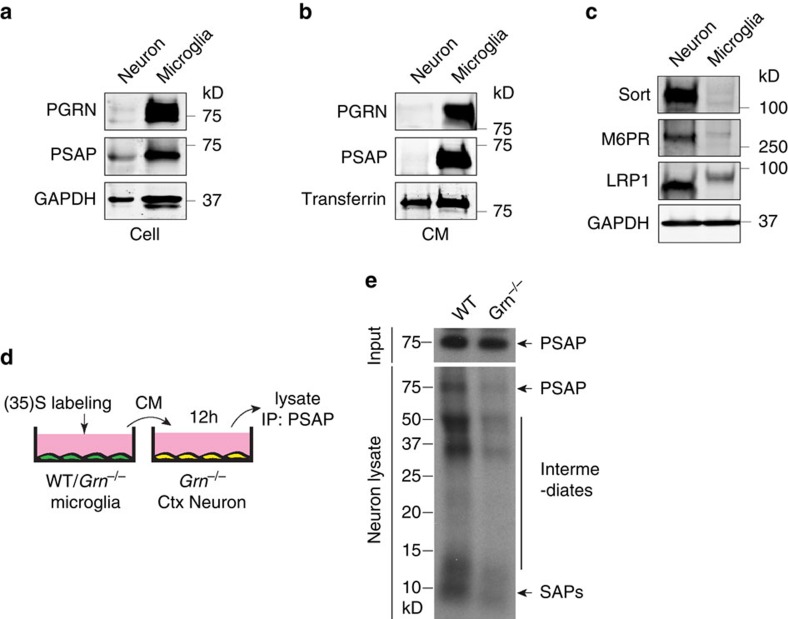
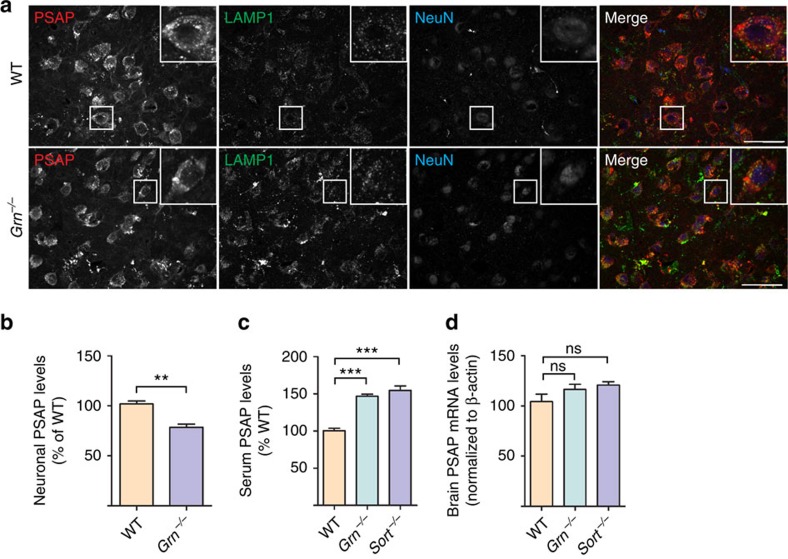
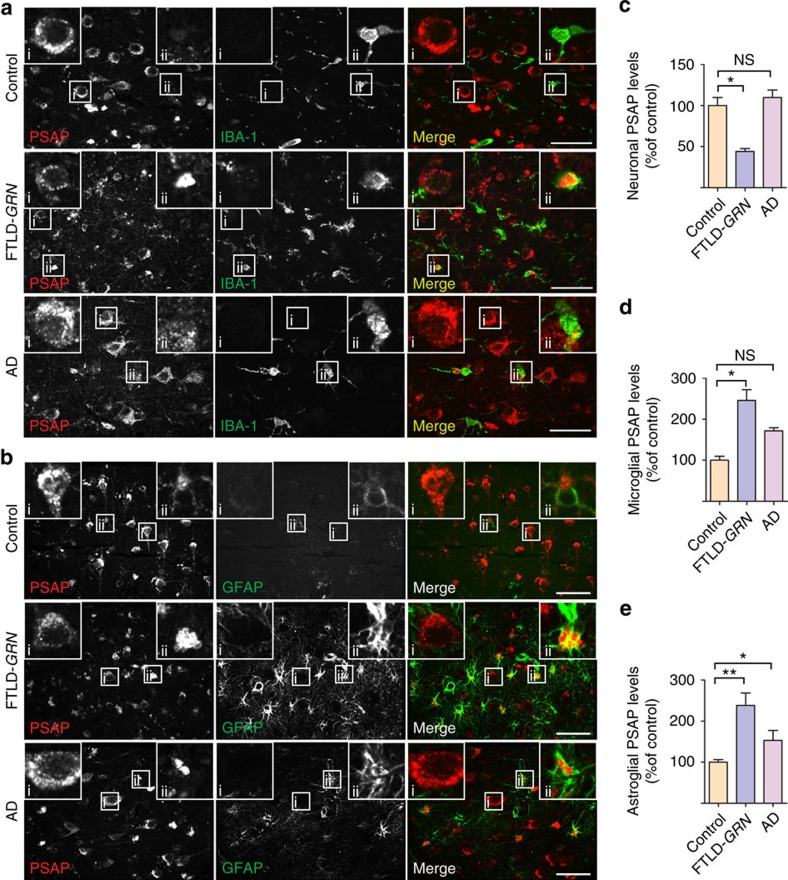
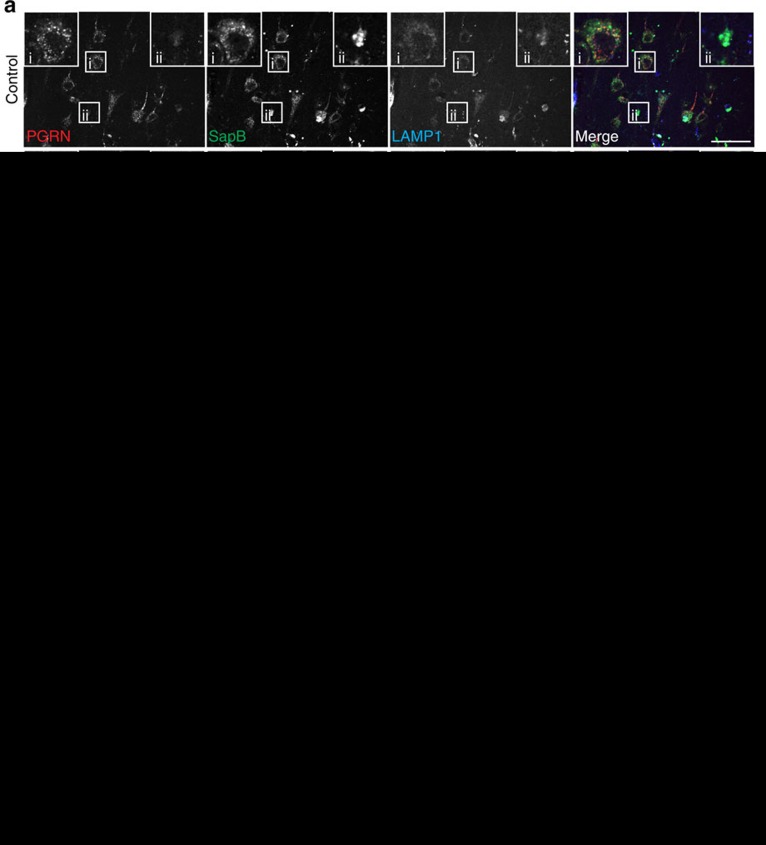
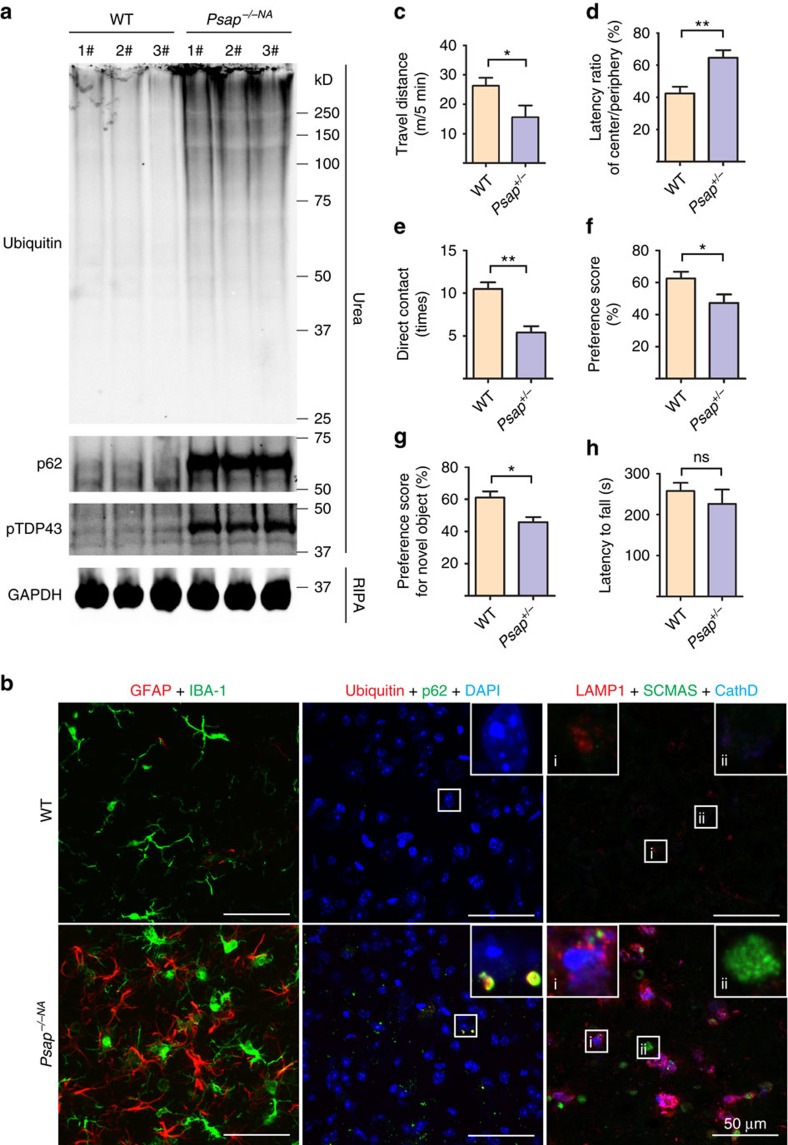
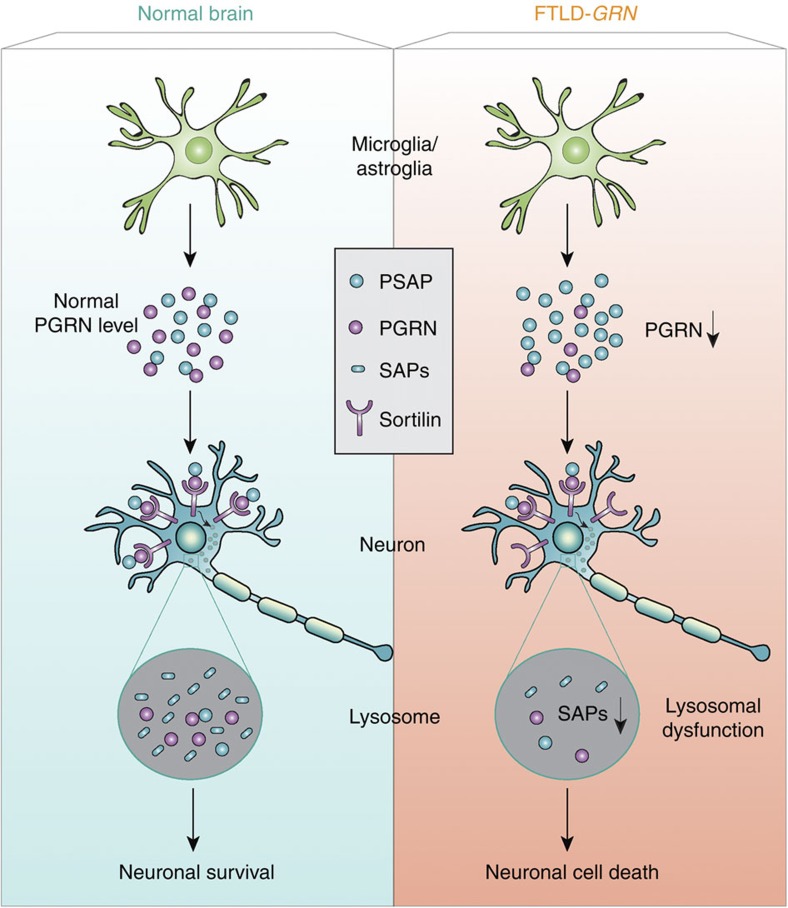
Haploinsufficiency of progranulin (PGRN) due to mutations in the granulin (GRN) gene causes frontotemporal lobar degeneration (FTLD), and complete loss of PGRN leads to a lysosomal storage disorder, neuronal ceroid lipofuscinosis (NCL). Accumulating evidence suggests that PGRN is essential for proper lysosomal function, but the precise mechanisms involved are not known. Here, we show that PGRN facilitates neuronal uptake and lysosomal delivery of prosaposin (PSAP), the precursor of saposin peptides that are essential for lysosomal glycosphingolipid degradation. We found reduced levels of PSAP in neurons both in mice deficient in PGRN and in human samples from FTLD patients due to GRN mutations. Furthermore, mice with reduced PSAP expression demonstrated FTLD-like pathology and behavioural changes. Thus, our data demonstrate a role of PGRN in PSAP lysosomal trafficking and suggest that impaired lysosomal trafficking of PSAP is an underlying disease mechanism for NCL and FTLD due to GRN mutations.


Conflict of interest statement

The authors declare no competing financial interests.

Figures

Figure 1
Figure 1. PGRN bridges the interaction between PSAP and sortilin and facilitates lysosomal targeting of PSAP via sortilin.
(a) Myc-tagged PSAP-, PGRN- and sortilin (Sort)-expressing constructs were transfected into HEK293T cells as indicated. Cell lysates were subject to anti-myc immunoprecipitation and blotted with anti-sortilin, myc and PGRN antibodies. (b) PSAP, PGRN and myc-tagged sortilin (Sort)-expressing constructs were transfected into HEK293T cells as indicated. Cell lysates were subject to anti-myc immunoprecipitation and blotted with anti-sortilin, myc and PGRN antibodies. (c) COS-7 cells transfected with an empty vector (Vect) or sortilin (Sort)-expressing construct were incubated with AP-tagged PSAP alone or AP-PSAP with PGRN. Scale bar, 100 μm. (d) Sortilin-expressing COS-7 cells were treated with recombinant FLAG-PSAP (1 μg ml−1) and/or his-PGRN (1 μg ml−1) as indicated at 37 °C for 5 h. Cells were costained with anti-FLAG, anti-PGRN and anti-cathepsin D antibodies. Scale bar, 20 μm. (e) Sortilin-expressing COS-7 cells were incubated with radiolabelled CM containing PSAP with or without recombinant his-PGRN (1 μg ml−1) for 24 h before lysis and immunoprecipitation with anti-PSAP antibodies. The immunoprecipitation products were separated on tricine gels and visualized by radiography. (ae) The representative images from three independent experiments.
Figure 2
Figure 2. PGRN facilitates uptake and lysosomal targeting of PSAP in primary cortical neurons.
(a) Primary cortical neurons (DIV12) were incubated with AP-PSAP (50 nM) alone, or together with purified recombinant his-PSAP (10 μg ml−1), or his-PGRN (1 μg ml−1) as indicated. Scale bar, 50 μm. (b) Quantification of bound AP intensity of (a); n=3, ***P<0.001, **P<0.01, one-way analysis of variance (ANOVA). Data are presented as mean ±SEM. (c) Primary cortical neurons (DIV12) were treated with recombinant hPSAP (1 μg ml−1) and/or hPGRN (1 μg ml−1) for 16 h as indicated. Cells were stained with anti-mouse LAMP1, anti-human saposin B and anti-human PGRN antibodies. Scale bar, 20 μm. Representative images from three independent experiments were shown. (d) Primary cortical neurons (DIV12) were treated as in c. The cells were collected and subjected to immunoblotting with anti-human saposin B, anti-human PGRN and anti-β III tubulin antibodies. (e) Quantification of endocytosed neuronal PSAP and PGRN in (d), normalized to PSAP or PGRN alone. n=3, **, p<0.001, *, p<0.05, paired t-test. Data presented as mean±SEM. ***P<0.001, Student's t-test.
Figure 3
Figure 3. PGRN–sortilin interaction enhances PSAP uptake in primary cortical neurons.
(a) Primary cortical neurons (DIV12) were pretreated with either GST-RAP (50 μg ml−1) or PBS (control) for 30 min, and were then treated with recombinant hPSAP (1 μg ml−1) and/or hPGRN (1 μg ml−1), hPGRNΔ3aa (1 μg ml−1) in the presence or absence of GST-RAP (50 μg ml−1) for 16 h as indicated. (b) Quantification of endocytosed neuronal PGRN in (a), normalized to PGRN alone (set as 100%). n=3, ***, P<0.001, Repeated Measures ANOVA. Data are presented as mean±SEM.
Figure 4
Figure 4. Increased levels of PGRN and PSAP in activated glial cells on injury.
(a) Brain tissues from 6-month-old WT mouse 4 days after cortical stab wound injury were subjected to immunoblotting with anti-mouse PSAP, anti-mouse PGRN and anti-mouse GAPDH antibodies. TBI, injury hemisphere; Con, conterlateral hemisphere; n=5. (b) Quantification of PGRN levels in a; n=5, ***P<0.001, Student's t-test. Data are presented as mean±SEM. (c) Quantification of PSAP levels in a; n=5, **P<0.01, Student's t-test. Data are presented as mean±SEM. (d) Brain sections from 6-month-old WT mouse 4 days after cortical stab wound injury were costained with anti-IBA1 (marker for microglia), anti-GFAP (marker for astrocyte) and anti-PGRN antibodies as indicated. Representative image of microglia in shown in inset i and astrocyte in inset ii. Scale bar, 50 μm. (e) Brain sections from 6-month-old WT mouse 4 days after cortical stab wound injury were costained with anti-IBA1 (marker for microglia), anti-GFAP (marker for astrocyte) and anti-PSAP antibodies as indicated. Scale bar, 50 μm. Representative image of microglia in shown in inset i and astrocyte in inset ii. (d,e) The representative images from two different mice.
Figure 5
Figure 5. Microglial PGRN facilitates neuronal uptake of PSAP.
(a) Lysates from WT microglia and DIV12 cortical neurons were immunoblotted with anti-PGRN, anti-PSAP and anti-GAPDH antibodies. (b) Conditioned media (CM) from WT microglia and DIV12 neurons were immunoprecipitated with anti-PGRN, anti-PSAP or anti-transferrin antibodies and the IP products were subject to SDS–polyacrylamide gel electrophoresis (SDS-PAGE) and immunoblotting with corresponding antibodies. (c) Lysates from WT microglia and DIV12 cortical neurons were immunoblotted with anti-sortilin, anti-M6PR, anti-LRP1 and anti-GAPDH antibodies. (ac) are representative blots from two independent experiments. (df) Application of radiolabelled medium from WT microglia results in more PSAP uptake and processing in neurons than medium from Grn−/− microglia. WT and Grn−/− primary microglia were labelled with 35S-labelled methionine and 35S-labelled cysteine. Labelled media were applied to DIV12 cortical neurons from Grn−/− mice. After 12 h, neuronal lysates were prepared and subject to anti-PSAP immunoprecipitations (d). The immunoprecipitates were separated using tricine gels and visualized by radiography (e). Representative neuronal uptake of full-length PSAP in Grn−/− neurons and WT controls.
Figure 6
Figure 6. PGRN- and sortilin-deficient mice display PSAP trafficking defects.
(a) Representative images from immunostaining of 12–14-month-old brain sections of WT and Grn−/− mice with anti-mouse PSAP, LAMP1 and NeuN antibodies. Scale bar, 50 μm. (b) Quantification of immunofluorescence intensity of PSAP in neurons for images in a, n=4, **P<0.01, Student's t-test. (c) ELISA to measure PSAP levels in the serum of 6–8-month-old WT, Grn−/− and Sort−/− mice; n=5, ***P<0.001, one-way analysis of variance (ANOVA). (d) Quantitative PCR (qPCR) analysis of PSAP mRNA levels in the brain of 6–8-month-old WT, Grn−/− and Sort−/−mice; n=3, NS, not significant, one-way ANOVA. Data are presented as mean±SEM.
Figure 7
Figure 7. PSAP levels are increased in microglia and astrocytes but decreased in neurons in FTLD-GRN patients.
(a) Brain sections from control, FTLD-GRN and AD patients were stained with rat anti-PSAP and rabbit anti-IBA1 (marker for microglia) antibodies. A representative neuron was shown in inset i and a representative microglia was shown in inset ii. In contrast with increased PSAP levels in microglia, neuronal PSAP levels are much reduced in FTLD-GRN cases, but not in AD cases. Scale bar, 50 μm. (b) Brain sections from control, FTLD-GRN and AD patients were stained with rabbit anti-PSAP and mouse anti-GFAP (marker for astrocytes) antibodies. A representative astrocyte was shown in the inset. FTLD-GRN has many more activated astrocytes with high PSAP expression. Scale bar, 50 μm. (c) Quantification of neuronal PSAP levels in a; n=3, *P<0.05, NS, not significant, one-way analysis of variance (ANOVA). Data are presented as mean±SEM. (d) Quantification of microglial PSAP levels in a; n=3, *P<0.05, NS, not significant, one-way ANOVA. Data are presented as mean±SEM. (e) Quantification of astroglial PSAP levels in b; n=3, *P<0.05, **P<0.01, one-way ANOVA. Data are presented as mean±SEM.
Figure 8
Figure 8. PGRN haploinsufficiency results in reduced neuronal saposin B levels in patients with FTLD.
(a) Brain sections from controls and patients with FTLD-TDP due to GRN mutations, FTLD-tau and AD patients were stained with anti-PGRN, anti-saposin B and anti-LAMP1 antibodies. Scale bar, 50 μm. A representative neuron is shown in inset i and a representative glia cell is shown in inset ii. (b,c) Quantification of neuronal PGRN and PSAP signals in controls, FTLD-TDP due to GRN mutations, FTLD-tau and AD for experiment in a using Image J; n=3, *P<0.05; NS, not significant; one-way analysis of variance (ANOVA). Data are presented as mean±SEM. (d) Correlation between immunostaining intensity of neuronal PGRN and saposin B for experiment in a. Total of 703 neurons from controls, FTLD-TDP with GRN mutations, FTLD-tau and AD were quantified.
Figure 9
Figure 9. Partial loss of PSAP leads to FTLD-like phenotypes in mice.
(a) RIPA- and urea-soluble fractions from 6-month-old WT and Psap−/−NA brain were blotted with anti-ubiquitin, p62, phospho409/410 TDP-43 and GAPDH antibodies as indicated. (b) Brain sections from 6-month-old WT and Psap−/−NA mice were stained with anti-GFAP, anti-IBA1, anti-ubiquitin, anti-p62 or anti-SCMAS, anti-LAMP1 and anti-CathD antibodies as indicated. Scale bar, 50 μm. A representative glia cell with high LAMP1 levels is shown in inset i and a representative neuron is shown in inset ii for anti-SCMAS staining. The representative images from three mouse brains were shown. (c,d) Twelve-month-old WT and Psap+/− mice were subject to open-field test and Psap+/− mice shows significant reduction in travel distance and increase in latency in the centre arena. (e,f) Psap+/− mice show deficits in the sociability test. Data are presented as mean±SEM. (g) Psap+/− mice show deficits in the novel object test. (h) Psap+/− mice do not show any significant motor deficits in the rotarod test. For all the behavioural tests, WT, n=7; Psap+/−, n=6. *P<0.05; **P<0.01; NS, not significant.
Figure 10
Figure 10. A schematic drawing illustrating the proposed disease mechanism of FTLD with GRN mutations.
PGRN and PSAP are highly secreted by microglia and astrocytes. Through binding to sortilin on neuronal cell surface, PGRN facilitates neuronal uptake of extracellular PSAP. Lysosomal delivery of PSAP results in PSAP processing into individual saposins (SAPs), which helps maintain normal lysosomal function in neurons. PGRN mutations in FTLD results in reduced PGRN levels and thus less neuronal uptake of PSAP and reduced saposin levels in neuronal lysosomes, which leads to lysosomal dysfunction and eventually neuronal cell death and FTLD. PSAP receptors, LRP1 and M6PR, which mediates alternate pathways for PSAP lysosomal delivery, are not shown in the drawing.

Similar articles

Cited by

References

    1. Neary D. et al.. Frontotemporal lobar degeneration: a consensus on clinical diagnostic criteria. Neurology 51, 1546–1554 (1998). - PubMed
    1. Neumann M. et al.. Ubiquitinated TDP-43 in frontotemporal lobar degeneration and amyotrophic lateral sclerosis. Science 314, 130–133 (2006). - PubMed
    1. Arai T. et al.. TDP-43 is a component of ubiquitin-positive tau-negative inclusions in frontotemporal lobar degeneration and amyotrophic lateral sclerosis. Biochem. Biophys. Res. Commun. 351, 602–611 (2006). - PubMed
    1. Baker M. et al.. Mutations in progranulin cause tau-negative frontotemporal dementia linked to chromosome 17. Nature 442, 916–919 (2006). - PubMed
    1. Cruts M. et al.. Null mutations in progranulin cause ubiquitin-positive frontotemporal dementia linked to chromosome 17q21. Nature 442, 920–924 (2006). - PubMed

Publication types

MeSH terms