. 2017 May 25:8:15201.
doi: 10.1038/ncomms15201.

miR-29b contributes to multiple types of muscle atrophy

Affiliations

miR-29b contributes to multiple types of muscle atrophy

Jin Li et al. Nat Commun. .

Abstract

A number of microRNAs (miRNAs, miRs) have been shown to play a role in skeletal muscle atrophy, but their role is not completely understood. Here we show that miR-29b promotes skeletal muscle atrophy in response to different atrophic stimuli in cells and in mouse models. miR-29b promotes atrophy of myotubes differentiated from C2C12 or primary myoblasts, and conversely, its inhibition attenuates atrophy induced by dexamethasone (Dex), TNF-α and H2O2 treatment. Targeting of IGF-1 and PI3K(p85α) by miR-29b is required for induction of muscle atrophy. In vivo, miR-29b overexpression is sufficient to promote muscle atrophy while inhibition of miR-29b attenuates atrophy induced by denervation and immobilization. These data suggest that miR-29b contributes to multiple types of muscle atrophy via targeting of IGF-1 and PI3K(p85α), and that suppression of miR-29b may represent a therapeutic approach for muscle atrophy induced by different stimuli.


Conflict of interest statement

The authors declare no competing financial interests.

Figures
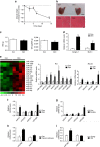
Figure 1
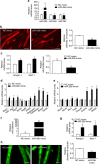
Figure 1. miR-29b is increased in multiple types of muscle atrophy in vivo.
(a) A time course of mass loss in the rat medial gastrocnemius muscle was examined in denervation model (n=5 per group). (b) Denervation-induced marked muscle atrophy as determined by gastrocnemius muscle morphology (scale bar, 1 cm) and haematoxylin–eosin (HE) staining for muscle fibres (n=5 per group, scale bar, 100 μm). (c) Gastrocnemius muscle weight (GW) and gastrocnemius muscle weight/body weight (GW/BW) ratio were both reduced in denervation rats (n=5 per group). (d) qRT–PCR analysis showed increased Atrogin-1 and Murf-1 expressions in gastrocnemius muscle from denervation rats compared to controls (n=5 per group). (e) miRNA arrays showed dysregulated miRNAs in gastrocnemius muscle from denervation rat model and qRT–PCR analysis of miRNA expressions in both rat and mouse models of denervation-induced muscle atrophy (n=4 per group). (fi) qRT–PCR analysis of miRNA expressions showed increased miR-29b in gastrocnemius muscle from dexamethasone (Dex)-, fasting-, cancer cachexia- and ageing-induced mouse muscle atrophy models (n=5 for Dex, 5 for fasting, 5 for cancer cachexia and 4 for ageing). Con, Control. Den, Denervation. Error bars, s.e.m. An unpaired, two-tailed Student's t-test was used for comparisons between two groups. *P<0.05, **P<0.01.
Figure 2
Figure 2. miR-29b is increased in multiple types of muscle atrophy in vitro.
(a) Immunofluorescent staining for C2C12 myotubes showed that Dex (50 μM)-induced muscle atrophy as evidenced by reduced myotube diameter, accompanied with increased Atrogin-1, Murf-1 and miR-29b expressions (n=4 per group, scale bar, 100 μm). (b) Immunofluorescent staining for myotubes differentiated from primary myoblasts showed that Dex (50 μM)-induced muscle atrophy as evidenced by reduced myotube diameter, accompanied with increased Atrogin-1, Murf-1 and miR-29b expressions (n=4 per group, scale bar, 100 μm). Dex, dexamethasone. Error bars, s.e.m. An unpaired, two-tailed Student's t-test was used for comparisons between two groups. *P<0.05, **P<0.01.
Figure 3
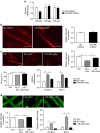
Figure 3. miR-29b is sufficient to induce muscle atrophy in vitro.
(a) qRT–PCR analysis showed increased miR-29b, but not miR-29a or miR-29c expressions, in C2C12 myotubes transfected with miR-29b mimic compared to negative control (NC mimic) (n=6 per group). (b) Immunofluorescent staining for myotubes showed decreased myotube diameter in C2C12 myotubes transfected with miR-29b mimic (n=4 per group, scale bar, 100 μm). (c) qRT–PCR analysis showed upregulated Atrogin-1 and Murf-1, but downregulated MHC expressions in C2C12 myotubes transfected with miR-29b mimic (n=6 per group). (d) qRT–PCR analysis showed increased autophagy-related gene expressions in C2C12 myotubes transfected with miR-29b mimic (n=6 per group). (e) qRT–PCR analysis showed upregulation of other ubiquitin ligases-related gene expressions in C2C12 myotubes transfected with miR-29b mimic (n=6 per group). (f) qRT–PCR analysis showed increased miR-29b expression in myotubes differentiated from primary myoblasts transfected with miR-29b mimic (n=6 per group). (g) qRT–PCR analysis showed increased Atrogin-1 and Murf-1 expressions when myotubes differentiated from primary myoblasts were transfected with miR-29b mimic (n=6 per group). (h) Immunofluorescent staining for myotubes differentiated from primary myoblasts showed that myotube diameter was decreased after transfected with miR-29b mimic (n=4 per group, scale bar, 100 μm). Error bars, s.e.m. An unpaired, two-tailed Student's t-test was used for comparisons between two groups. *P<0.05, **P<0.01.
Figure 4
Figure 4. miR-29b is necessary for muscle atrophy in vitro.
(a) qRT–PCR analysis showed decreased miR-29b, but not miR-29a or miR-29c expressions, in C2C12 myotubes transfected with miR-29b inhibitor compared to negative control (NC inhibitor) (n=6 per group). (b) Immunofluorescent staining for myotubes showed no difference in myotube diameter when C2C12 myotubes were transfected with NC inhibitor and miR-29b inhibitor (n=4 per group, scale bar, 100 μm). (c) miR-29b inhibition abolished Dex (50 μM)-induced muscle atrophy in C2C12 myotubes, as determined by myotube diameter (n=4 per group, scale bar, 100 μm), creatine kinase (CK) activity (n=6 per group) and Atrogin-1 and Murf-1 mRNA levels (n=6 per group). (d) miR-29b inhibition abolished Dex (50 μM)-induced muscle atrophy in myotubes differentiated from primary myoblasts, as determined by myotube diameter (n=4 per group, scale bar, 100 μm), and Atrogin-1 and Murf-1 mRNA levels (n=6 per group). Dex, dexamethasone. Error bars, s.e.m. An unpaired, two-tailed Student's t-test was used for comparisons between two groups (a,b). One-way ANOVA test was performed to compare multiple groups followed by Bonferroni's post hoc test (c,d). *P<0.05, **P<0.01.
Figure 5
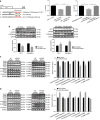
Figure 5. IGF-1 and PI3K(p85α) are identified as two target genes of miR-29b.
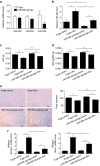
(a) TargetScan and Luciferase reporter assay showed that IGF-1 and PI3K(p85α) were two direct targets of miR-29b (n=5 per group). (b) Western blot showed that miR-29b negatively regulated IGF-1 and PI3K(p85α) in C2C12 myotubes (n=3 per group). (c) Western blot analysis for the AKT/FOXO3A/mTOR pathway (AKT, FOXO3A, mTOR, P70S6K, 4EBP1) showed decreased phosphorylation levels of AKT (S473), FOXO3A (S253), mTOR and P70S6K in C2C12 myotubes transfected with miR-29b mimic (n=3 per group). (d) Western blot analysis for the AKT/FOXO3A/mTOR pathway (AKT, FOXO3A, mTOR, P70S6K, 4EBP1) showed increased phosphorylation levels of AKT (S473), FOXO3A (S253), mTOR and P70S6K in C2C12 myotubes transfected with miR-29b inhibitor (n=3 per group). Error bars, s.e.m. The presented blots are representative samples of three independent experiments. An unpaired, two-tailed Student's t-test was used for comparisons between two groups (bd). One-way ANOVA test was performed to compare multiple groups followed by Bonferroni's post hoc test (a). *P<0.05, **P<0.01.
Figure 6
Figure 6. IGF-1 and PI3K(p85α) reduce miR-29b-induced muscle atrophy.
(a) Immunofluorescent staining for C2C12 myotubes showed that overexpression of IGF-1 or PI3K(p85α) reduced muscle atrophy induced by miR-29b mimic (n=4 per group, scale bar, 100 μm). (b) qRT–PCR analysis showed that overexpression of IGF-1 or PI3K(p85a) reduced miR-29b-induced upregulation of Atrogin-1 and Murf-1 in C2C12 myotubes (n=6 per group). Error bars, s.e.m. One-way ANOVA test was performed to compare multiple groups followed by Bonferroni's post hoc test. *P<0.05, **P<0.01.
Figure 7
Figure 7. YY1 negatively regulates miR-29b in muscle atrophy.
(a) qRT–PCR analysis showed downregulated IGF-1 but not miR-29b expression in C2C12 myotubes transfected with IGF-1 siRNAs compared to negative control (NC siRNA) (n=6 per group). (b) qRT–PCR analysis showed down-regulated Yy1 while upregulated miR-29b expressions in C2C12 myotubes transfected with Yy1 siRNAs compared to negative control (NC siRNA) (n=6 per group). (c) qRT–PCR analysis showed decreased Yy1 mRNA level in the gastrocnemius from Den-, Dex- and fasting-induced muscle atrophy models (n=5 per group). (d) Western blot analysis showed decreased YY1 protein level in the gastrocnemius from Den-, Dex- and fasting-induced muscle atrophy models (n=3 per group). (e) Immunofluorescent staining for C2C12 myotubes showed decreased myotube diameter when transfected with Yy1 siRNAs (n=4 per group, scale bar, 100 μm). (f) qRT–PCR analysis showed increased Atrogin-1 and Murf-1 expressions when C2C12 myotubes were transfected with Yy1 siRNAs (n=6 per group). Den, Denervation; Dex, dexamethasone. Error bars, s.e.m. The presented blots are representative samples of three independent experiments. An unpaired, two-tailed Student's t-test was used for comparisons between two groups (c,d). One-way ANOVA test was performed to compare multiple groups followed by Bonferroni's post hoc test (a,b,e,f). *P<0.05, **P<0.01.
Figure 8
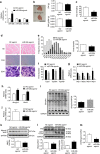
Figure 8. miR-29b is sufficient to induce muscle atrophy in vivo.
(a) qRT–PCR analysis showed increased miR-29b, but not miR-29a or miR-29c expressions, in mice treated with miR-29b agomir compared to negative control (NC agomir) (n=5 per group). (b) miR-29b agomir induced muscle atrophy, as determined by gastrocnemius muscle morphology, gastrocnemius weight (GW) and gastrocnemius weight/body weight (GW/BW) ratio (n=5 per group, scale bar, 1 cm). (c) The grip strength of right hind limb was reduced in miR-29b agomir-treated mice (n=5 per group). (d) miR-29b agomir-induced muscle atrophy was also evidenced by haematoxylin–eosin (HE) staining, periodic acid-schiff (PAS) staining and succinate dehydrogenase (SDH) staining (n=5 per group, scale bar, 50 μm). (e) Quantification of muscle fibre diameter distribution confirmed that miR-29b agomir induced muscle atrophy (n=5 per group). (f) Quantification of diameter of different myofibre types showed that all types of fibres underwent atrophy in miR-29b agomir-treated mice (n=5 per group). (g) qRT–PCR analysis showed decreased Myh1, Myh2, Myh4 and Myh7 expressions in mice treated with miR-29b agomir (n=5 per group). (h) qRT–PCR analysis showed upregulated Atrogin-1 and Murf-1 expressions in mice treated with miR-29b agomir (n=5 per group). (i) Western blot analysis showed upregulation of Ubiquitin protein expressions in mice treated with miR-29b agomir (n=3 per group). (j) qRT–PCR analysis showed downregulated MHC in mice treated with miR-29b agomir (n=5 per group). (k) Western blot analysis showed reduced MHC protein level in mice treated with miR-29b agomir (n=3 per group). (l) Western blot analysis showed downregulated P62 but up-regulated LC3-II protein levels in mice treated with miR-29b agomir (n=3 per group). (m) qRT–PCR analysis showed that mtDNA copy number was decreased in miR-29b agomir-treated mice (n=5 per group). Age- and sex-matched mice were used for experiments randomly. Error bars, s.e.m. An unpaired, two-tailed Student's t-test was used for comparisons between two groups. *P<0.05, **P<0.01.
Figure 9
Figure 9. miR-29b is necessary for muscle atrophy in vivo.
(a) qRT–PCR analysis showed reduced miR-29b, but not miR-29a or miR-29c expressions, in mice treated with miR-29b sponge compared to fugw control (n=5 per group). (b) qRT–PCR analysis showed reduced miR-29b expression level in miR-29b sponge-treated mice in the presence or absence of denervation (Den) (n=5 per group). (c,d) Gastrocnemius weight (GW) and gastrocnemius weight/body weight (GW/BW) ratio showed that miR-29b sponge at least partly blocked denervation-induced muscle atrophy (n=5 per group). (e) Haematoxylin–eosin (HE) staining demonstrated increased muscle fibre diameter in denervated mice treated with miR-29b sponge compared to those treated with fugw control (n=5 per group, scale bar, 50 μm). (f) qRT–PCR analysis showed downregulated Atrogin-1 and Murf-1 expressions in denervated mice treated with miR-29b sponge compared to those treated with fugw control (n=5 per group). Age- and sex-matched mice were used for experiments randomly. Error bars, s.e.m. An unpaired, two-tailed Student's t-test was used for comparisons between two groups (a). One-way ANOVA test was performed to compare multiple groups followed by Bonferroni's post hoc test (bf). *P<0.05, **P<0.01.

Similar articles

Cited by

References

    1. Bodine S. C. et al.. Identification of ubiquitin ligases required for skeletal muscle atrophy. Science 294, 1704–1708 (2001). - PubMed
    1. Cohen S., Nathan J. A. & Goldberg A. L. Muscle wasting in disease: molecular mechanisms and promising therapies. Nat. Rev. Drug. Discov. 14, 58–74 (2015). - PubMed
    1. Ebert S. M. et al.. Stress-induced skeletal muscle Gadd45a expression reprograms myonuclei and causes muscle atrophy. J. Biol. Chem. 287, 27290–27301 (2012). - PMC - PubMed
    1. Andres-Mateos E. et al.. Activation of serum/glucocorticoid-induced kinase 1 (SGK1) is important to maintain skeletal muscle homeostasis and prevent atrophy. EMBO Mol. Med. 5, 80–91 (2013). - PMC - PubMed
    1. Dutt V., Gupta S., Dabur R., Injeti E. & Mittal A. Skeletal muscle atrophy: potential therapeutic agents and their mechanisms of action. Pharmacol. Res. 99, 86–100 (2015). - PubMed

Publication types