. 2017 Jul 1;140(7):1900-1913.
doi: 10.1093/brain/awx113.

Loss of 'homeostatic' microglia and patterns of their activation in active multiple sclerosis

Affiliations

Loss of 'homeostatic' microglia and patterns of their activation in active multiple sclerosis

Tobias Zrzavy et al. Brain. .

Abstract

Microglia and macrophages accumulate at the sites of active demyelination and neurodegeneration in the multiple sclerosis brain and are thought to play a central role in the disease process. We used recently described markers to characterize the origin and functional states of microglia/macrophages in acute, relapsing and progressive multiple sclerosis. We found microglia activation in normal white matter of controls and that the degree of activation increased with age. This microglia activation was more pronounced in the normal-appearing white matter of patients in comparison to controls and increased with disease duration. In contrast to controls, the normal-appearing white matter of patients with multiple sclerosis showed a significant reduction of P2RY12, a marker expressed in homeostatic microglia in rodents, which was completely lost in active and slowly expanding lesions. Early stages of demyelination and neurodegeneration in active lesions contained microglia with a pro-inflammatory phenotype, which expressed molecules involved in phagocytosis, oxidative injury, antigen presentation and T cell co-stimulation. In later stages, the microglia and macrophages in active lesions changed to a phenotype that was intermediate between pro- and anti-inflammatory activation. In inactive lesions, the density of microglia/macrophages was significantly reduced and microglia in part converted to a P2RY12+ phenotype. Analysis of TMEM119, which is expressed on microglia but not on recruited macrophages, demonstrated that on average 45% of the macrophage-like cells in active lesions were derived from the resident microglia pool. Our study demonstrates the loss of the homeostatic microglial signature in active multiple sclerosis with restoration associated with disease inactivity.

Keywords: demyelination; macrophages; microglia; multiple sclerosis; neurodegeneration.


Figures

Figure 1
Figure 1
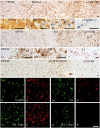
Patterns of microglia and macrophage reaction in different types of multiple sclerosis lesions. (A–E) Active lesion following pattern III demyelination as defined by Lucchinetti et al. (2000) in a patient with acute multiple sclerosis; (A) low magnification image depicting the distribution and morphology of Iba1-positive cells in different zones of the active lesions including the peri-plaque white matter (PPWM), the initial ‘pre-phagocytic’ lesion area (INITIAL), the early active (EA) and the late active (LA) lesion zones and the macrophage-containing inactive lesion centre (CENTER). There is already profound microglia activation in the initial lesion areas and these cells are transformed into or replaced by macrophage-like cells in the areas, where myelin has been destroyed (early active, late active and centre); the myelin pathology in these different lesion areas are shown in B–E; normal myelin and glia are seen in the PPWM (B). In the initial area myelin is still preserved, but there is some oedema and many oligodendrocytes show nuclear condensation and chromatin margination reflecting apoptosis (C). In the early active zone, myelin is lost, but there are many macrophages with intracytoplasmic myelin degradation products reactive for MOG (D). No myelin or MOG reactivity is seen in the demyelinated lesion centre, but there are still many macrophages with empty vacuoles reflecting the neutral lipid stage of myelin degradation (E). (F–I) Active lesion following pattern II demyelination as defined by Lucchinetti et al. (2000) in a patient with acute multiple sclerosis. (F) Low magnification image depicting the distribution and morphology of Iba1-positive cells in different zones of the active lesions, including the peri-plaque white matter, the early active and the late active lesion zones and the macrophage-containing inactive lesion centre. In contrast to pattern III lesions, there is no zone of initial demyelination with oligodendrocyte apoptosis; in contrast, microglia density is reduced in a small zone surrounding the actively demyelinating lesion area (F and G) possibly due to recruitment of peri-plaque microglia to the site of active demyelination (early active and late active zones), the actively demyelinating area is characterized by a high density of cells with macrophage phenotype (F), which contain early myelin degradation products (H). In addition, there is deposition of activated complement (C9neo antigen) at the sites of active demyelination in these lesions (I). (J) Slowly expanding lesion in a patient with secondary progressive multiple sclerosis; low magnification image depicting the distribution and morphology of Iba1-positive cells in different zones of the active lesions including the peri-plaque white matter, the active lesion edge and the inactive lesion centre. An increased density of Iba1-positive cells with a phenotype of activated microglia is seen at the active edge; in contrast, there are only very few Iba1-positive microglia-like cells in the inactive lesion centre; the insert shows a macrophage with early myelin degradation products. (K–R) Double staining for Iba1 (green) and TMEM119 (red) shows co-expression of these molecules in most cells in the normal-appearing white matter (K and L) and the active edge of slowly expanding lesions (O and P), while TMEM119 is expressed only in a subset of cells with macrophage or microglia phenotype in early active multiple sclerosis lesions (M and N). In the centre of classical active lesions and slowly expanding lesions (SEL) Iba1-positive macrophages can be present, which are negative for TMEM119 (Q and R). Scale bars = 100 µm.
Figure 2
Figure 2
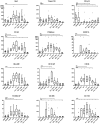
Quantitative evaluation of microglia/macrophages expressing different phenotypic markers in multiple sclerosis lesions. Following immunohistochemistry for the respective microglia/macrophage markers, the numbers of positive cells were quantified as described in the ‘Materials and methods’ section. Overall, Iba1-positive macrophages and microglia cells are similar in numbers in the normal white matter of controls and in the normal-appearing white matter of patients with multiple sclerosis. In active lesions, these cells increase already in initial lesion stages (when present in pattern III lesions) and reach their peak in early/late active lesion areas. Numerous macrophages are still present in the inactive lesion centre of these plaques. Slowly expanding lesions are surrounded by a rim of microglia cells with some intermingled macrophages and have only very few microglia or macrophages in the inactive lesion centre. A similar quantitative profile is seen for the pro-inflammatory markers CD68 (phagocytosis), p22phox (oxidative burst) and the molecules involved in antigen presentation and co-stimulation (HLA-D, HC10 and CD86). P2RY12, the marker associated with the homeostatic state of microglia in rodents is completely lost in active lesion stages, but reappears on microglia in the centre of inactive lesions. Putative M2 markers (CD163 and CD206) have their peak of expression in late active/ inactive lesions, although their expression patterns were highly variable from case to case. TMEM119 is expressed in about half of microglia and macrophages in active lesions and further decreases in the inactive lesion centres. The values for Iba1, TMEM119, P2RY12, CD68, p22phox, iNOS, HLADR, CD86, CD206 and CD163 are cells per mm2 and thus the numbers in the y-axis are directly comparable. Due to the expression of the respective antigens in other cells in addition to microglia, the values for HC10 (MHC Class I) and ferritin were obtained by quantitative densitometry and are, thus, not directly comparable with the numerical counts for the other markers. WMC = white matter of controls; NAWM = normal-appearing white matter of multiple sclerosis patients; Initial = initial lesions [‘pre-phagocytic’ lesions (Barnett and Prineas, 2004)]; EA = early active lesions; LA = late active lesions; Act. center = macrophage-rich centre of active lesions; SEL: edge = active edge of smouldering lesions; SEL: core = lesion centre of smouldering lesions; Inac. lesions = inactive lesions.
Figure 3
Figure 3
Expression of microglia genes in normal-appearing white matter, initial ‘pre-phagocytic’ lesion areas and the macrophage-rich centre of classical active multiple sclerosis lesions in comparison to normal white matter of controls. The respective lesion areas were microdissected from active lesions from four patients with acute multiple sclerosis following pattern III of demyelination according to Lucchinetti et al. (2000). Expression levels are provided as fold changes in comparison to those in normal white matter of controls. The microglia genes were grouped according to their functional designation provided by aButovsky et al. (2014); bChiu et al. (2013); cHickman et al. (2013); and dGautier et al. (2012). NWM = normal white matter of controls; NAWM = normal-appearing white matter of multiple sclerosis patients; IL = lesion edge containing initial (pre-phagocytic) and early active lesion areas; AL = centre of active lesions highly infiltrated by foamy macrophages.
Figure 4
Figure 4
Co-expression of microglia/macrophage markers in multiple sclerosis lesions. (A–J) Double staining for P2RY12 (green) and TMEM119 (red) shows that in the normal white matter of controls most microglia co-express P2RY12, although there are some, which are single positive for TMEM119 (A). In the normal-appearing white matter of multiple sclerosis a similar pattern as in control normal white matter is seen, but some of the TMEM119 single positive cells have a macrophage-like phenotype (B and insetC). P2RY12 is massively reduced in TMEM119+ cells in initial lesions (D and insetE) and there is a further reduction of P2RY12 expression in early active lesions, which still contain high numbers of TMEM119+ cells (F) and in the active centre of active lesions, which contain only few TMEM119+ cells (G). In inactive lesions, only few microglia-like cells are seen, but the majority of these cells co-express P2RY12 and TMEM119 (H). The insetsI and J show the expression of both antigens in a single double stained cell. (K–S) In the normal white matter of controls, the majority of microglia identified by the expression of P2RY12 (K) or TMEM119 (L) were activated and also expressed the phagocytosis-associated marker CD68. (M) An example of the normal-appearing white matter of an multiple sclerosis patient with numerous TMEM119+ microglia cells, while CD163 expression is restricted to perivascular macrophages. In N, activated microglia in initial lesion areas of a pattern III lesion are shown, which co-express TMEM119 and CD68. The edge of an active pattern III lesion is shown in O. In the initial lesion areas, most microglia cells express p22phox (NADPH oxidase) but are negative for CD163, although some microglia co-express both antigens (inset). In the early active lesion edge, there is still a dominant expression of p22phox, while co-expression of p22phox with CD163 increases towards the more advanced lesion parts. A similar profile is shown in P, which documents that CD206 appears in p22phox-positive macrophages predominately in advanced lesion stages. (Q–S) The expression profile of the markers in macrophages in the inactive lesion centre of active plaques. Some of the CD68+ (Q) or CD206+ macrophages (R) are co-labelled with TMEM119. In addition, some pro-inflammatory activated macrophages positive for p22phox co-express the anti-inflammatory M2 marker CD206 (S). Scale bars = 100 µm.

Similar articles

Cited by

References

    1. Andersen CB, Stodkilde K, Saederup KL, Kuhlee A, Raunser S, Graversen JH. et al. Haptoglobin. Antioxid Redox Signal 2017; 26: 814–31. - PubMed
    1. Babinski J. Recherches sur l’anatomie pathologique de la sclerose en plaque et étude comparative des diverses variétés de la scleroses de la moelle. Arch Physiol 1885; 5: 186–207.
    1. Barnett MH, Prineas JW. Relapsing and remitting multiple sclerosis: pathology of the newly forming lesion. Ann Neurol 2004; 55: 458–68. - PubMed
    1. Bauer J, Lassmann H. Neuropathological techniques to investigate central nervous system sections in multiple sclerosis. Methods Mol Biol 2016; 1304: 211–29 - PubMed
    1. Bennett ML, Bennett FC, Liddelow SA, Ajami B, Zamanian JL, Fernhoff NB. et al. New tools for studying microglia in the mouse and human CNS. Proc Natl Acad Sci USA 2016; 113: E1738–46. - PMC - PubMed