. 2017 Jul 27;45(13):7855-7869.
doi: 10.1093/nar/gkx480.

Interlinked DNA nano-circles for measuring topoisomerase II activity at the level of single decatenation events

Affiliations

Interlinked DNA nano-circles for measuring topoisomerase II activity at the level of single decatenation events

Emil L Kristoffersen et al. Nucleic Acids Res. .

Abstract

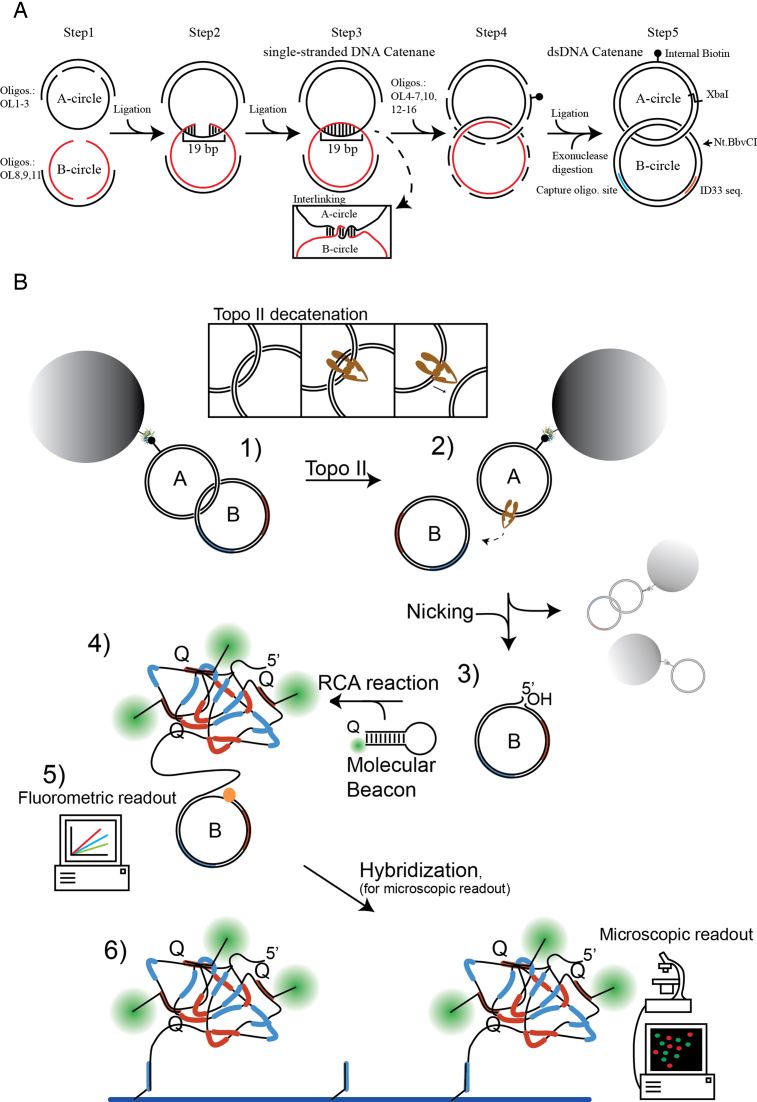
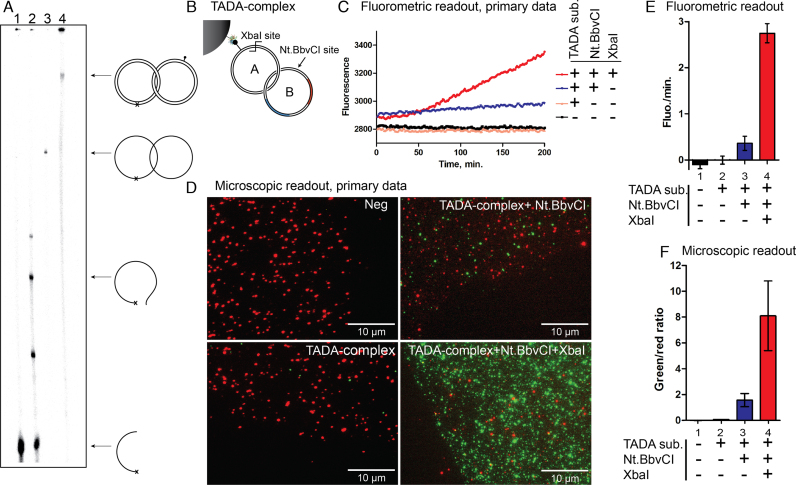
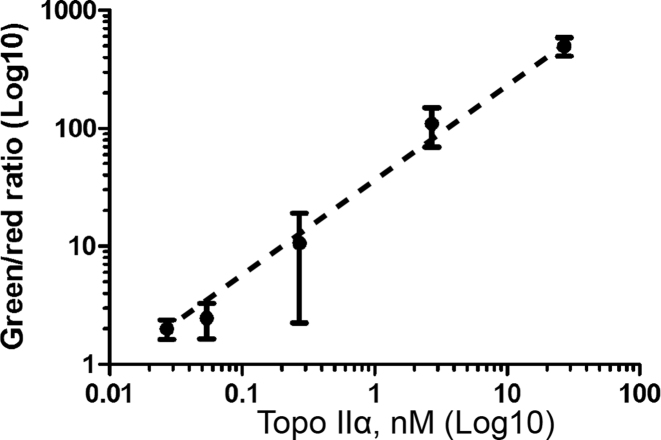
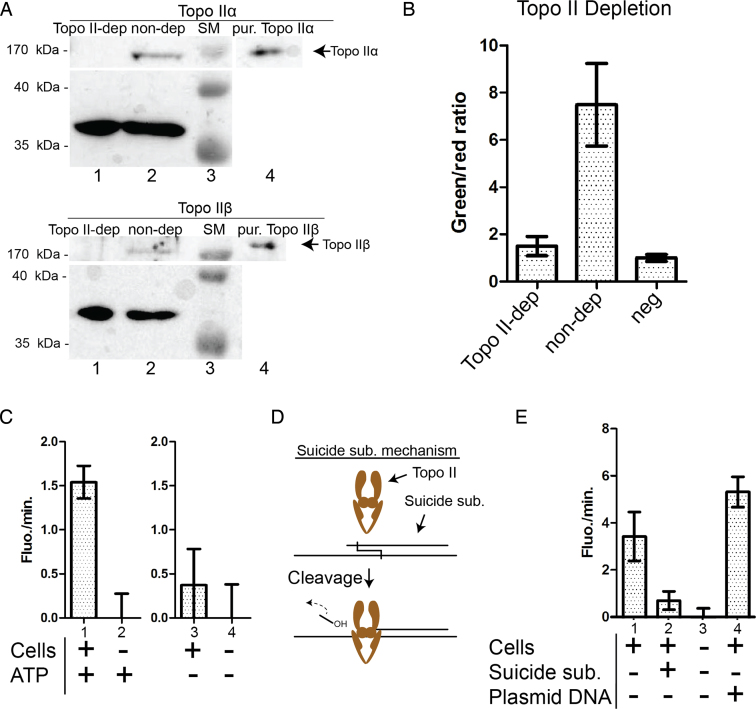
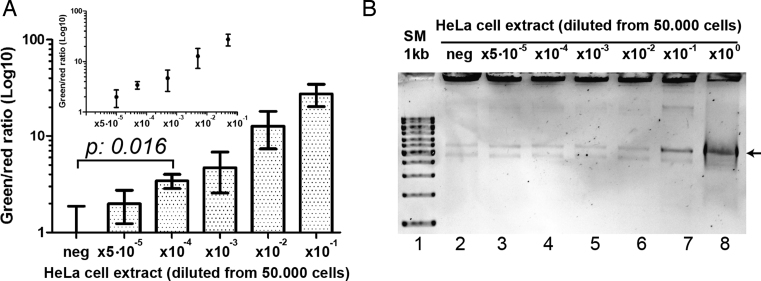
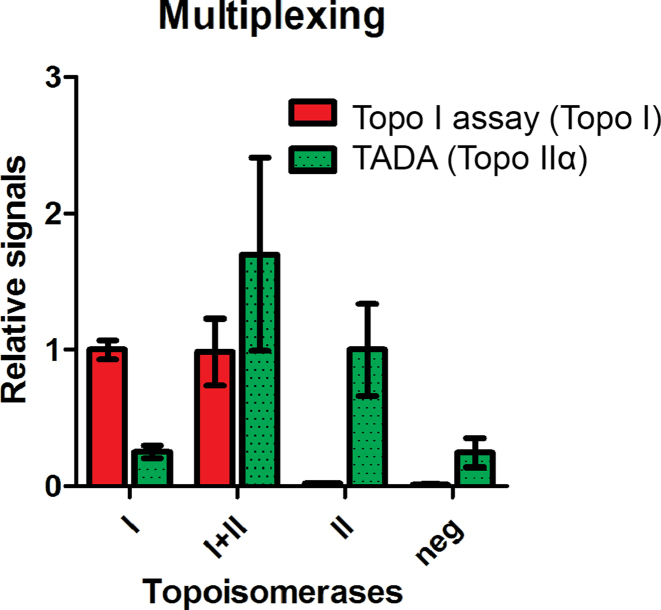
DNA nano-structures present appealing new means for monitoring different molecules. Here, we demonstrate the assembly and utilization of a surface-attached double-stranded DNA catenane composed of two intact interlinked DNA nano-circles for specific and sensitive measurements of the life essential topoisomerase II (Topo II) enzyme activity. Topo II activity was detected via the numeric release of DNA nano-circles, which were visualized at the single-molecule level in a fluorescence microscope upon isothermal amplification and fluorescence labeling. The transition of each enzymatic reaction to a micrometer sized labeled product enabled quantitative detection of Topo II activity at the single decatenation event level rendering activity measurements in extracts from as few as five cells possible. Topo II activity is a suggested predictive marker in cancer therapy and, consequently, the described highly sensitive monitoring of Topo II activity may add considerably to the toolbox of individualized medicine where decisions are based on very sparse samples.


Figures

Figure 1.
Figure 1.
Outline of the TADA setup. (A) Step 1: To generate the 220 or 221 nt long oligonucleotides that constitute one strand of each of the double-stranded circles of the dsDNA catenane substrate, two parallel hybridization reactions were performed; one for the A-circle (with oligonucleotides OL1–OL3) and one for the B-circle (with oligonucleotides OL8, OL9 and OL11). Step 2: Addition of T4 DNA ligase followed by mixing of the two reaction products results in formation of the structure shown in Step 2. Here the B-circle hybridizes to the A-circle in a stretch of 19 bp. Step 3: Due to the double helical structure of duplex DNA, which has a periodicity of ∼10.5 bp/link, the ligation in Step 2 will result in interlinking of the A-circle and the B-circle. The resulting interlinked structure, termed the single-stranded DNA catenane, is shown in Step 3. The box illustrates the interlinked A- and B-circles with topological resolution. Step 4: After formation of the single-stranded DNA catenane, complementary oligonucleotides for the A-circle (OL4–OL7) and complementary oligonucleotides for the B-circle (OL10, OL12–OL16) were hybridized to the single-stranded DNA catenane. Step 5: The oligonucleotides were ligated to form the dsDNA catenane. The black circle illustrates a biotin that is internally attached to one of the complementary oligonucleotides. (B) Schematic illustration of the TADA work flow. 1) The dsDNA catenane was attached to streptavidin coated magnetic beads (depictured as gray sphere) via the biotin in the A-circle. (ii)2 Topo II (brown structure) decatenated the A-circle and the B-circle by the cleavage-ligation mechanism depictured in the inserted box. 3) The magnetic beads were precipitated, removing attached A-circles and unreacted catenanes from the solution. The decatenated B-circles that were recovered in the supernatant were nicked by the Nt.BbvCI nicking enzyme to create a 3΄-OH end that could prime the RCA reaction. 4) The nicked B-circles were subjected to RCA in the presence of molecular beacons that hybridized to the RCPs, resulting in increased fluorescence due to separation of the quencher–fluorophore pair in the individual beacons. 5) The increase in fluorescence could be monitored directly in a fluorometer (the fluorometric readout). 6) RCPs with the bound molecular beacons could be immobilized on microscopic slides by hybridization to a capture oligonucleotide covalently attached to the slide and the results examined using a fluorescence microscope (the microscopic readout).
Figure 2.
Figure 2.
Validation of the TADA assembly. (A) Radiography of a 6% denaturing polyacrylamide gel in which products from different reaction steps in the assembly of the dsDNA catenane were analyzed. Lane 1, 120 nt radiolabeled oligonucleotide (OL8). Lane 2, products of ligation of OL8 (radiolabeled) and OL9 using OL11 as template. Lane 3, products obtained when the ligated product analyzed in Lane 2 were incubated with circularized A-circle followed by ligation and exonuclease treatment. Lane 4, products obtained when complementary oligonucleotides (OL4-OL7, OL10, OL12–16) were added to the reaction mixture analyzed in Lane 3 followed by ligation and exonuclease treatment. A schematic illustration of the expected products is shown to the right of the gel-picture. (B) Schematic illustration of the TADA-complex. The gray sphere represents the streptavidin coupled magnetic bead. The dsDNA catenane was bound to the bead through a biotin (black circle) internally inserted in the A-circle. The red segment on the B-circle represents the molecular beacon binding site. The blue segment represents the capture oligonucleotide binding site. (C) Representative example of primary results obtained when using the fluorometric readout, in which the TADA-complex has been treated with the indicated enzymes and the results detected in a fluorometer. (D) Representative example of results obtained when analyzing the same samples as the ones described in (C) using the microscopic readout. Red and green fluorescent spots represent RCPs generated from RCA of control circles and B-circles, respectively. Contrast and brightness have been adjusted for the images to improve image visualization. (E) Mean of the slopes (representing increase in fluorescence over time) calculated between 100–200 min from three test experiments analyzed by the fluorometric readout method. Error bars represent standard deviation (SD) of the slopes calculated from the three individual experiments. (F) Mean ratio between numbers of green and red spots (green/red ratio) calculated from multiple microscopic images (n = 12). Error bars represent the SD observed among the images in the experiment.
Figure 3.
Figure 3.
Detection of purified Topo IIα. Double logarithmic plot showing mean green/red ratios of triplicate experiments obtained when analyzing a titration of purified Topo IIα using the TADA. The TADA-complex was incubated with decreasing amounts of Topo IIα as noted in the figure and the results analyzed by the microscopic readout. Average amounts of green spots (TADA specific signals) and red spots (signals specific for added control circles) were calculated from 12 images from each experiment and used to calculate the plotted mean. Error bars represent SD from the mean green/red ratios from each of the three experiments.
Figure 4.
Figure 4.
Analysis of the specificity of TADA in extracts from human cancer cells. (A) Western blot analysis of Topo II-depleted or non-depleted cell extracts. The upper panel shows western blots of the indicated sample types using an anti-human Topo IIα (170 kDa) antibody and an anti-glyceraldehyde-3-phosphate dehydrogenase (GAPDH) (37 kDa) antibody (as a loading control). Lane 1, Topo II-depleted cell extract; Lane 2, non-depleted cell extract; Lane 3, size marker; Lane 4, 200 ng of purified Topo IIα. Lower panel, same as upper panel, except that an anti-human Topo IIβ (180 kDa) antibody was used, and purified Topo IIβ was used as a loading control in Lane 4. (B) Bar chart of mean green/red ratios of triplicate experiments in which the TADA-complex was incubated with cell extracts either Topo II-depleted (Topo II-dep), or not depleted for Topo II (non-dep), or with heat inactivated non-depleted cell extract as a negative control (neg) before the results were analyzed using the microscopic readout. Error bars represent SD from mean green/red ratios calculated from 12 images per experiment repetition. (C) The results of incubating the TADA comples with or without a human cell extract in the presence of added ATP or in the absence of added ATP and indicated below the bar chart. The results were normalized by substrating the signals generated in the samples without added cell extracts. The error bars represent SD calculated from three experiments. (D) Schematic illustration of the Topo II-suicide substrate reaction by which Topo II was covalently bound to the suicide substrate after cleavage due to the dissociation of the 3΄-OH end. (E) The result of a competition between the Topo II suicide reaction and the TADA. The bar chart shows the mean slopes calculated from triplicate experiments where the TADA-complex was incubated with cell extract, cell extract containing 40 μM suicide substrate, no cell extract, or cell extract containing pUC18 plasmid DNA (same amount (weight/volume) as the suicide substrate) and analyzed by TADA using the fluorometric readout. The error bars represent SD calculated from three experiments. The results were normalized by substrating the signals generated in the sample without added cell extracts.
Figure 5.
Figure 5.
Determination of the detection limit of the TADA setup in cell extracts. (A) A Log10 bar chart showing mean green/red ratios calculated from triplicate TADA experiments using the microscopic readout. Nuclear cell extract was prepared from HeLa cells, and the extract diluted before the TADA activities were determined. The noted dilutions of HeLa cell extracts corresponded to extracts from 1 (5 × 10⁻⁵ dil.), 5 (10−4 dil.), 50 (10−3 dil.), 5 × 10² (10−2 dil.), 5 × 10³ (10−1 dil.), 5 × 10⁴ (undil.) cells. The error bars represent SD from three individual experiments. The noted P-value (P: 0.016) was calculated using an unpaired two-tailed t-test. The inserted graph is a double logarithmic plot where the mean green/red ratios have been plotted as a function of number of cells analyzed. The dashed line indicates approximate linearity between signal observed and number of cells analyzed with the range of the dilution. (B) Representative 1% agarose gel image of a k-DNA decatenation experiment assaying the activity of the same cell extracts analyzed in (A). The arrow indicates the high mobility band resulting from Topo II decatenation of the k-DNA. A 1 kb size marker (SM) was loaded in Lane 1.
Figure 6.
Figure 6.
Multiplexed detection of Topo IIα and Topo I. The bar chart shows the results from triplicate experiments analyzed by the microscopic readout. The TADA-complex and the S(Topo I) were incubated with Topo I (noted as I), Topo IIα and Topo I (noted as I+II), Topo IIα (noted as II) or none of the enzymes (noted as neg) before RCA and readout. Green columns represent signals generated by TADA and red columns represent signals generated from the Topo I assay. Error bars represent SD from triplicate experiments. To enable display of the data in a single bar chart, the data were normalized by dividing the mean number of signals from the Topo I assay (red) or from the TADA (green) with the mean number of signals generated by analyzing purified Topo I or Topo IIα alone. Raw data without normalization are shown in Supplementary Figure S4.

Similar articles

Cited by

References

    1. Halder S., Krishnan Y.. Design of ultrasensitive DNA-based fluorescent pH sensitive nanodevices. Nanoscale. 2015; 7:10008–10012. - PubMed
    1. Brian R Baker, Lai R.Y., Wood M.S., Doctor E.H., Heeger A.J., Plaxco K.W.. An electronic, aptamer-based small-molecule sensor for the rapid, label-free detection of cocaine in adulterated samples and biological fluids. J. Am. Chem. Soc. 2006; 128:3138–3139. - PubMed
    1. Zayats M., Huang Y., Gill R., Ma C.-A., Willner I.. Label-free and reagentless aptamer-based sensors for small molecules. J. Am. Chem. Soc. 2006; 128:13666–13667. - PubMed
    1. Liu J., Wang C., Jiang Y., Hu Y., Li J., Yang S., Li Y., Yang R., Tan W., Huang C.Z.. Graphene signal amplification for sensitive and real-time fluorescence anisotropy detection of small molecules. Anal. Chem. 2013; 85:1424–1430. - PubMed
    1. Bi S., Li L., Zhang S.. Triggered polycatenated DNA scaffolds for DNA sensors and aptasensors by a combination of rolling circle amplification and DNAzyme amplification. Anal. Chem. 2010; 82:9447–9454. - PubMed

MeSH terms

LinkOut - more resources