

Alternative Evolutionary Paths to Bacterial Antibiotic Resistance Cause Distinct Collateral Effects
- PMID: 28541480
- PMCID: PMC5850482
- DOI: 10.1093/molbev/msx158
Alternative Evolutionary Paths to Bacterial Antibiotic Resistance Cause Distinct Collateral Effects
Abstract
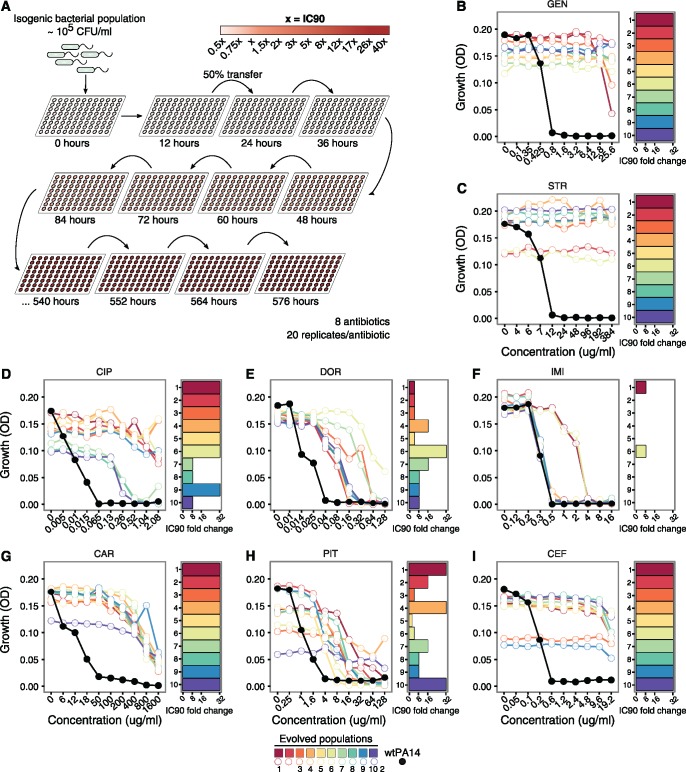
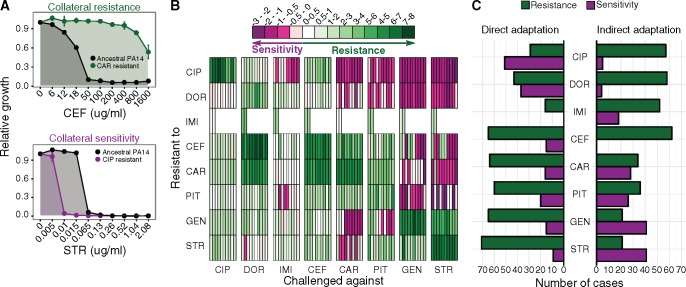
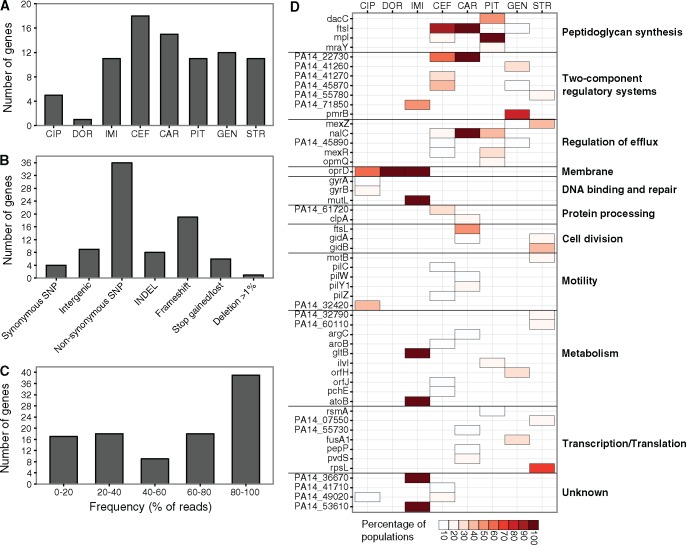
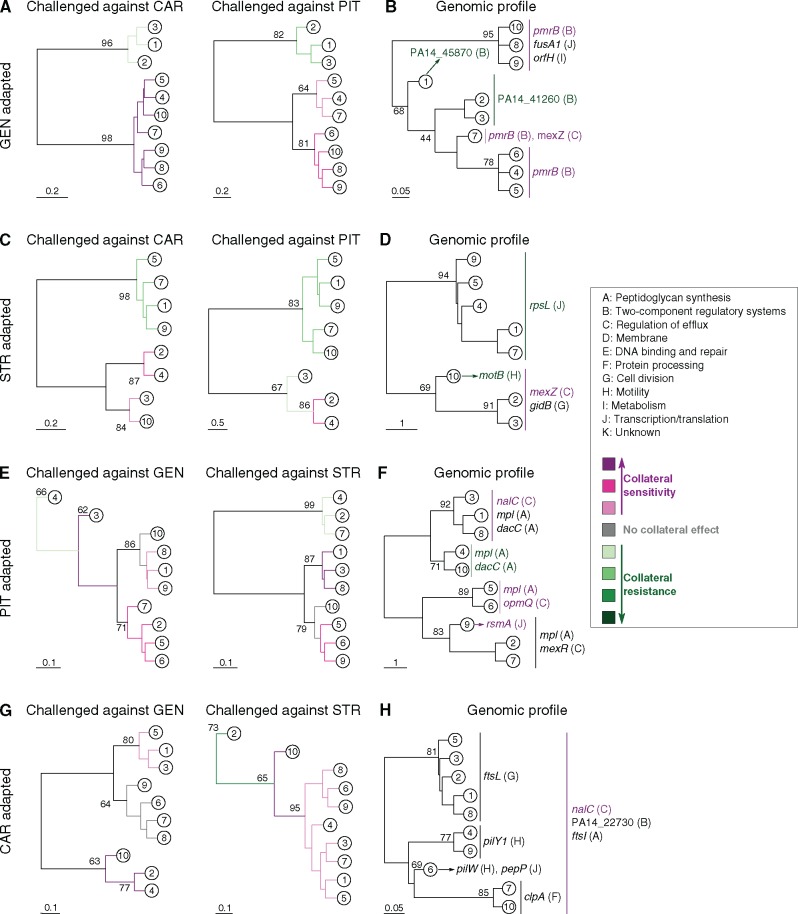
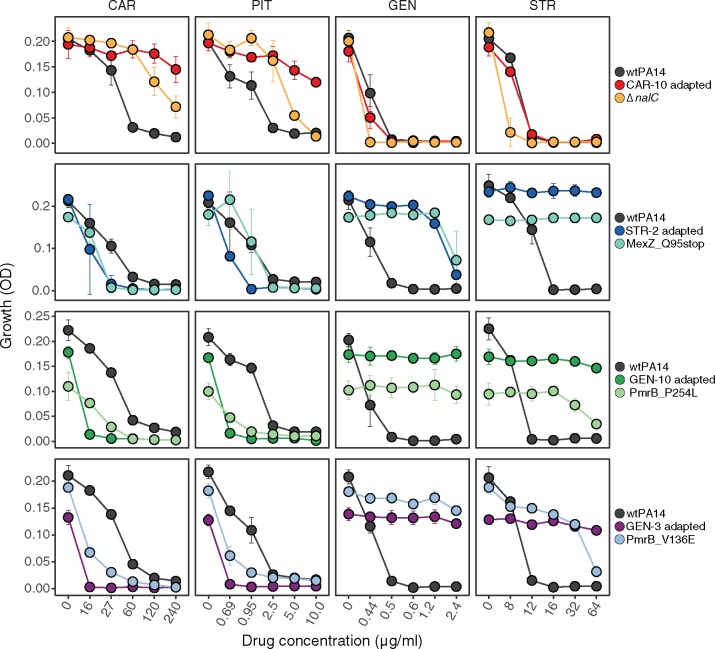
When bacteria evolve resistance against a particular antibiotic, they may simultaneously gain increased sensitivity against a second one. Such collateral sensitivity may be exploited to develop novel, sustainable antibiotic treatment strategies aimed at containing the current, dramatic spread of drug resistance. To date, the presence and molecular basis of collateral sensitivity has only been studied in few bacterial species and is unknown for opportunistic human pathogens such as Pseudomonas aeruginosa. In the present study, we assessed patterns of collateral effects by experimentally evolving 160 independent populations of P. aeruginosa to high levels of resistance against eight commonly used antibiotics. The bacteria evolved resistance rapidly and expressed both collateral sensitivity and cross-resistance. The pattern of such collateral effects differed to those previously reported for other bacterial species, suggesting interspecific differences in the underlying evolutionary trade-offs. Intriguingly, we also identified contrasting patterns of collateral sensitivity and cross-resistance among the replicate populations adapted to the same drug. Whole-genome sequencing of 81 independently evolved populations revealed distinct evolutionary paths of resistance to the selective drug, which determined whether bacteria became cross-resistant or collaterally sensitive towards others. Based on genomic and functional genetic analysis, we demonstrate that collateral sensitivity can result from resistance mutations in regulatory genes such as nalC or mexZ, which mediate aminoglycoside sensitivity in β-lactam-adapted populations, or the two-component regulatory system gene pmrB, which enhances penicillin sensitivity in gentamicin-resistant populations. Our findings highlight substantial variation in the evolved collateral effects among replicates, which in turn determine their potential in antibiotic therapy.
Keywords: Pseudomonas aeruginosa; antibiotic resistance; collateral sensitivity; experimental evolution; trade-offs.
© The Author 2017. Published by Oxford University Press on behalf of the Society for Molecular Biology and Evolution.
Figures
Comment in
-
New Approach to Antibiotic Therapy is a Dead End for Pathogens.Mol Biol Evol. 2017 Nov 1;34(11):3035-3036. doi: 10.1093/molbev/msx202. Mol Biol Evol. 2017. PMID: 29126323 No abstract available.
Similar articles
-
Rapid Phenotypic Convergence towards Collateral Sensitivity in Clinical Isolates of Pseudomonas aeruginosa Presenting Different Genomic Backgrounds.Microbiol Spectr. 2023 Feb 14;11(1):e0227622. doi: 10.1128/spectrum.02276-22. Epub 2022 Dec 19. Microbiol Spectr. 2023. PMID: 36533961 Free PMC article.
-
Evolutionary stability of collateral sensitivity to antibiotics in the model pathogen Pseudomonas aeruginosa.Elife. 2019 Oct 29;8:e51481. doi: 10.7554/eLife.51481. Elife. 2019. PMID: 31658946 Free PMC article.
-
The population genetics of collateral resistance and sensitivity.Elife. 2021 Dec 10;10:e73250. doi: 10.7554/eLife.73250. Elife. 2021. PMID: 34889185 Free PMC article.
-
Collateral sensitivity of antibiotic-resistant microbes.Trends Microbiol. 2015 Jul;23(7):401-7. doi: 10.1016/j.tim.2015.02.009. Epub 2015 Mar 25. Trends Microbiol. 2015. PMID: 25818802 Free PMC article. Review.
-
Mechanisms of ciprofloxacin resistance in Pseudomonas aeruginosa: new approaches to an old problem.J Med Microbiol. 2019 Jan;68(1):1-10. doi: 10.1099/jmm.0.000873. J Med Microbiol. 2019. PMID: 30605076 Review.
Cited by
-
Evolutionary History and Strength of Selection Determine the Rate of Antibiotic Resistance Adaptation.Mol Biol Evol. 2022 Sep 1;39(9):msac185. doi: 10.1093/molbev/msac185. Mol Biol Evol. 2022. PMID: 36062982 Free PMC article.
-
Role of Efflux Pump-Mediated Antibiotic Resistance in Quorum Sensing-Regulated Biofilm Formation by Salmonella Typhimurium.Pathogens. 2022 Jan 24;11(2):147. doi: 10.3390/pathogens11020147. Pathogens. 2022. PMID: 35215091 Free PMC article.
-
The predictive potential of different molecular markers linked to amikacin susceptibility phenotypes in Pseudomonas aeruginosa.PLoS One. 2022 Apr 25;17(4):e0267396. doi: 10.1371/journal.pone.0267396. eCollection 2022. PLoS One. 2022. PMID: 35468158 Free PMC article.
-
Price equation captures the role of drug interactions and collateral effects in the evolution of multidrug resistance.Elife. 2021 Jul 22;10:e64851. doi: 10.7554/eLife.64851. Elife. 2021. PMID: 34289932 Free PMC article.
-
Dynamic collateral sensitivity profiles highlight opportunities and challenges for optimizing antibiotic treatments.PLoS Biol. 2025 Jan 8;23(1):e3002970. doi: 10.1371/journal.pbio.3002970. eCollection 2025 Jan. PLoS Biol. 2025. PMID: 39774800 Free PMC article.
References
-
- Amin NE, Giske CG, Jalal S, Keijser B, Kronvall G, Wretlind B.. 2005. Carbapenem resistance mechanisms in Pseudomonas aeruginosa: alterations of porin OprD and efflux proteins do not fully explain resistance patterns observed in clinical isolates. APMIS 113:187–196. - PubMed
-
- Andersson DI, Hughes D.. 2010. Antibiotic resistance and its cost: is it possible to reverse resistance? Nat Rev Microbiol. 8:260–271. - PubMed
-
- Arruda EA, Marinho IS, Boulos M, Sinto SI, Mendes CM, Oplustil CP, Sader H, Levy CE, Levin AS.. 1999. Nosocomial infections caused by multiresistant Pseudomonas aeruginosa. Infect Control Hosp Epidemiol. 20:620–623. - PubMed
MeSH terms
Substances
LinkOut - more resources
Full Text Sources
Other Literature Sources
Medical
