Molecular association of Arabidopsis RTH with its homolog RTE1 in regulating ethylene signaling
- PMID: 28541511
- PMCID: PMC5853943
- DOI: 10.1093/jxb/erx175
Molecular association of Arabidopsis RTH with its homolog RTE1 in regulating ethylene signaling
Abstract
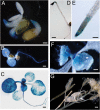
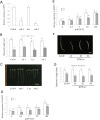
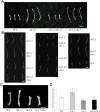
The plant hormone ethylene affects many biological processes during plant growth and development. Ethylene is perceived by ethylene receptors at the endoplasmic reticulum (ER) membrane. The ETR1 ethylene receptor is positively regulated by the transmembrane protein RTE1, which localizes to the ER and Golgi apparatus. The RTE1 gene family is conserved in animals, plants, and lower eukaryotes. In Arabidopsis, RTE1-HOMOLOG (RTH) is the only homolog of the Arabidopsis RTE1 gene family. The regulatory function of the Arabidopsis RTH in ethylene signaling and plant growth is largely unknown. The present study shows Arabidopsis RTH gene expression patterns, protein co-localization with the ER and Golgi apparatus, and the altered ethylene response phenotype when RTH is knocked out or overexpressed in Arabidopsis. Compared with rte1 mutants, rth mutants exhibit less sensitivity to exogenous ethylene, while RTH overexpression confers ethylene hypersensitivity. Genetic analyses indicate that Arabidopsis RTH might not directly regulate the ethylene receptors. RTH can physically interact with RTE1, and evidence supports that RTH might act via RTE1 in regulating ethylene responses and signaling. The present study advances our understanding of the regulatory function of the Arabidopsis RTE1 gene family members in ethylene signaling.
Keywords: Arabidopsis; RTE1 homolog; ethylene; receptor; signaling.
© The Author 2017. Published by Oxford University Press on behalf of the Society for Experimental Biology. All rights reserved. For permissions, please email: journals.permissions@oup.com.
Figures


Similar articles
-
Subcellular co-localization of Arabidopsis RTE1 and ETR1 supports a regulatory role for RTE1 in ETR1 ethylene signaling.Plant J. 2008 Jan;53(2):275-86. doi: 10.1111/j.1365-313X.2007.03339.x. Epub 2007 Nov 12. Plant J. 2008. PMID: 17999643 Free PMC article.
-
Association of cytochrome b5 with ETR1 ethylene receptor signaling through RTE1 in Arabidopsis.Plant J. 2014 Feb;77(4):558-67. doi: 10.1111/tpj.12401. Plant J. 2014. PMID: 24635651 Free PMC article.
-
Molecular association of the Arabidopsis ETR1 ethylene receptor and a regulator of ethylene signaling, RTE1.J Biol Chem. 2010 Dec 24;285(52):40706-13. doi: 10.1074/jbc.M110.146605. Epub 2010 Oct 15. J Biol Chem. 2010. PMID: 20952388 Free PMC article.
-
Molecular basis for jasmonate and ethylene signal interactions in Arabidopsis.J Exp Bot. 2014 Nov;65(20):5743-8. doi: 10.1093/jxb/eru349. Epub 2014 Aug 27. J Exp Bot. 2014. PMID: 25165148 Review.
-
Subcellular dynamics of ethylene signaling drive plant plasticity to growth and stress: Spatiotemporal control of ethylene signaling in Arabidopsis.Bioessays. 2024 Jun;46(6):e2400043. doi: 10.1002/bies.202400043. Epub 2024 Apr 3. Bioessays. 2024. PMID: 38571390 Review.
Cited by
-
The nucleoporin NUP160 and NUP96 regulate nucleocytoplasmic export of mRNAs and participate in ethylene signaling and response in Arabidopsis.Plant Cell Rep. 2023 Mar;42(3):549-559. doi: 10.1007/s00299-022-02976-6. Epub 2023 Jan 4. Plant Cell Rep. 2023. PMID: 36598573
-
Ethylene, a Signaling Compound Involved in Seed Germination and Dormancy.Plants (Basel). 2024 Sep 24;13(19):2674. doi: 10.3390/plants13192674. Plants (Basel). 2024. PMID: 39409543 Free PMC article. Review.
-
Arabidopsis CPR5 plays a role in regulating nucleocytoplasmic transport of mRNAs in ethylene signaling pathway.Plant Cell Rep. 2022 Apr;41(4):1075-1085. doi: 10.1007/s00299-022-02838-1. Epub 2022 Feb 24. Plant Cell Rep. 2022. PMID: 35201411
-
The Arabidopsis RTH plays an important role in regulation of iron (Fe) absorption and transport.Plant Cell Rep. 2024 Apr 30;43(5):133. doi: 10.1007/s00299-024-03214-x. Plant Cell Rep. 2024. PMID: 38687356
References
-
- Abeles FB, Morgan PW, Saltveit ME. 1992. Ethylene in plant biology, 2nd edn San Diego: Academic Press, Inc.
-
- Alonso JM, Hirayama T, Roman G, Nourizadeh S, Ecker JR. 1999. EIN2, a bifunctional transducer of ethylene and stress responses in Arabidopsis. Science 284, 2148–2152. - PubMed
-
- Bleecker AB, Estelle MA, Somerville C, Kende H. 1988. Insensitivity to ethylene conferred by a dominant mutation in Arabidopsis thaliana. Science 241, 1086–1089. - PubMed
-
- Chang C, Kwok SF, Bleecker AB, Meyerowitz EM. 1993. Arabidopsis ethylene-response gene ETR1: similarity of product to two-component regulators. Science 262, 539–544. - PubMed
Publication types
MeSH terms
Substances
Grants and funding
LinkOut - more resources
Full Text Sources
Other Literature Sources
Molecular Biology Databases

