. 2017 May 24;13(5):e1005543.
doi: 10.1371/journal.pcbi.1005543. eCollection 2017 May.

Spontaneous cortical activity is transiently poised close to criticality

Affiliations

Spontaneous cortical activity is transiently poised close to criticality

Gerald Hahn et al. PLoS Comput Biol. .

Abstract

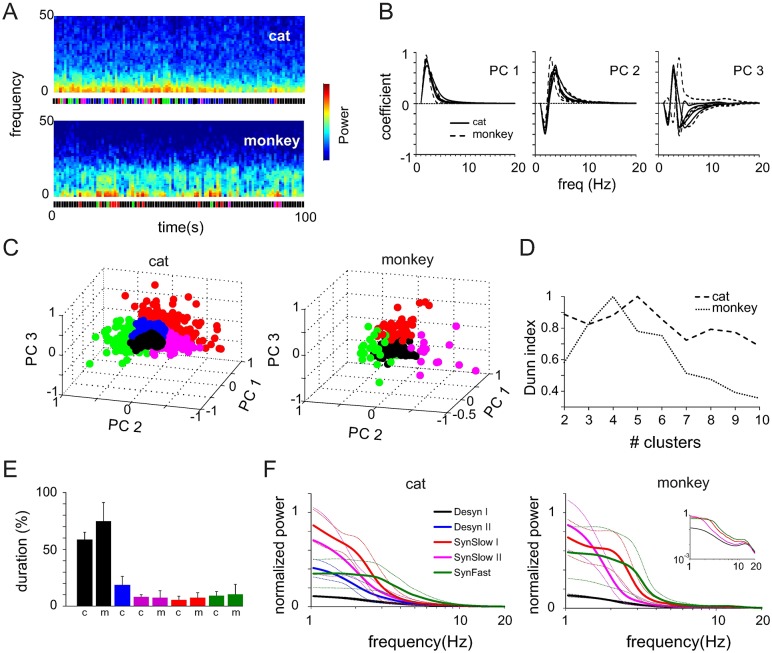
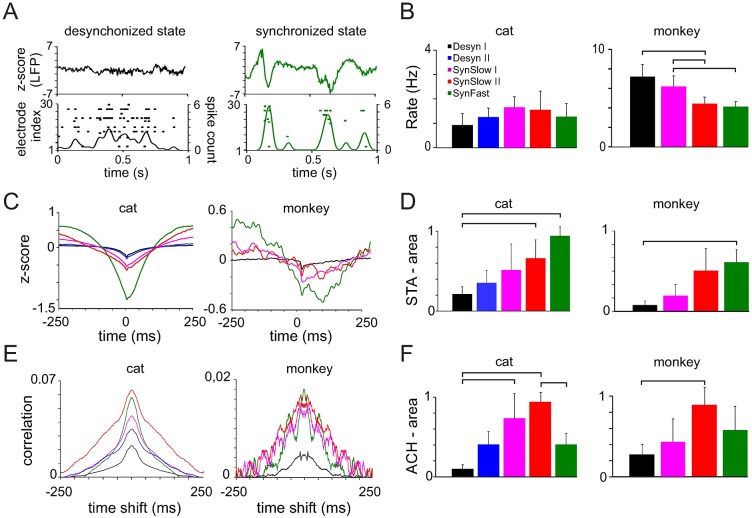
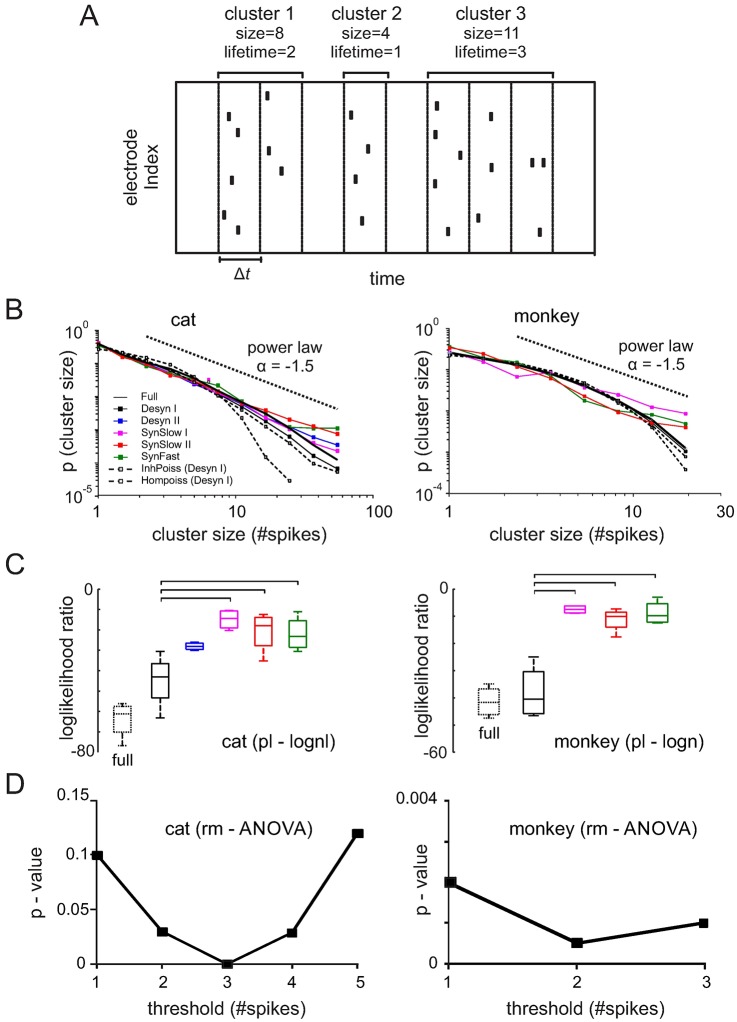
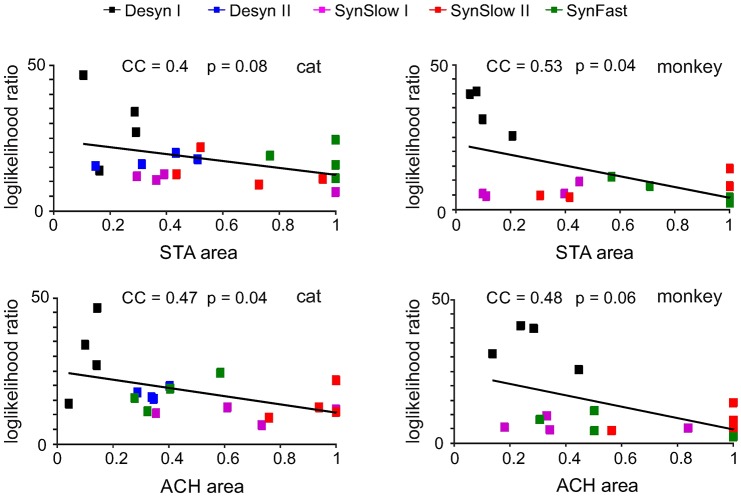
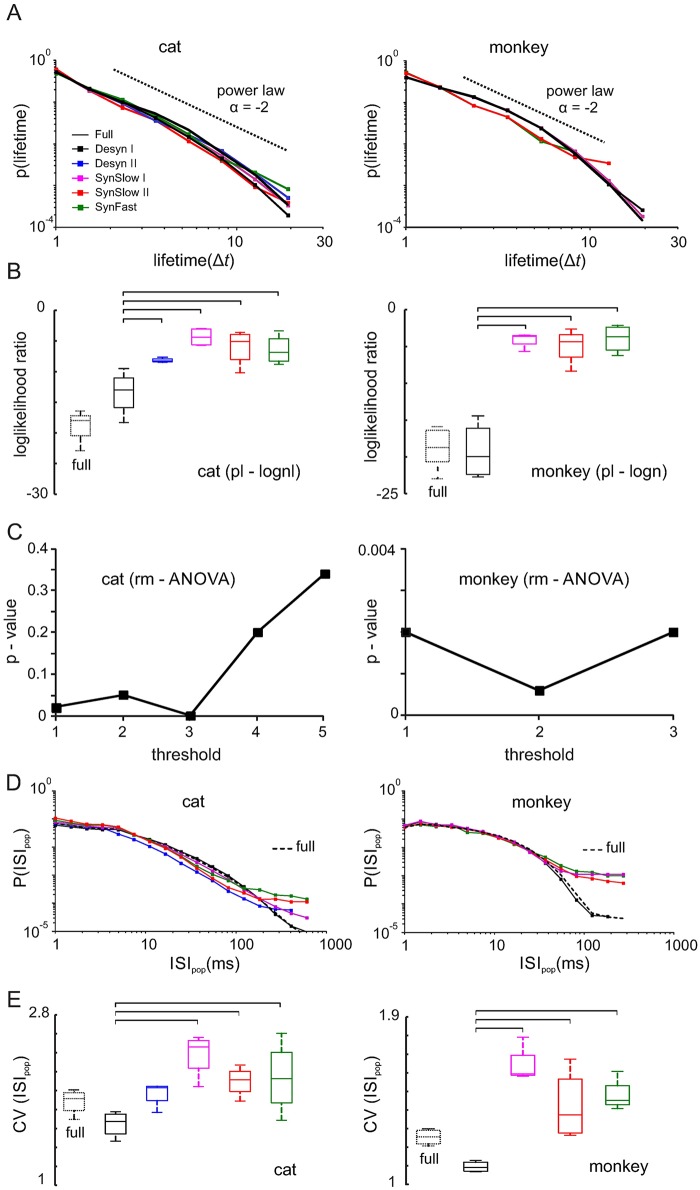
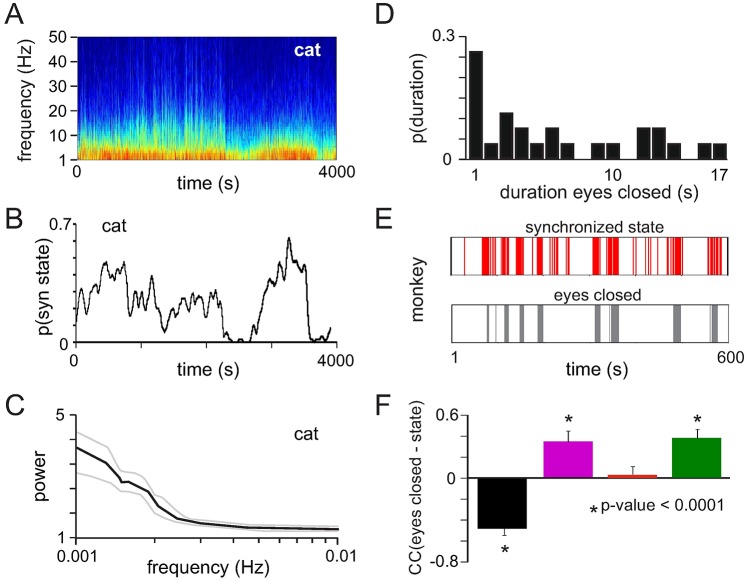
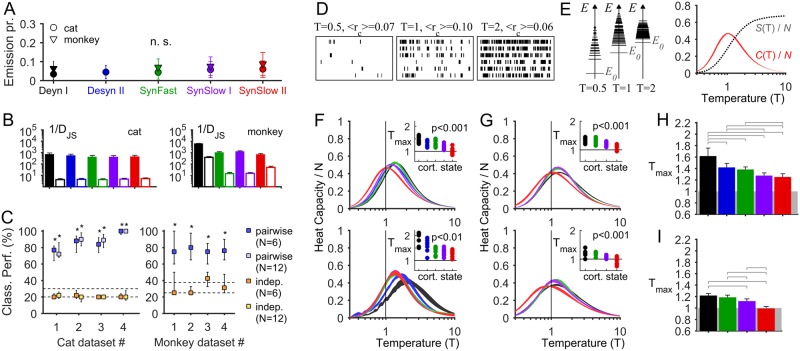
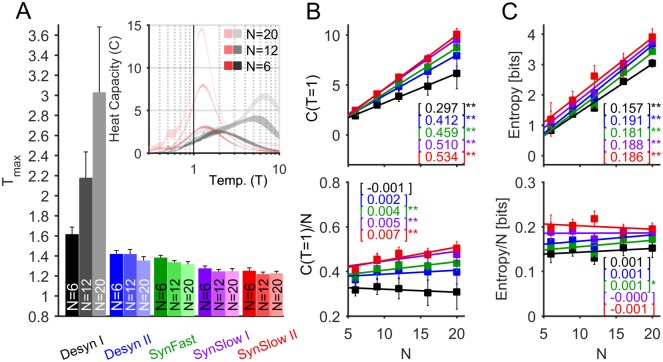
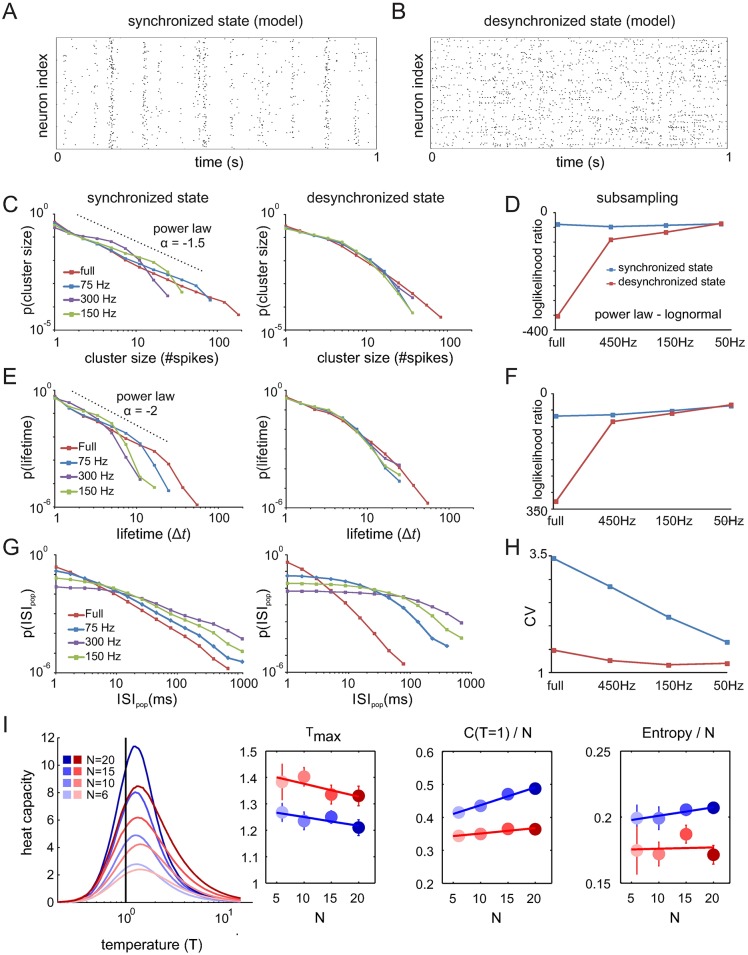
Brain activity displays a large repertoire of dynamics across the sleep-wake cycle and even during anesthesia. It was suggested that criticality could serve as a unifying principle underlying the diversity of dynamics. This view has been supported by the observation of spontaneous bursts of cortical activity with scale-invariant sizes and durations, known as neuronal avalanches, in recordings of mesoscopic cortical signals. However, the existence of neuronal avalanches in spiking activity has been equivocal with studies reporting both its presence and absence. Here, we show that signs of criticality in spiking activity can change between synchronized and desynchronized cortical states. We analyzed the spontaneous activity in the primary visual cortex of the anesthetized cat and the awake monkey, and found that neuronal avalanches and thermodynamic indicators of criticality strongly depend on collective synchrony among neurons, LFP fluctuations, and behavioral state. We found that synchronized states are associated to criticality, large dynamical repertoire and prolonged epochs of eye closure, while desynchronized states are associated to sub-criticality, reduced dynamical repertoire, and eyes open conditions. Our results show that criticality in cortical dynamics is not stationary, but fluctuates during anesthesia and between different vigilance states.


Conflict of interest statement

The authors have declared that no competing interests exist.

Figures

Fig 1
Fig 1. Separation of cortical states in spontaneous activity of anesthetized cat and awake monkey.
(A) LFP spectrograms of two 100s segments computed with non-overlapping windows of 1s. Bottom: colored bars indicate cortical state as defined in the main text. (B) Coefficients for first three principal components as a function of power spectrum frequency. (C) Principal component space for two entire datasets (cat: 6000s, monkey: 600s). Each circle represents a data segment of 1s duration. Colors indicate different cortical states. (D) Dunn index as a function of the cluster number extracted by k-means. (E) Average (+SD) duration of different states across all datasets of a species. (F) Average power spectrum of different cortical states for all cat and monkey datasets. Dashed lines indicate standard deviation (±SD). Inset: same as in main figure, but in log-log coordinates to show peak in alpha band.
Fig 2
Fig 2. Characteristics of LFP-spike relationship and spiking activity for different cortical states.
(A) LFPs (top) and spike rasters (bottom) for 1s segments of a desynchronized and synchronized cortical state from one cat dataset. Spike counts were computed with a Gaussian kernel (20ms window-size). (B) Average (+SD) population firing rate for all recordings of a species. (C) Examples of spike-triggered averages (STA) for different cortical states. (D) Average (+SD) STA area across all cat and monkey datasets. The area is normalized to the state with the largest value within a dataset. (E) Autocorrelation histograms of the population spike trains (pACH) for all cortical states in one cat and one monkey recording. (F) Average (+SD) area and of ACH peaks computed for all cat and monkey datasets. The values were normalized to the states with maximum area within a dataset. Horizontal bars: significant Bonferroni multiple comparison test (p<0.05).
Fig 3
Fig 3. Neuronal avalanche analysis of spiking activity.
(A) Spike clusters were defined as a sequence of bins containing spikes ≥1 threshold (in this example threshold = 1). The size of a spike cluster is given by the total number of spikes within a cluster. The lifetime of a cluster is defined as the number of bins. Δt was chosen as the average ISIpop interval of the population spike train for each state. (B) Cluster size distributions of different states. Dotted black lines indicate power law with exponent = -1.5. Dashed lines with gray squares represent an inhomogenous Poisson process created from the desynchronized I state by spike time randomization within all 1s segments. Dashed lines with empty squares indicate homogenous Poisson process with the same rate and duration as the entire desynchronized I state. (C) Loglikelihood ratios for power law and lognormal fits to cluster size distributions of different cortical states across all cat (threshold: 3 spikes) and monkey data (threshold: 2 spikes). Negative values indicate a better lognormal fit. Horizontal bars: significant Bonferroni multiple comparison test. (D) Significance between different states expressed as the p-value of an rm-ANOVA test for different thresholds defining a cluster.
Fig 4
Fig 4. Correlation between LFP, spike synchronization and the level of criticality measured by the loglikelihood ratio for power law and lognormal fits.
Top: LLR as a function of STA area for all cat and monkey datasets. Bottom: LLR as a function of ACH area.
Fig 5
Fig 5. Lifetime and ISIpop distributions of spiking activity.
(A) Lifetime distributions of different states. Dotted black lines indicate power law with exponent = -2. (B) Loglikelihood ratios for power law and lognormal fits to lifetime distributions of different cortical states across all cat (threshold: 3 spikes) and monkey data (threshold: 2 spikes). Negative values indicate a better lognormal fit. Horizontal bars: significant Bonferroni multiple comparison test. (C) Significance between different states calculated as the p-value of an rm-ANOVA test for varying thresholds constituting a cluster. (D) ISIpop distributions of population spike trains for one cat and one monkey recording. (E) Coefficient of variation for ISIpop distributions of different states across all cat and monkey datasets.
Fig 6
Fig 6. Evolution of cortical states over time.
(A) LFP spectrogram of an entire recording in one cat calculated with non overlapping windows of 1s duration (top) and the probability of synchronized states (synchronized slow I, II and synchronized fast states) computed with a sliding window of size 100s and an overlap of 1s (bottom). (B) Average power spectrum (SEM: dashed lines) of the time courses of synchronized states across all four cats. (C) Probability to find periods of eye closure with a given duration across all monkey datasets. (D) Time course of synchronized states (synchronized slow II and synchronized fast) (top) and periods of full eye closure (bottom) in one monkey dataset. Vertical bars represent 1s time segments. (E) Pearson correlation coefficient calculated between the time course of eyes closure and the time courses of different cortical states.
Fig 7
Fig 7. Maximum entropy models (MEMs) of different cortical state.
(A) Probability that an electrode site i has σi = +1 (emission probability) using the bin sizes indicated in Table 2 (error bars indicate SEM). The emission probabilities do not significantly depend on the cortical state (p = 0.092 for cat data, p = 0.058 for monkey data, rm-ANOVA). (B) Goodness-of-fit (1/DJS) of pairwise-MEMs (filled bars) and independent-MEMs (open bars) for each cortical state (averaged over the 10 groups of N signals and all datasets; error bars indicate SEM). (C) Prediction of the cortical state using pairwise- and independent-MEMs. The percentage of correct classifications is shown for each cat (left) and monkey (right) dataset. Squares indicate the medians and error bars delineate the 5–95th percentiles of the classification performance. Dash lines: mean and 95th percentile of the number of correct classifications expected by chance. *: significant classification performances (p < 0.05). (D–E) Effect of changing the temperature parameter T on the model activity. The MEM in this example was estimated using the activity of a neural ensemble of the cat in the SynSlow II state. D: model activity (1000 steps are shown out of 106 steps). At low temperature (T = 0.5) the activity is sparse and correlations are low (<rc> = 0.07); at high temperature (T = 2) the activity is dense and random and correlations are low (<rc> = 0.06); for an intermediate temperature (T = 1) the activity is more patterned and correlations are higher (<rc> = 0.10). E: Left, occupied energy levels. The size of the horizontal lines is proportional to log(nE), where nE is the number of patterns that have the energy E. Right, the entropy S(T) increases with T and the heat capacity C(T) peaks at a given temperature Tmax (for this particular example neural ensemble Tmax = 1). (F–G) Heat capacity as a function of the temperature parameter (T), for each cortical state, for two example anesthetized cat datasets (F) and two example awake monkey datasets (G) (10 random choices of groups of N signals were used; trace thickness indicates SEM). Inset: Peak temperature (Tmax) for each neuronal ensemble and for each cortical state. Tmax significantly depends on cortical state (p: p-value, rm-ANOVA). (H–I) Tmax averaged over all cat datasets (H) and over all monkey datasets (I) for each cortical state (rm-ANOVA: H: F4,156 = 25.03, p < 0.001, ε = 0.34; I: F3,117 = 59.60, p<0.001, ε = 0.90). Error bars indicate SEM. Horizontal bars: significant differences (p < 0.05) of subsequent Bonferroni's test for multiple comparisons. In A–I the size of the models was N = 6.
Fig 8
Fig 8. Heat capacity and entropy as a function of ensemble size.
(A) Peak temperature (Tmax) averaged across anesthetized cat datasets for each cortical state and for ensembles of different sizes N. This analysis was restricted to cat datasets, for which more electrodes and longer recordings were available (datasets #1–4 for N ≤ 12 and datasets #1–3 for N > 12). Inset: heat capacity functions for Desyn I (gray scale) and SynSlow II (red scale) for an example cat dataset. (B) Magnitude of the heat capacity, C (top), and specific heat capacity, C/N (bottom), evaluated at T = 1 for different ensemble sizes N. For all tested N, the heat capacity was significantly cortical-state-dependent (p < 0.05, rm-ANOVA). (C) Entropy (top) and specific entropy (bottom) as a function of N. For all tested N, the entropy was significantly cortical-state-dependent (p < 0.05, rm-ANOVA). In both (B) and (C) lines indicate least-squares linear fit, for which the slopes are showed in the brackets and the asterisks indicate slopes significantly different from zero (*: p < 0.05, **: p < 0.01), and error bars indicate SEM.
Fig 9
Fig 9. Sub-sampling analysis of a spiking neuronal model.
(A-B) Model spike rasters of synchronized and desynchronized states. (C) Cluster size distributions of synchronized and desynchronized model activity. (D) Loglikelihood ratios of fitted power law and lognormal distributions fitted to the cluster size distributions for different levels of sub-sampling. (E) Lifetime distributions for synchronized and desynchronized model dynamics. (F) Same as in (D) for lifetime distributions. (G-H) Inter-spike interval distributions of population spike trains (ISIpop) and corresponding coefficients of variation for three different degrees of sub-sampling. (I) Heat capacity as a function of the temperature parameter (T), for each dynamical regime of the spiking network (blue: critical, red: subcritical). Twenty random choices of groups of N model neurons were used; error bars indicate SEM. The insets show: the peak temperature (Tmax) as a function of N, the amplitude of the heat capacity normalized by N, and the entropy per neuron in both dynamical regimes. Lines indicate least-squares linear fits.

Similar articles

Cited by

References

    1. Fox MD, Raichle ME. Spontaneous fluctuations in brain activity observed with functional magnetic resonance imaging. Nat Rev Neurosci. 2007;8: 700–11. 10.1038/nrn2201 - DOI - PubMed
    1. Petersen SE, Posner MI. The attention system of the human brain: 20 years after. Annu Rev Neurosci. 2012;35: 73–89. 10.1146/annurev-neuro-062111-150525 - DOI - PMC - PubMed
    1. Alkire MT, Hudetz AG, Tononi G. Consciusness and Anesthesia. Science (80-). 2008;7: 876–880. 10.1126/science.1149213 - DOI - PMC - PubMed
    1. Takahashi K, Kim S, Coleman TP, Brown KA, Suminski AJ, Best MD, et al. Large-scale spatiotemporal spike patterning consistent with wave propagation in motor cortex. Nat Commun. 2015;6: 7169 10.1038/ncomms8169 - DOI - PMC - PubMed
    1. Kenet T, Bibitchkov D, Tsodyks M, Grinvald A, Arieli A. Spontaneously emerging cortical representations of visual attributes. Nature. 2003;425: 954–956. 10.1038/nature02078 - DOI - PubMed

Publication types

LinkOut - more resources