. 2017 May 25;13(5):e1005523.
doi: 10.1371/journal.pcbi.1005523. eCollection 2017 May.

An agent-based model of leukocyte transendothelial migration during atherogenesis

Affiliations

An agent-based model of leukocyte transendothelial migration during atherogenesis

Rita Bhui et al. PLoS Comput Biol. .

Abstract

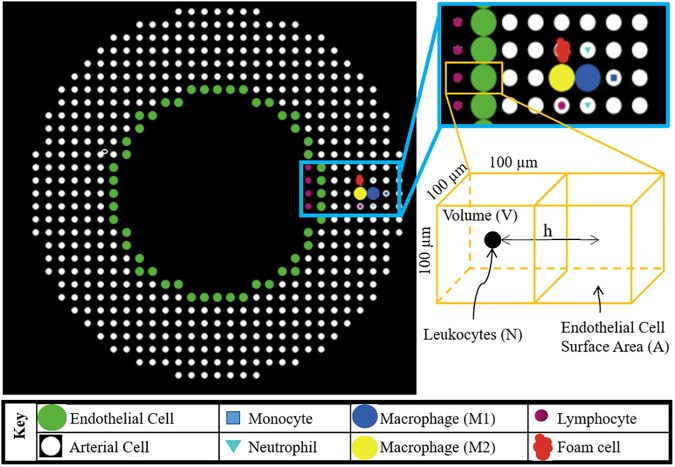
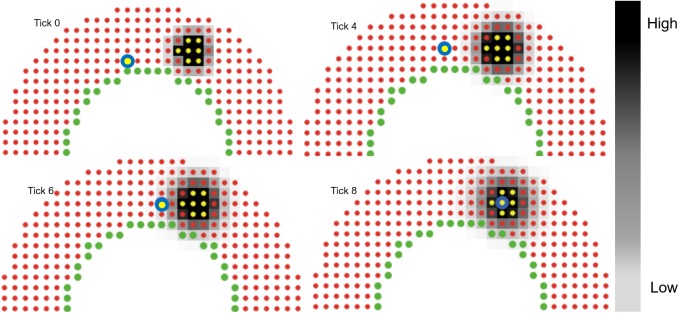
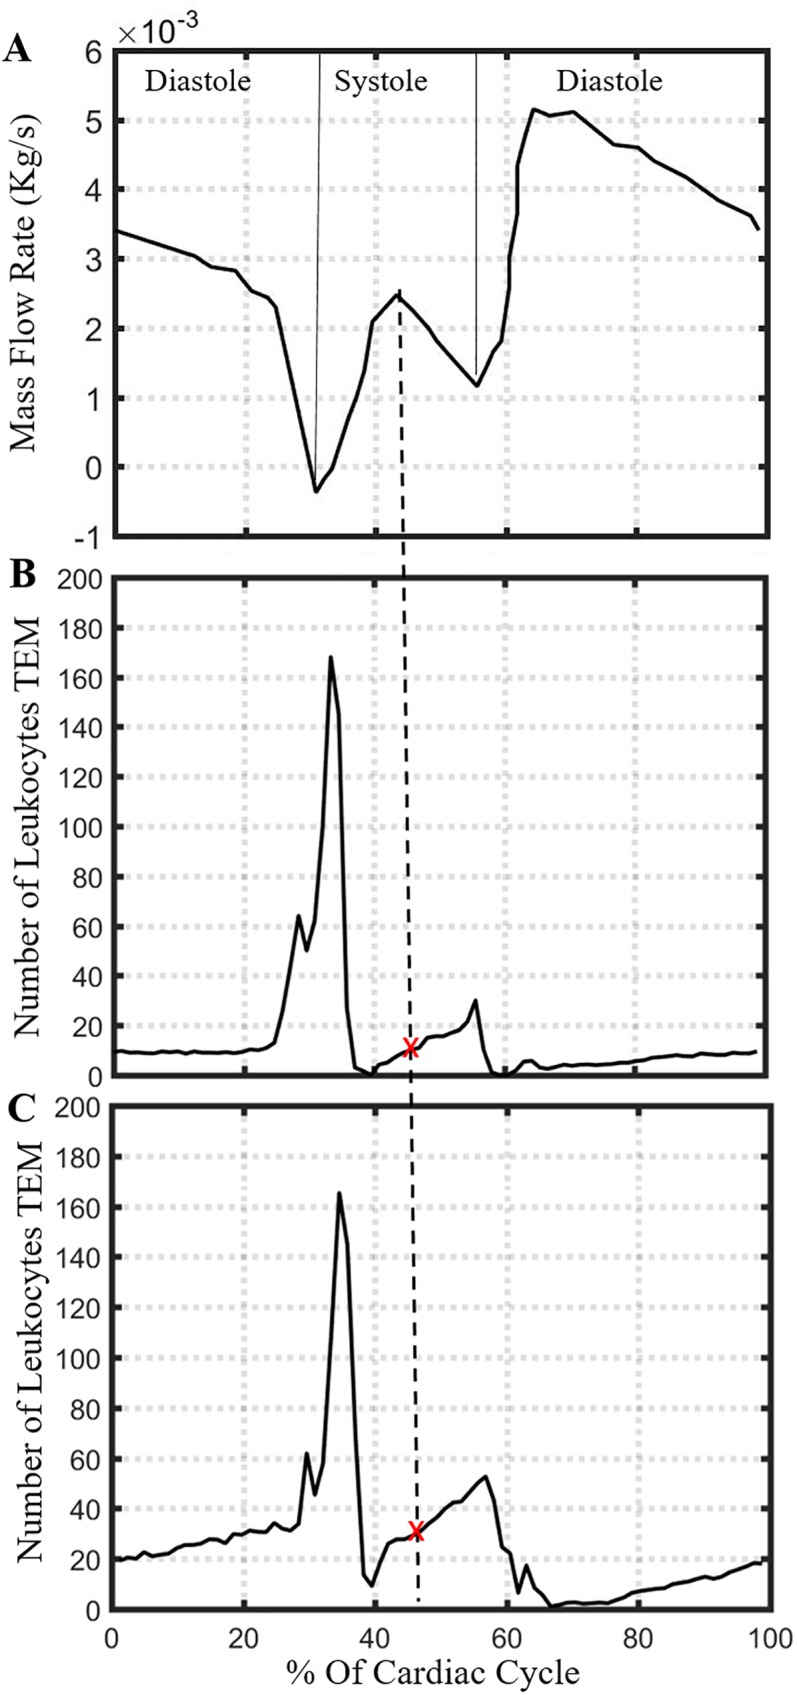
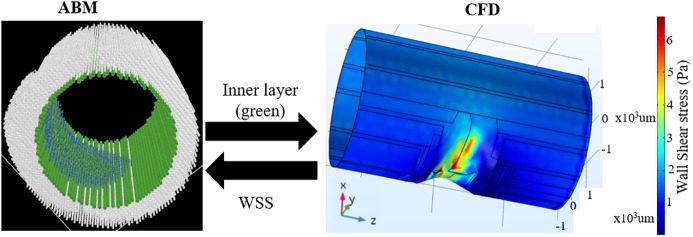
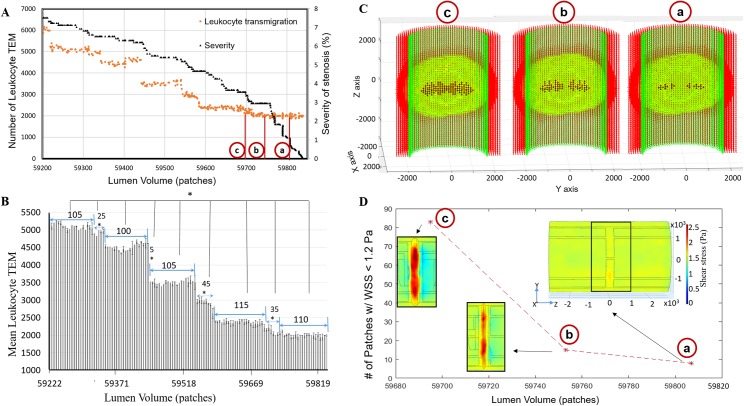
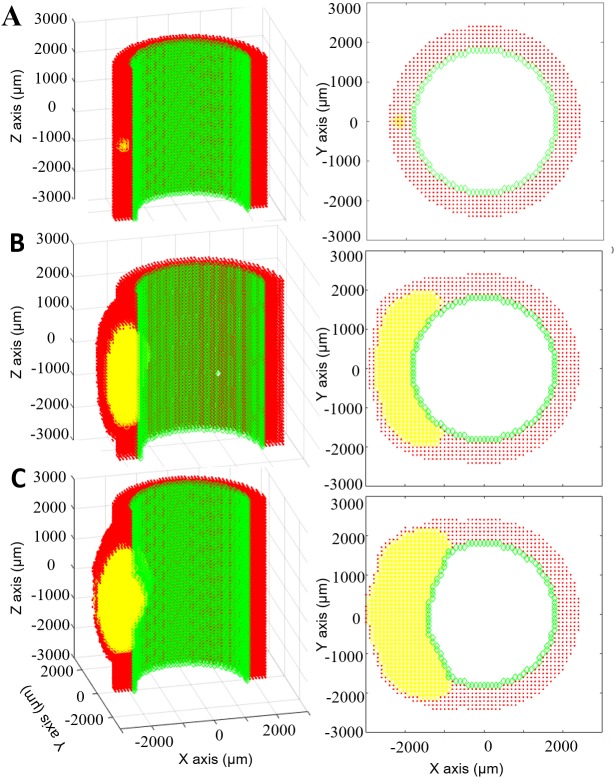
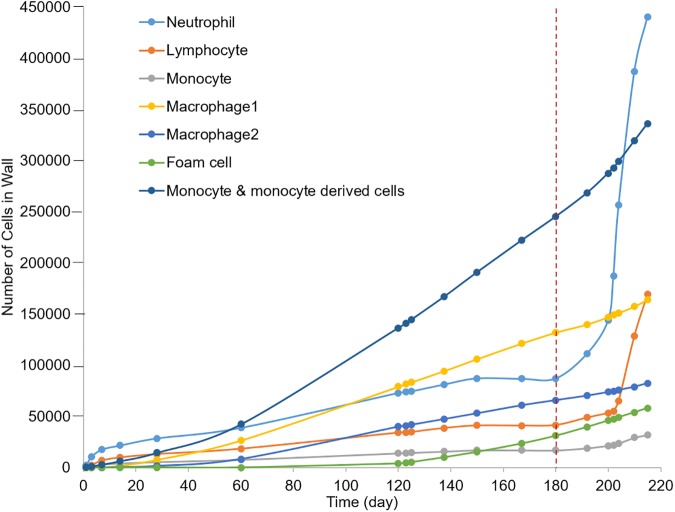
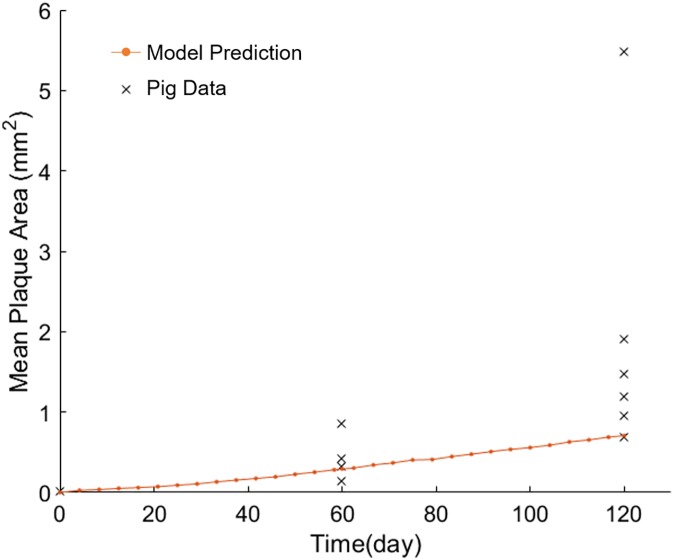
A vast amount of work has been dedicated to the effects of hemodynamics and cytokines on leukocyte adhesion and trans-endothelial migration (TEM) and subsequent accumulation of leukocyte-derived foam cells in the artery wall. However, a comprehensive mechanobiological model to capture these spatiotemporal events and predict the growth and remodeling of an atherosclerotic artery is still lacking. Here, we present a multiscale model of leukocyte TEM and plaque evolution in the left anterior descending (LAD) coronary artery. The approach integrates cellular behaviors via agent-based modeling (ABM) and hemodynamic effects via computational fluid dynamics (CFD). In this computational framework, the ABM implements the diffusion kinetics of key biological proteins, namely Low Density Lipoprotein (LDL), Tissue Necrosis Factor alpha (TNF-α), Interlukin-10 (IL-10) and Interlukin-1 beta (IL-1β), to predict chemotactic driven leukocyte migration into and within the artery wall. The ABM also considers wall shear stress (WSS) dependent leukocyte TEM and compensatory arterial remodeling obeying Glagov's phenomenon. Interestingly, using fully developed steady blood flow does not result in a representative number of leukocyte TEM as compared to pulsatile flow, whereas passing WSS at peak systole of the pulsatile flow waveform does. Moreover, using the model, we have found leukocyte TEM increases monotonically with decreases in luminal volume. At critical plaque shapes the WSS changes rapidly resulting in sudden increases in leukocyte TEM suggesting lumen volumes that will give rise to rapid plaque growth rates if left untreated. Overall this multi-scale and multi-physics approach appropriately captures and integrates the spatiotemporal events occurring at the cellular level in order to predict leukocyte transmigration and plaque evolution.


Conflict of interest statement

The authors have declared that no competing interests exist.

Figures

Fig 1
Fig 1. Schematic illustrating the spatial distribution of each type of cell (i.e. agent) in the ABM.
The bottom right schematic represents a luminal and artery wall patch where N is the number of leukocyte agents residing in this luminal patch. Among all leukocytes (N), M is the number that adheres to the endothelial cell surface area (A). V is the patch volume and h is 100μm or the distance between the patch centroids. All these parameters are used to find leukocyte adhesion probability (see Eq 2).
Fig 2
Fig 2. Protein diffusion and leukocyte chemotaxis.
2D example of leukocyte (yellow circle with blue outline) migration. Color bar represents the cytokine concentration gradient (black (highest) to white (lowest) via gray). Yellow agents produce the cytokines. At tick 0 the leukocyte is 5 patches away from the source. Cytokines diffuse at each tick following Fick’s law. At tick 4, the leukocyte moves to its topmost neighboring patch, since that patch has the highest cytokine concentration and space available. In next ticks, the leukocyte surveys it’s neighboring patches and moves to the one with space available and the highest concentration. At tick 8, it has reached the patch with the highest concentration (darkest). Each tick represents 1 hr.
Fig 3
Fig 3. Representative cardiac cycle to pass spatial WSS profile into ABM.
(A) Coronary blood flow rate profile used in CFD. Number of leukocytes undergoing TEM in 1 hour using instantaneous pulsatile flow over a spherical plaque with radius (B) 1.0 mm or (C) 1.5 mm. The average number leukocyte TEM per hour, over one cardiac cycle, is 16 for (B) and 26 for (C). The WSS profile at peak flow during systole corresponds to these average TEM values, as indicated by the dashed line and red ‘x’ marks.
Fig 4
Fig 4. Multiphysics model showing the handshaking between the ABM and CFD.
The coordinates of the inner arterial layer from ABM (left) is sent to COMSOL to perform CFD analysis (right). The instantaneous WSS from CFD is sent back to ABM and influences leukocyte TEM.
Fig 5
Fig 5. When the degree of stenosis was below 8%, the level of leukocyte TEM was constant over an average change in lumen volume of 107±5 patches, followed by a rapid increase in TEM over the next 28±17 patches.
(A) Scatter plot displaying leukocyte TEM and severity of stenosis as a function of luminal volume (patches). (B) Bar plot indicating the change in lumen volume after which a significant increase in leukocyte TEM was observed. (Mean ± SD, *p < 0.05). (C) Longitudinal cross sections of the ABM at ‘a’, ‘b’, and ‘c’ points from 5A, illustrating where the initial inward growth occurred. ACs, ECs, and leukocytes in the plaque are indicated in red, green and yellow, respectively. Black represents the new ECs added in the lumen. Inlet flow is at the bottom of each subfigure. (D) Subplot showing the number of patches (from ABM) with WSS < 1.2 Pa at specific plaque shapes (i.e., lumen volumes) corresponding to ‘a’, ‘b’, and ‘c’ points from 5A. Overlaid color contour plots of the WSS (from CFD) over the plaque at each point. The number of patches of low WSS (blue region) are almost constant (13 and 15 respectively) corresponding to nearly constant TEM. Then, the number of patches having low WSS increases (83) as does TEM. Inlet flow is at the left of each subfigure in (D).
Fig 6
Fig 6. Eccentric plaque growth and remodeling prediction.
Longitudinal (left) and corresponding transverse (right) views of an evolving artery where ECs, ACs and leukocytes are represented by green, red and yellow respectively. A) Initially the artery is impregnated with 15 leukocytes. B) At 6 months the plaque area is 40% of the lumen area and will start growing inside lumen according to Glagov’s phenomenon. C) At 7 months the plaque has grown inward and outward, changing the luminal geometry.
Fig 7
Fig 7. Different types of leukocytes present in the plaque as it evolves.
Before the plaque reduces the caliber of the lumen, as indicated by the vertical dashed red line, TEM is only due to endothelial activation by cytokines. Initially neutrophils constitute the majority of the plaque volume, followed by monocytes and monocyte-derived cells and then neutrophils again. When the plaque starts growing inside the lumen (vertical dashed line) leukocyte TEM is largely influenced by blood flow. With time the severity of stenosis increases and so does the region of low WSS. Therefore, the rate of leukocyte TEM is greater for all cells. Among these cells, the concentration of neutrophils (62%) in blood is higher than monocytes and lymphocytes (5.3% and 30% respectively). Also neutrophils adhere on the EC surface with WSS < 1.2 Pa whereas the monocytes and lymphocytes adhere with WSS < 1 Pa and < 0.4 Pa respectively. Thus there is a rapid increase of neutrophils immediately after 6 months whereas the rate for lymphocyte increases after several days when the plaque is bigger and WSS < 0.4 Pa.
Fig 8
Fig 8. ABM-CFD predictions corroborate an experimental porcine model of atherogenesis.
‘x’ represents mean plaque area from individual pigs, fed high cholesterol diet. ‘.‘represents predicted plaque area as a result of a 30% increase in LDLs.

References

    1. Willerson JT, Ridker PM. Inflammation as a cardiovascular risk factor. Circulation. 2004;109(21 Suppl 1):Ii2–10. Epub 2004/06/03. - PubMed
    1. Ross R. Atherosclerosis—An Inflammatory Disease. New England Journal of Medicine. 1999;340(2):115–26. doi: 10.1056/NEJM199901143400207 - DOI - PubMed
    1. Libby P. The Vascuar Biology of Atherosclerosis In: Braunwald E, Zipes DP, Libby P, editors. Heart Disease A Textbook of Cardiovascular Medicine. 6 Philadelphia: W.B. Sauders Company; 2001. p. 995–1009.
    1. Luscinskas FW, Ma S, Nusrat A, Parkos CA, Shaw SK. Leukocyte transendothelial migration: A junctional affair. Seminars in Immunology. 2002;14(2):105–13. doi: 10.1006/smim.2001.0347 - DOI - PubMed
    1. Muller WA. Mechanisms of Leukocyte Transendothelial Migration. Annual review of pathology. 2011;6:323–44. doi: 10.1146/annurev-pathol-011110-130224 - DOI - PMC - PubMed

Publication types