Differential expression of islet glutaredoxin 1 and 5 with high reactive oxygen species production in a mouse model of diabesity
- PMID: 28542222
- PMCID: PMC5443478
- DOI: 10.1371/journal.pone.0176267
Differential expression of islet glutaredoxin 1 and 5 with high reactive oxygen species production in a mouse model of diabesity
Abstract
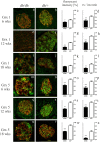
The onset and progression of diabetes mellitus type 2 is highly contingent on the amount of functional beta-cell mass. An underlying cause of beta-cell decay in diabetes is oxidative stress, which markedly affects the insulin producing pancreatic cells due to their poor antioxidant defence capacity. Consequently, disturbances of cellular redox signaling have been implicated to play a major role in beta-cell loss in diabetes mellitus type 2. There is evidence suggesting that the glutaredoxin (Grx) system exerts a protective role for pancreatic islets, but the exact mechanisms have not yet been elucidated. In this study, a mouse model for diabetes mellitus type 2 was used to gain further insight into the significance of Grx for the islets of Langerhans in the diabetic metabolism. We have observed distinct differences in the expression levels of Grx in pancreatic islets between obese, diabetic db mice and lean, non-diabetic controls. This finding is the first report about a decrease of Grx expression levels in pancreatic islets of diabetic mice which was accompanied by declining insulin secretion, increase of reactive oxygen species (ROS) production level, and cell cycle alterations. These data demonstrate the essential role of the Grx system for the beta-cell during metabolic stress which may provide a new target for diabetes mellitus type 2 treatment.
Conflict of interest statement
Figures


Similar articles
-
Divergent antioxidant capacity of human islet cell subsets: A potential cause of beta-cell vulnerability in diabetes and islet transplantation.PLoS One. 2018 May 3;13(5):e0196570. doi: 10.1371/journal.pone.0196570. eCollection 2018. PLoS One. 2018. PMID: 29723228 Free PMC article.
-
Increased expression of toll-like receptor 4 and inflammatory cytokines, interleukin-6 in particular, in islets from a mouse model of obesity and type 2 diabetes.APMIS. 2013 Jun;121(6):531-8. doi: 10.1111/apm.12018. Epub 2012 Nov 8. APMIS. 2013. PMID: 23134512
-
CART is overexpressed in human type 2 diabetic islets and inhibits glucagon secretion and increases insulin secretion.Diabetologia. 2016 Sep;59(9):1928-37. doi: 10.1007/s00125-016-4020-6. Epub 2016 Jun 23. Diabetologia. 2016. PMID: 27338624
-
Islet redox stress: the manifold toxicities of insulin resistance, metabolic syndrome and amylin derived islet amyloid in type 2 diabetes mellitus.JOP. 2002 Jul;3(4):86-108. JOP. 2002. PMID: 12110767 Review.
-
Modulation of the pancreatic islet-stress axis as a novel potential therapeutic target in diabetes mellitus.Vitam Horm. 2014;95:195-222. doi: 10.1016/B978-0-12-800174-5.00008-9. Vitam Horm. 2014. PMID: 24559919 Review.
Cited by
-
Diabetes as a potential compounding factor in COVID-19-mediated male subfertility.Cell Biosci. 2022 Mar 20;12(1):35. doi: 10.1186/s13578-022-00766-x. Cell Biosci. 2022. PMID: 35307018 Free PMC article. Review.
-
Loss and Recovery of Glutaredoxin 5 Is Inducible by Diet in a Murine Model of Diabesity and Mediated by Free Fatty Acids In Vitro.Antioxidants (Basel). 2022 Apr 15;11(4):788. doi: 10.3390/antiox11040788. Antioxidants (Basel). 2022. PMID: 35453472 Free PMC article.
-
Distinct Shift in Beta-Cell Glutaredoxin 5 Expression Is Mediated by Hypoxia and Lipotoxicity Both In Vivo and In Vitro.Front Endocrinol (Lausanne). 2018 Mar 12;9:84. doi: 10.3389/fendo.2018.00084. eCollection 2018. Front Endocrinol (Lausanne). 2018. PMID: 29593651 Free PMC article.
-
Glucose metabolism and pyruvate carboxylase enhance glutathione synthesis and restrict oxidative stress in pancreatic islets.Cell Rep. 2021 Nov 23;37(8):110037. doi: 10.1016/j.celrep.2021.110037. Cell Rep. 2021. PMID: 34818536 Free PMC article.
References
-
- American Diabetes Association. Report of the Expert Committee on the Diagnosis and Classification of Diabetes Mellitus. Diabetes Care. 2003;26:Suppl 1:S5–20. - PubMed
MeSH terms
Substances
LinkOut - more resources
Full Text Sources
Other Literature Sources
Medical
Molecular Biology Databases
Miscellaneous

