. 2017 May 19;11(5):e0005616.
doi: 10.1371/journal.pntd.0005616. eCollection 2017 May.

Measuring changes in transmission of neglected tropical diseases, malaria, and enteric pathogens from quantitative antibody levels

Affiliations

Measuring changes in transmission of neglected tropical diseases, malaria, and enteric pathogens from quantitative antibody levels

Benjamin F Arnold et al. PLoS Negl Trop Dis. .

Abstract

Background: Serological antibody levels are a sensitive marker of pathogen exposure, and advances in multiplex assays have created enormous potential for large-scale, integrated infectious disease surveillance. Most methods to analyze antibody measurements reduce quantitative antibody levels to seropositive and seronegative groups, but this can be difficult for many pathogens and may provide lower resolution information than quantitative levels. Analysis methods have predominantly maintained a single disease focus, yet integrated surveillance platforms would benefit from methodologies that work across diverse pathogens included in multiplex assays.

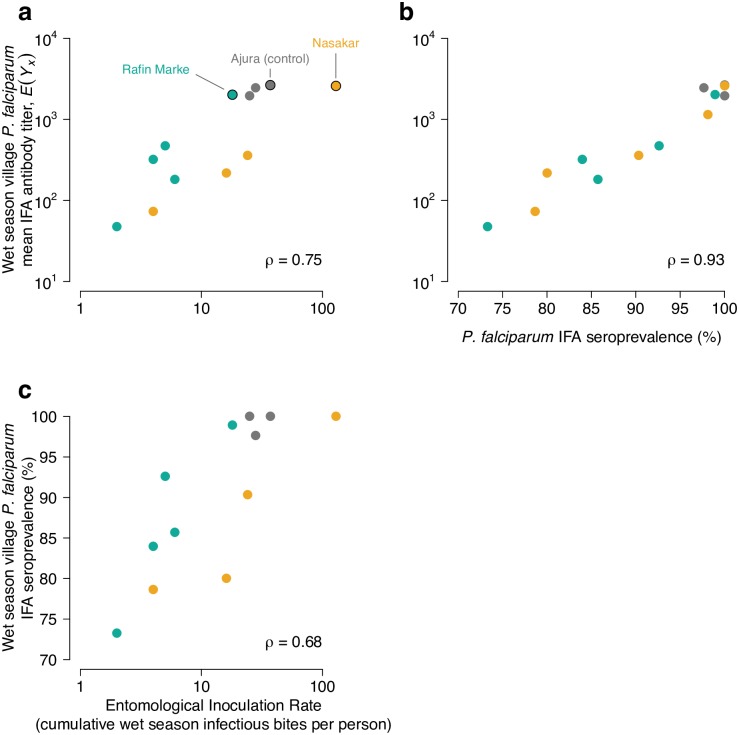
Methods/principal findings: We developed an approach to measure changes in transmission from quantitative antibody levels that can be applied to diverse pathogens of global importance. We compared age-dependent immunoglobulin G curves in repeated cross-sectional surveys between populations with differences in transmission for multiple pathogens, including: lymphatic filariasis (Wuchereria bancrofti) measured before and after mass drug administration on Mauke, Cook Islands, malaria (Plasmodium falciparum) before and after a combined insecticide and mass drug administration intervention in the Garki project, Nigeria, and enteric protozoans (Cryptosporidium parvum, Giardia intestinalis, Entamoeba histolytica), bacteria (enterotoxigenic Escherichia coli, Salmonella spp.), and viruses (norovirus groups I and II) in children living in Haiti and the USA. Age-dependent antibody curves fit with ensemble machine learning followed a characteristic shape across pathogens that aligned with predictions from basic mechanisms of humoral immunity. Differences in pathogen transmission led to shifts in fitted antibody curves that were remarkably consistent across pathogens, assays, and populations. Mean antibody levels correlated strongly with traditional measures of transmission intensity, such as the entomological inoculation rate for P. falciparum (Spearman's rho = 0.75). In both high- and low transmission settings, mean antibody curves revealed changes in population mean antibody levels that were masked by seroprevalence measures because changes took place above or below the seropositivity cutoff.

Conclusions/significance: Age-dependent antibody curves and summary means provided a robust and sensitive measure of changes in transmission, with greatest sensitivity among young children. The method generalizes to pathogens that can be measured in high-throughput, multiplex serological assays, and scales to surveillance activities that require high spatiotemporal resolution. Our results suggest quantitative antibody levels will be particularly useful to measure differences in exposure for pathogens that elicit a transient antibody response or for monitoring populations with very high- or very low transmission, when seroprevalence is less informative. The approach represents a new opportunity to conduct integrated serological surveillance for neglected tropical diseases, malaria, and other infectious diseases with well-defined antigen targets.


Conflict of interest statement

The authors have declared that no competing interests exist.

Figures

Fig 1
Fig 1. A shift in the Wuchereria bancrofti Wb123 age-antibody curve measures a reduction in transmission due to mass drug administration (MDA) on Mauke Island.
IgG antibody response to the Wb123 antigen for W. bancrofti measured in blood specimens from residents in 1975 (N = 362) before MDA and again in 1992 (N = 553), five years following a single, island-wide MDA with diethylcarbamazine. a, Mean antibody levels E(Ya,x) by age (a) and survey year (x); individual antibody responses (points) are shown along with summary curves. b, Age-adjusted geometric mean antibody response, E(Yx), and 95% confidence intervals before (1975) and five years after (1992) MDA, stratified by 5 year age category (all differences significant at P ≤ 0.0001 after Bonferroni correction). c, Wb123 antibody response in 1975 and 1992 stratified by the presence of circulating filarial antigens (Ag) at each measurement in the subsample of 112 individuals who were measured at both time points (two individuals not shown were Ag- in 1975 and Ag+ in 1992), along with age-adjusted geometric means, E(Yx), and 95% confidence intervals. Differences between means are significant (Bonferroni corrected P ≤ 0.01) except for the Ag+/Ag+ group. Individual trajectories are colored by the higher of the two measurements: decreases are orange, increases are blue. The source data used to generate this figure are here: https://osf.io/8tqu4 (mauke), and the scripts used to generate the figure are here: https://osf.io/ek3sx (mauke).
Fig 2
Fig 2. Shifts in the Plasmodium falciparum age-antibody curve measure changes in malaria transmission due to intervention in the Garki Project, Nigeria (1970–1976).
Antibody response measured with the IgG indirect fluorescent antibody (IFA) test for P. falciparum using semi-quantitative antibody titers (a) or reduced to seroprevalence (b). Estimates stratified by pre-intervention period wet and dry seasons (survey rounds 1–2), active intervention period (survey rounds 3–5, at 20, 50, and 70 weeks following the start of intervention), and the post-intervention period (survey rounds 6–8 at 20, 40, and 90 weeks following the end of the intervention). N = 4,774 total measurements, with 153–442 measurements per curve. Control measurements were combined across survey rounds within each period when plotting the curves to facilitate visual comparison of shifts in transmission between surveys. Age-adjusted means by intervention group, E(Yx), provide summary differences between curves at each survey round. Error bars show 95% confidence intervals for the age-adjusted geometric means or seroprevalence and differences between groups are significant P ≤ 0.01 (Bonferroni corrected) for all rounds except pre-intervention surveys 1 and 2. Control villages were not measured in survey 6. The source data used to generate this figure are here: https://osf.io/8tqu4 (garki), and the scripts used to generate the figure are here: https://osf.io/ek3sx (garki).
Fig 3
Fig 3. Comparison of mean Plasmodium falciparum IFA antibody titers with wet season entomological inoculation rate (EIR) and IFA seroprevalence in the three study villages with paired entomological and serological measurements.
a, P. falciparum IFA titers versus EIR. b P. falciparum IFA titers versus seroprevalence. c, P. falciparum seroprevalence versus EIR. Ajura was a control village (no treatment) while Rafine Marke and Nasakar were intervention villages. A single data point outside the figure range is not shown in EIR plots (Nasakar 1972, EIR value = 0, E(Yx) = 103.0591), but was included in the Spearman’s rank correlation estimates (ρ). The source data used to generate this figure are here: https://osf.io/8tqu4 (garki), and the scripts used to generate the figure are here: https://osf.io/ek3sx (garki).
Fig 4
Fig 4. Higher sensitivity among children <5 y to seasonal changes in Plasmodium falciparum transmission as depicted by age-antibody curves estimated within control villages in the Garki Project, Nigeria (1970–1976).
Antibody response measured with the IgG indirect fluorescent antibody (IFA) test for P. falciparum. a, Mean antibody levels by age (a) and season (x), E(Ya,x). b, Age-adjusted geometric means by age category and season, E(Yx), summarize the curves. Error bars show 95% confidence intervals and P-values mark significant differences (Bonferroni corrected) between adjacent seasons. The source data used to generate this figure are here: https://osf.io/8tqu4 (garki), and the scripts used to generate the figure are here: https://osf.io/ek3sx (garki).
Fig 5
Fig 5. Differences in enteric pathogen transmission between children in Leogane, Haiti (N = 511) and the United States (USA) (N = 86) measured by age-antibody curves.
Antibody response measured as median fluorescence intensity (MFI) minus background in multiplex bead assays on the Luminex platform. In each panel, individual antibody responses (points) are shown along with age-dependent means. Each panel also includes the geometric mean by country, E(Yx), with error bars marking 95% confidence intervals (all differences significant at P ≤ 0.001 after Bonferroni correction). a. Cryptosporidium parvum recombinant 17-kDa antigen; b. Cryptosporidium parvum recombinant 27-kDa antigen; c. Giardia intestinalis variant-specific surface protein-5 (VSP-5); d. Entamoeba histolytica lectin adhesion molecule (LecA); e. enterotoxigenic Escherichia coli (ETEC) heat labile toxin β subunit; f. Salmonella spp. lipopolysaccharide (LPS) Group B; g. Norovirus Group I.4; h. Norovirus Group II.4 New Orleans. The source data used to generate this figure are here: https://osf.io/8tqu4 (enterics), and the scripts used to generate the figure are here: https://osf.io/ek3sx (enterics).

References

    1. Hotez PJ, Molyneux DH, Fenwick A, Kumaresan J, Sachs SE, Sachs JD, et al. Control of neglected tropical diseases. N Engl J Med. 2007;357: 1018–1027. 10.1056/NEJMra064142 - DOI - PubMed
    1. Lammie PJ, Moss DM, Brook Goodhew E, Hamlin K, Krolewiecki A, West SK, et al. Development of a new platform for neglected tropical disease surveillance. Int J Parasitol. 2012;42: 797–800. 10.1016/j.ijpara.2012.07.002 - DOI - PubMed
    1. Corran P, Coleman P, Riley E, Drakeley C. Serology: a robust indicator of malaria transmission intensity? Trends Parasitol. 2007;23: 575–582. 10.1016/j.pt.2007.08.023 - DOI - PubMed
    1. Hens N, Shkedy Z, Aerts M, Damme CFPV, Beutels P. Modeling Infectious Disease Parameters Based on Serological and Social Contact Data. Springer; 2012.
    1. Rogier E, Wiegand R, Moss D, Priest J, Angov E, Dutta S, et al. Multiple comparisons analysis of serological data from an area of low Plasmodium falciparum transmission. Malar J. 2015;14: 436 10.1186/s12936-015-0955-1 - DOI - PMC - PubMed

MeSH terms