

Discerning morpho-anatomical, physiological and molecular multiformity in cultivated and wild genotypes of lentil with reconciliation to salinity stress
- PMID: 28542267
- PMCID: PMC5444645
- DOI: 10.1371/journal.pone.0177465
Discerning morpho-anatomical, physiological and molecular multiformity in cultivated and wild genotypes of lentil with reconciliation to salinity stress
Erratum in
-
Correction: Discerning morpho-anatomical, physiological and molecular multiformity in cultivated and wild genotypes of lentil with reconciliation to salinity stress.PLoS One. 2017 Dec 28;12(12):e0190462. doi: 10.1371/journal.pone.0190462. eCollection 2017. PLoS One. 2017. PMID: 29284041 Free PMC article.
Abstract
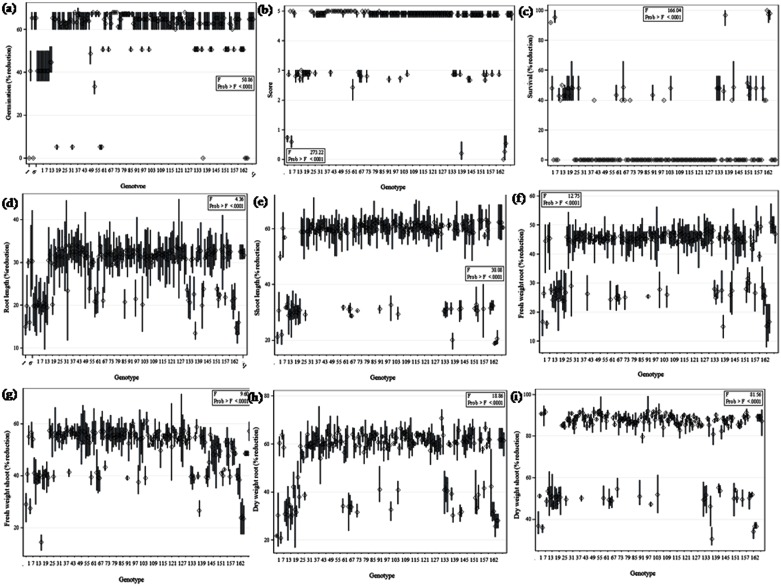
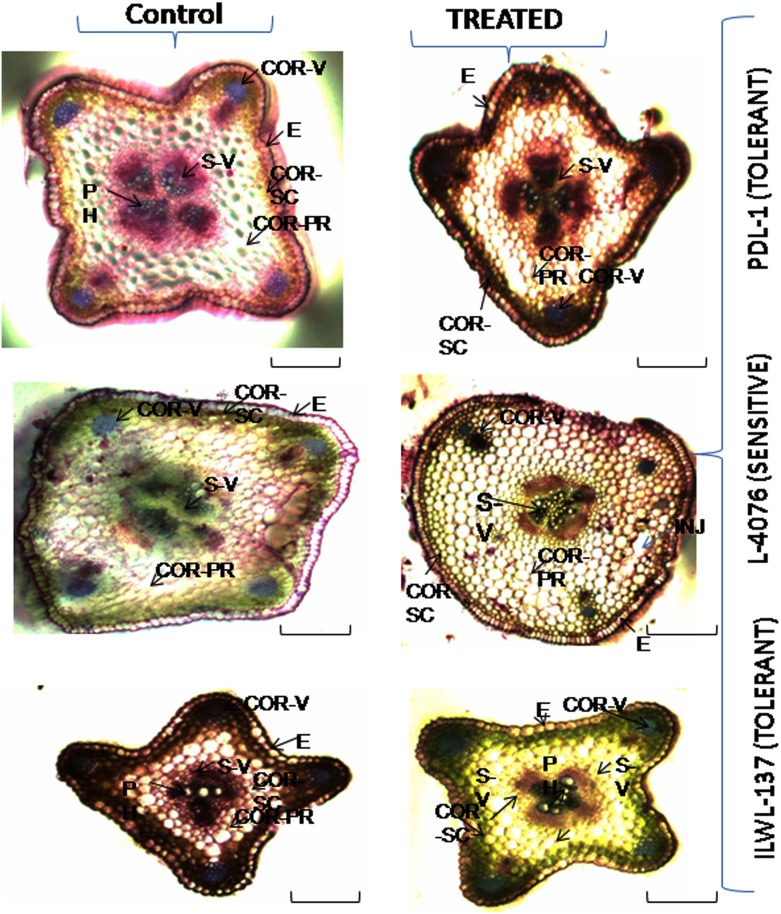
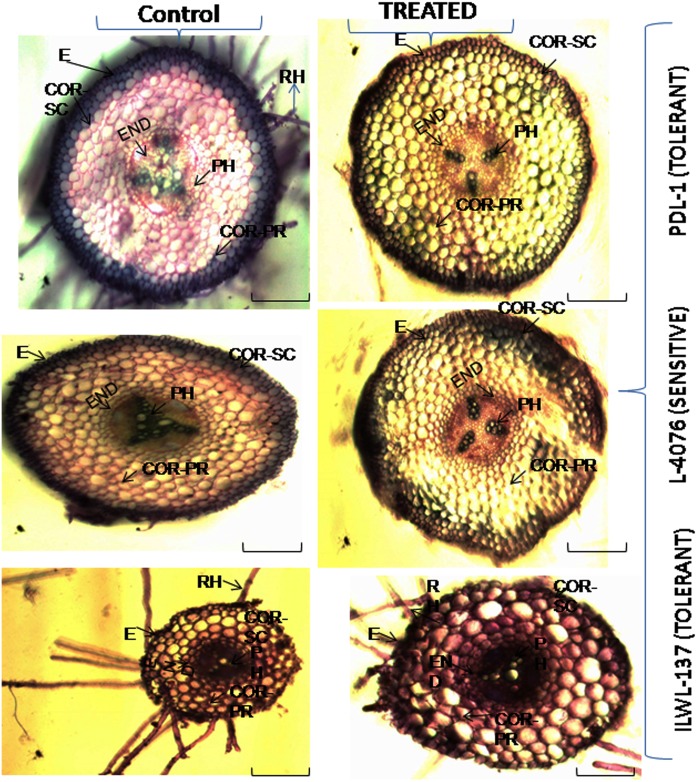
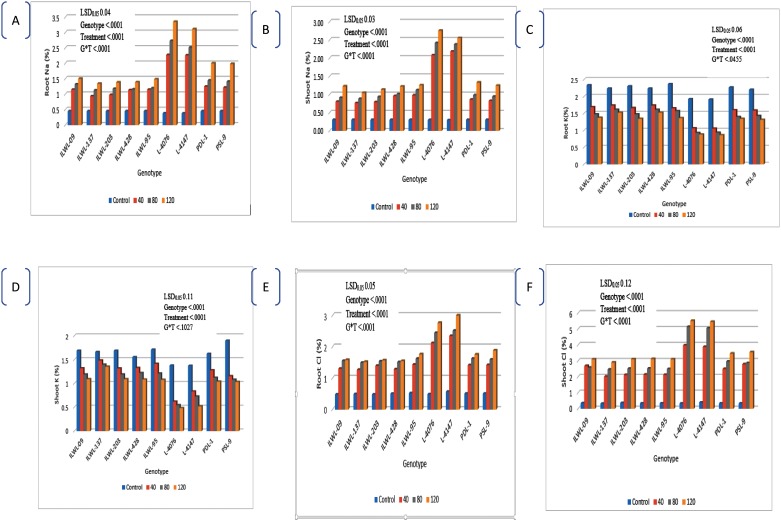
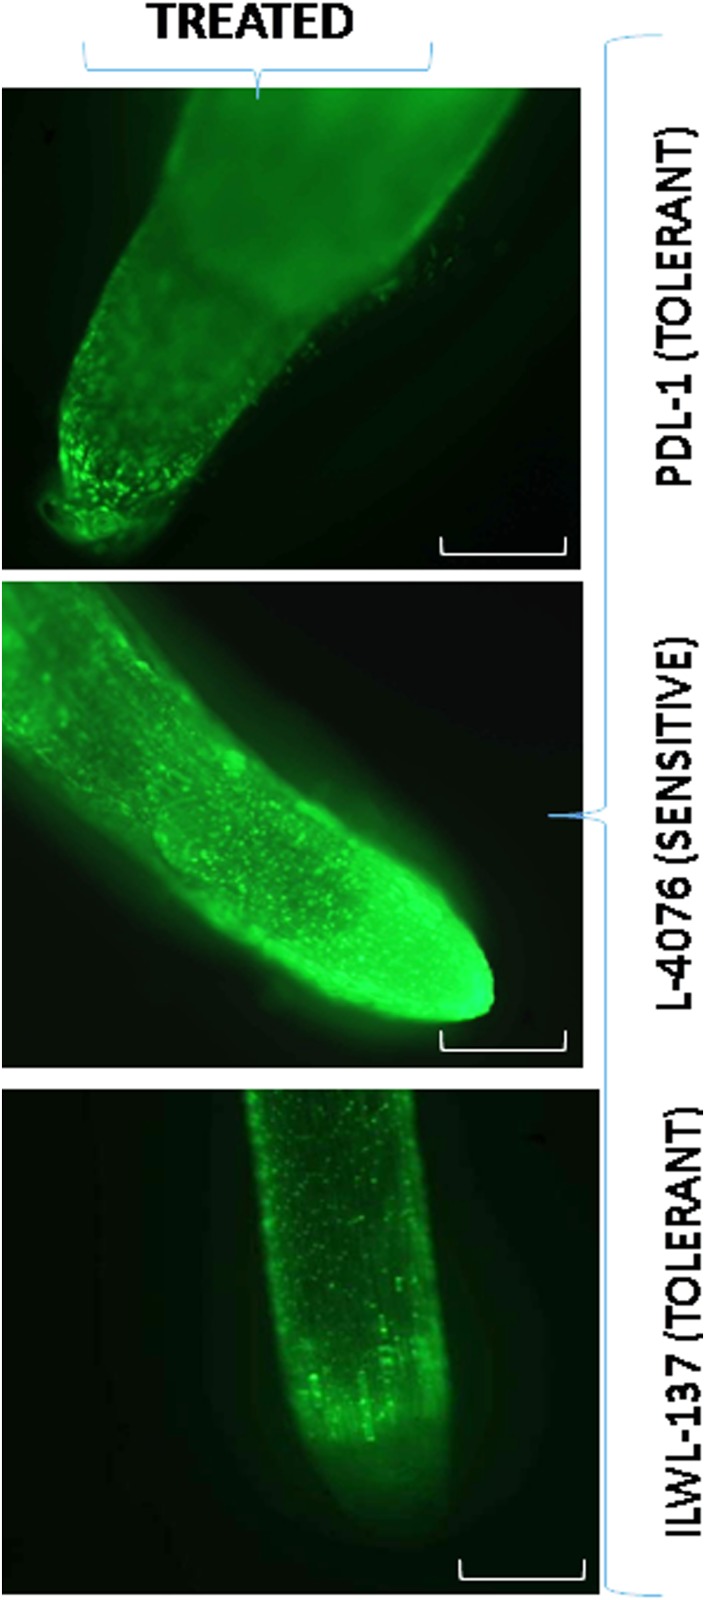
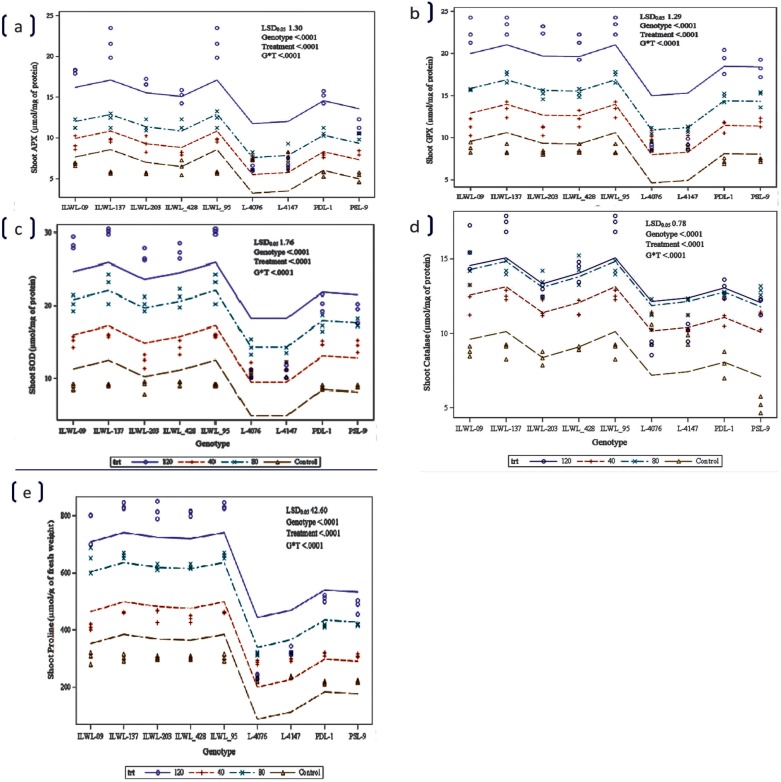
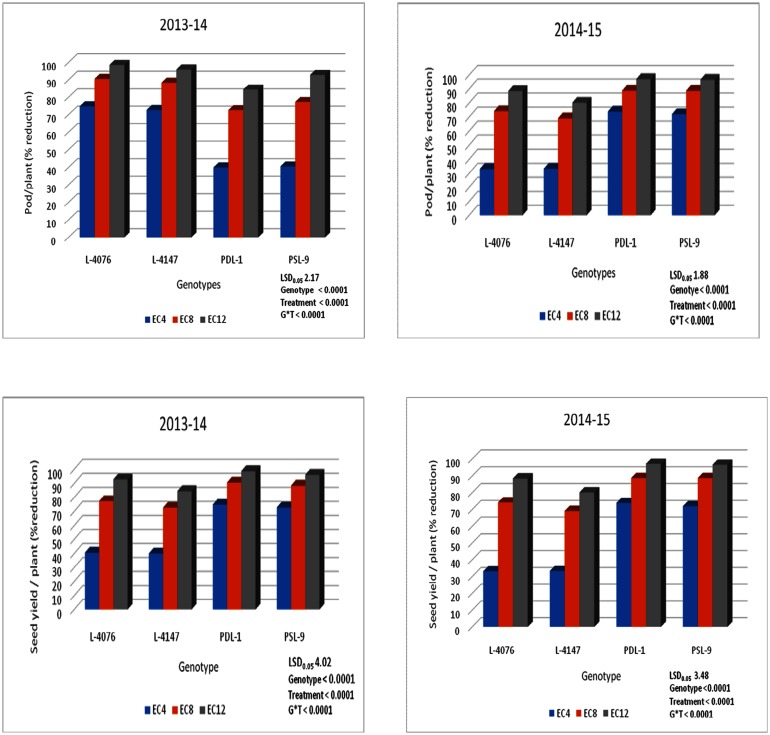
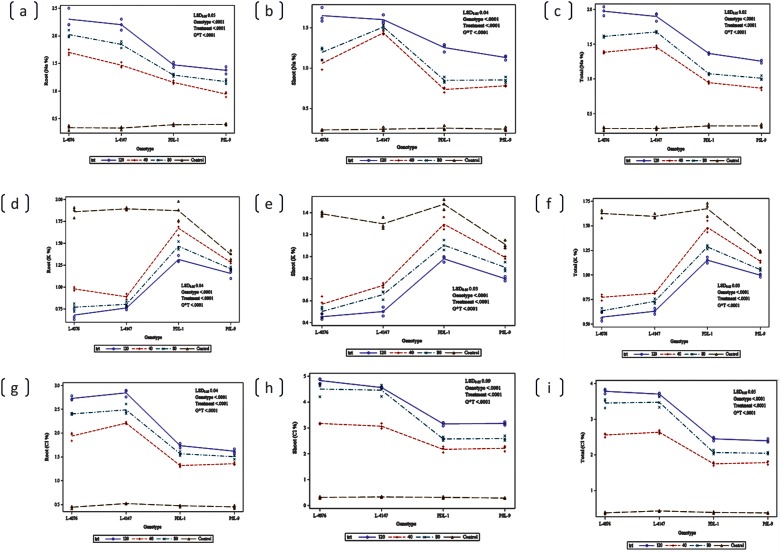
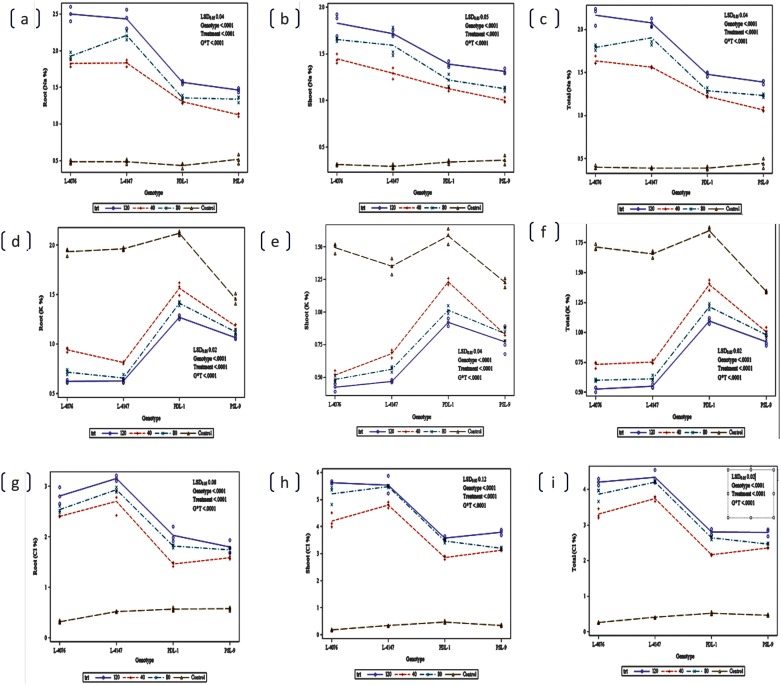
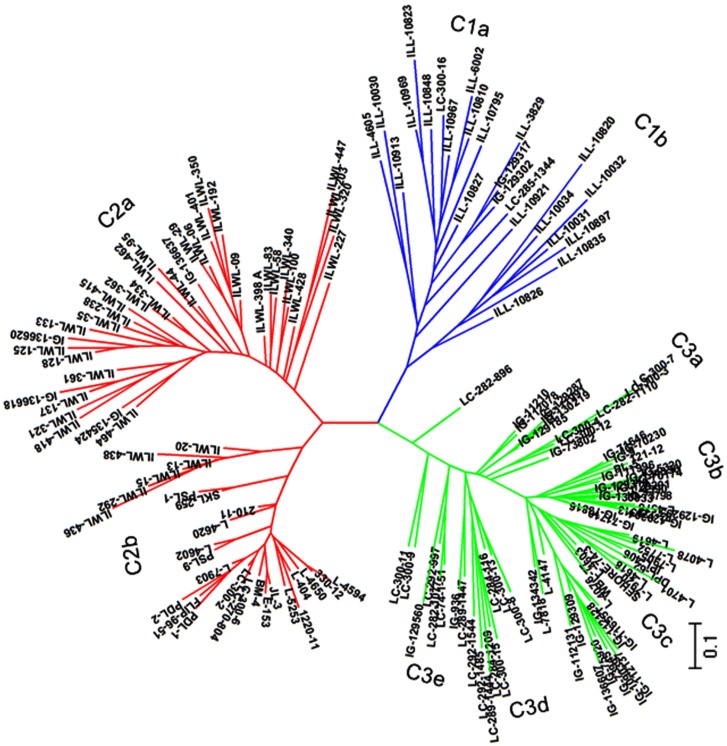
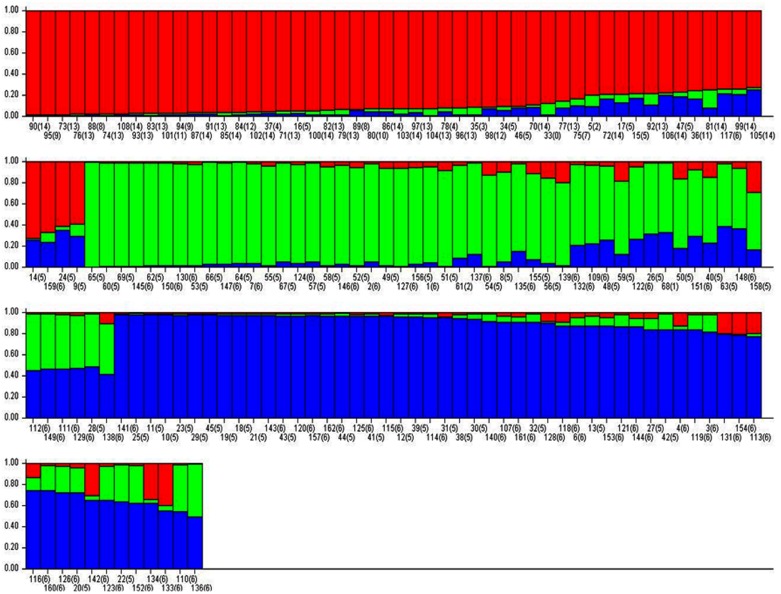
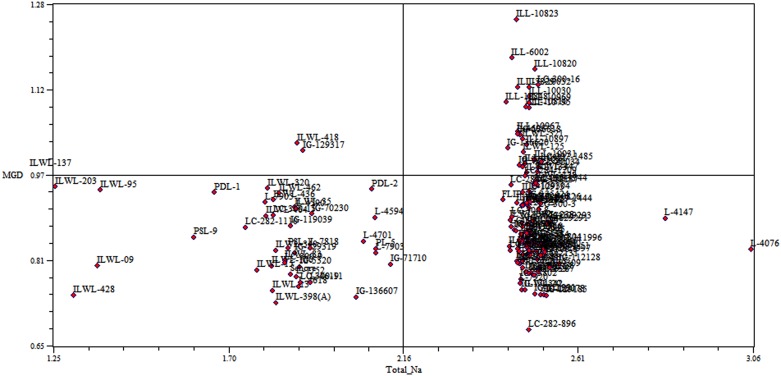
One hundred and sixty two genotypes of different Lens species were screened for salinity tolerance in hydroponics at 40, 80 and 120 mM sodium chloride (NaCl) for 30 d. The germination, seedling growth, biomass accumulation, seedling survivability, salinity scores, root and shoot anatomy, sodium ion (Na+), chloride ion (Cl-) and potassium ion (K+) concentrations, proline and antioxidant activities were measured to evaluate the performance of all the genotypes. The results were compared in respect of physiological (Na+, K+ and Cl-) and seed yield components obtained from field trials for salinity stress conducted during two years. Expression of salt tolerance in hydroponics was found to be reliable indicator for similarity in salt tolerance between genotypes and was evident in saline soil based comparisons. Impressive genotypic variation for salinity tolerance was observed among the genotypes screened under hydroponic and saline field conditions. Plant concentrations of Na+ and Cl- at 120 mM NaCl were found significantly correlated with germination, root and shoot length, fresh and dry weight of roots and shoots, seedling survivability, salinity scores and K+ under controlled conditions and ranked the genotypes along with their seed yield in the field. Root and shoot anatomy of tolerant line (PDL-1) and wild accession (ILWL-137) showed restricted uptake of Na+ and Cl- due to thick layer of their epidermis and endodermis as compared to sensitive cultigen (L-4076). All the genotypes were scanned using SSR markers for genetic diversity, which generated high polymorphism. On the basis of cluster analysis and population structure the contrasting genotypes were grouped into different classes. These markers may further be tested to explore their potential in marker-assisted selection.
Conflict of interest statement
Figures
References
-
- Akhtar P, Hussain F (2009) Growth performance of Vicia sativa under saline conditions. Pak J Bot 41(6): 3075–3080.
-
- Ebbisa A, Getachew E (2015) Influence of different salinity concentration on growth and nodulations of chickpea (Cicer arietinum L.) at Jimma, Southwest Ethiopia. Int J Innovative Appl Res 3 (8):1–9.
-
- Mahmood A, Athar M, Qadri R, Mahmood N (2008) Effect of NaCl salinity on growth, nodulation and total nitrogen content in Sesbania sesban. Agric conspec Sci 73(3): 137–141.
-
- Abdel-Haleem A, El-Shaieny H (2015). Seed germination percentage and early seedling establishment of five (Vigna unguiculata L. (Walp) genotypes under salt stress. European J Exp Biol 5(2): 22–32,
MeSH terms
Substances
LinkOut - more resources
Full Text Sources
Other Literature Sources
Research Materials
