

Consistent multi-level trophic effects of marine reserve protection across northern New Zealand
- PMID: 28542268
- PMCID: PMC5443496
- DOI: 10.1371/journal.pone.0177216
Consistent multi-level trophic effects of marine reserve protection across northern New Zealand
Abstract
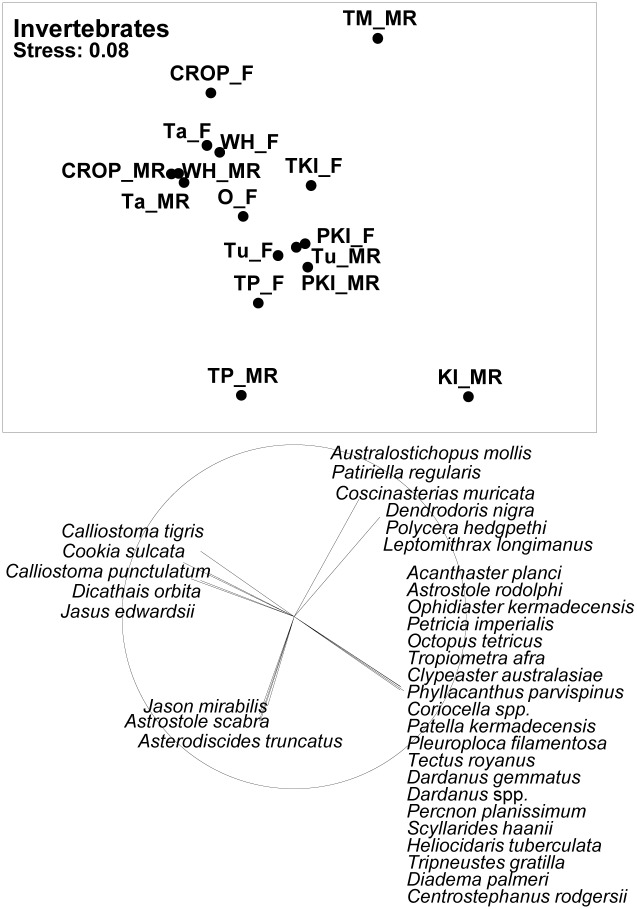
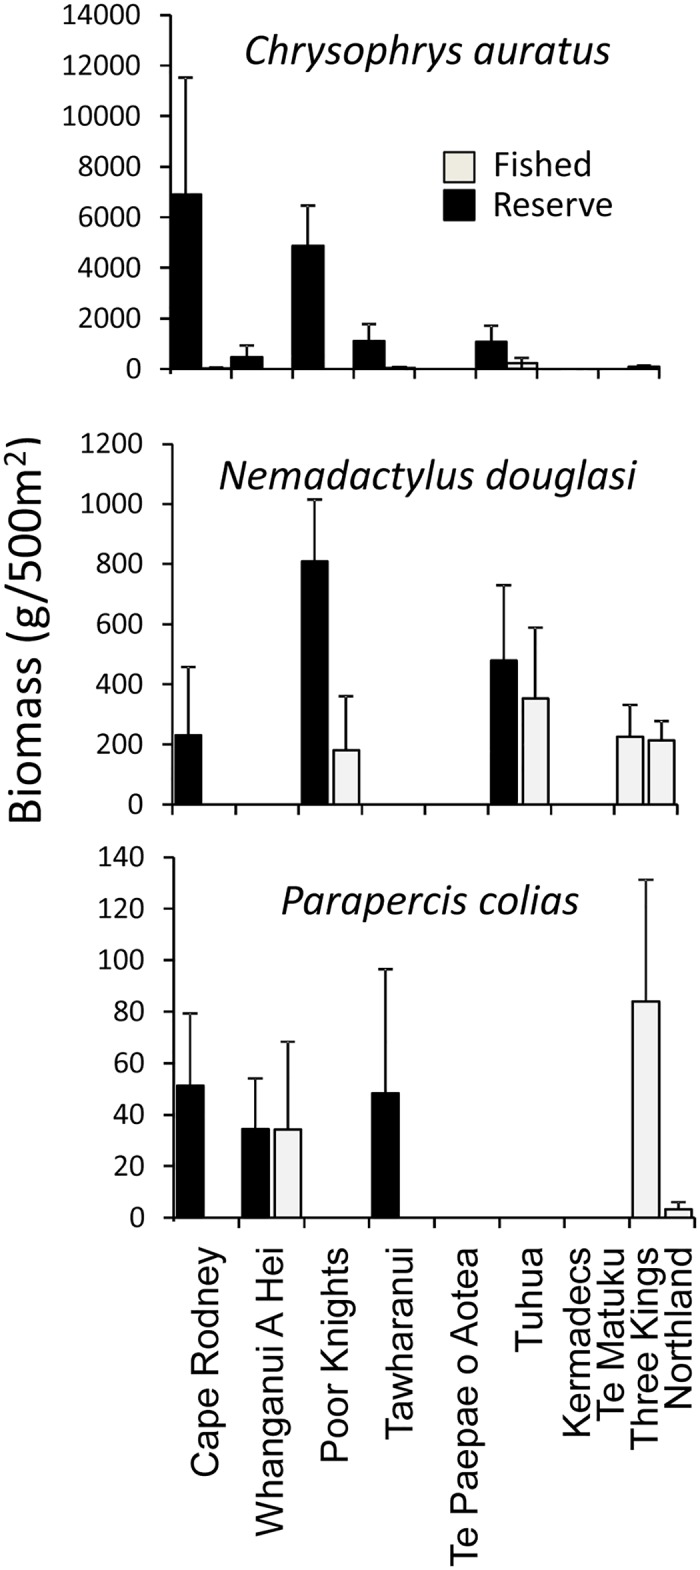
Through systematic Reef Life Survey censuses of rocky reef fishes, invertebrates and macroalgae at eight marine reserves across northern New Zealand and the Kermadec Islands, we investigated whether a system of no-take marine reserves generates consistent biodiversity outcomes. Ecological responses of reef assemblages to protection from fishing, including potential trophic cascades, were assessed using a control-impact design for the six marine reserves studied with associated reference sites, and also by comparing observations at reserve sites with predictions from random forest models that assume reserve locations are fished. Reserve sites were characterised by higher abundance and biomass of large fishes than fished sites, most notably for snapper Chrysophrys auratus, with forty-fold higher observed biomass inside relative to out. In agreement with conceptual models, significant reserve effects not only reflected direct interactions between fishing and targeted species (higher large fish biomass; higher snapper and lobster abundance), but also second order interactions (lower urchin abundance), third order interactions (higher kelp cover), and fourth order interactions (lower understory algal cover). Unexpectedly, we also found: (i) a consistent trend for higher (~20%) Ecklonia cover across reserves relative to nearby fished sites regardless of lobster and urchin density, (ii) an inconsistent response of crustose coralline algae to urchin density, (iii) low cover of other understory algae in marine reserves with few urchins, and (iv) more variable fish and benthic invertebrate communities at reserve relative to fished locations. Overall, reef food webs showed complex but consistent responses to protection from fishing in well-enforced temperate New Zealand marine reserves. The small proportion of the northeastern New Zealand coastal zone located within marine reserves (~0.2%) encompassed a disproportionately large representation of the full range of fish and benthic invertebrate biodiversity within this region.
Conflict of interest statement
Figures


Similar articles
-
Context-dependent effects of fishing: variation in trophic cascades across environmental gradients.Ecol Appl. 2008 Dec;18(8):1860-73. doi: 10.1890/07-1776.1. Ecol Appl. 2008. PMID: 19263884
-
Marine reserves demonstrate top-down control of community structure on temperate reefs.Oecologia. 2002 Jun;132(1):131-142. doi: 10.1007/s00442-002-0920-x. Epub 2002 Jun 1. Oecologia. 2002. PMID: 28547276
-
Expectations and Outcomes of Reserve Network Performance following Re-zoning of the Great Barrier Reef Marine Park.Curr Biol. 2015 Apr 20;25(8):983-92. doi: 10.1016/j.cub.2015.01.073. Epub 2015 Mar 26. Curr Biol. 2015. PMID: 25819564
-
Larval dispersal and movement patterns of coral reef fishes, and implications for marine reserve network design.Biol Rev Camb Philos Soc. 2015 Nov;90(4):1215-47. doi: 10.1111/brv.12155. Epub 2014 Nov 25. Biol Rev Camb Philos Soc. 2015. PMID: 25423947 Review.
-
Invertebrate health in marine protected areas (MPAs).J Invertebr Pathol. 2021 Nov;186:107524. doi: 10.1016/j.jip.2020.107524. Epub 2020 Dec 24. J Invertebr Pathol. 2021. PMID: 33359479 Review.
Cited by
-
Network of small no-take marine reserves reveals greater abundance and body size of fisheries target species.PLoS One. 2019 Jan 10;14(1):e0204970. doi: 10.1371/journal.pone.0204970. eCollection 2019. PLoS One. 2019. PMID: 30629577 Free PMC article.
-
Kelp forests versus urchin barrens: a comparison of ecosystem functions and services provided by two alternative stable marine habitats.Proc Biol Sci. 2024 Nov;291(2034):20241539. doi: 10.1098/rspb.2024.1539. Epub 2024 Nov 6. Proc Biol Sci. 2024. PMID: 39501886 Free PMC article.
-
Exceptionally high but still growing predatory reef fish biomass after 23 years of protection in a Marine Protected Area.PLoS One. 2021 Feb 8;16(2):e0246335. doi: 10.1371/journal.pone.0246335. eCollection 2021. PLoS One. 2021. PMID: 33556064 Free PMC article.
-
Evaluating the social and ecological effectiveness of partially protected marine areas.Conserv Biol. 2021 Jun;35(3):921-932. doi: 10.1111/cobi.13677. Epub 2021 Jan 14. Conserv Biol. 2021. PMID: 33448038 Free PMC article.
References
-
- Ballantine W. Fifty years on: lessons from marine reserves in New Zealand and principles for a worldwide network. Biological Conservation. 2014;176 297–307.
-
- Ballantine B. Marine Reserves for New Zealand. University of Auckland, Leigh Laboratory Bulletin. 1991;25:1–196.
-
- Babcock RC. Leigh Marine Laboratory contributions to marine conservation. New Zealand Journal of Marine and Freshwater Research. 2013;47:360–73.
-
- Department of Conservation and Ministry of Fisheries. Marine protected areas policy and implementation plan. Wellington, New Zealand: Department of Conservation and Ministry of Fisheries; 2005.
-
- Department of Conservation and Ministry of Environment. The New Zealand biodiversity strategy. Wellington, New Zealand: Department of Conservation and Ministry of Environment; 2000.
MeSH terms
LinkOut - more resources
Full Text Sources
Other Literature Sources
Miscellaneous
